. 2022 Apr 20;13(1):2154.
doi: 10.1038/s41467-022-29647-0.

Targeting brain lesions of non-small cell lung cancer by enhancing CCL2-mediated CAR-T cell migration

Affiliations

Targeting brain lesions of non-small cell lung cancer by enhancing CCL2-mediated CAR-T cell migration

Hongxia Li et al. Nat Commun. .

Abstract

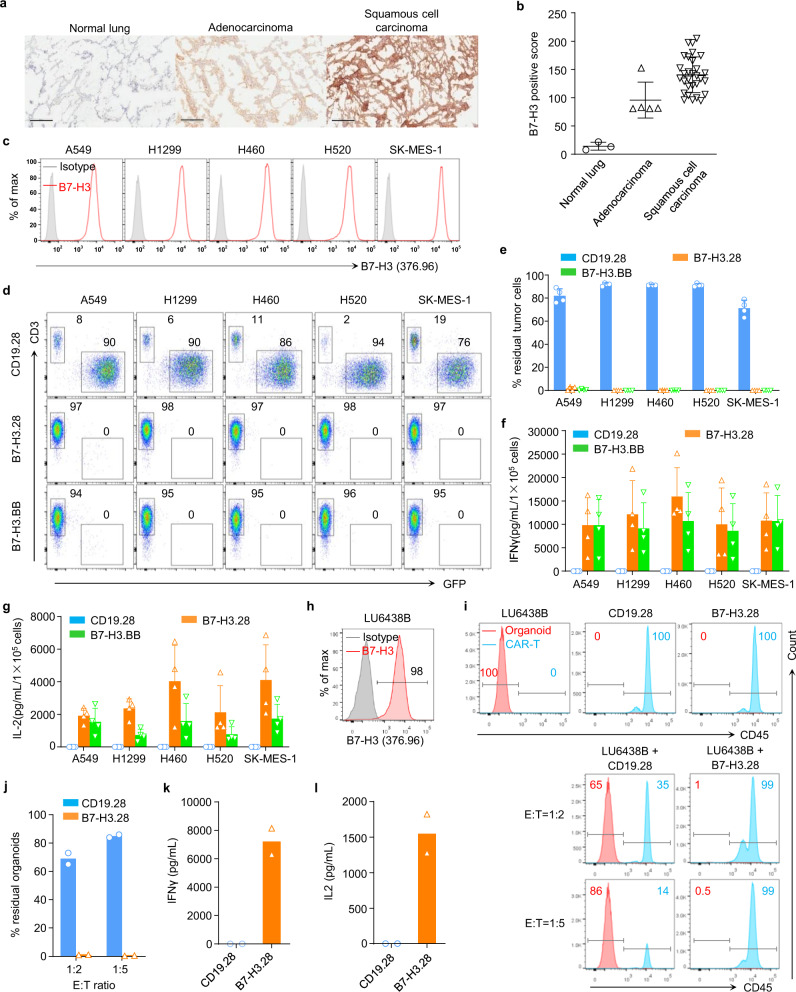
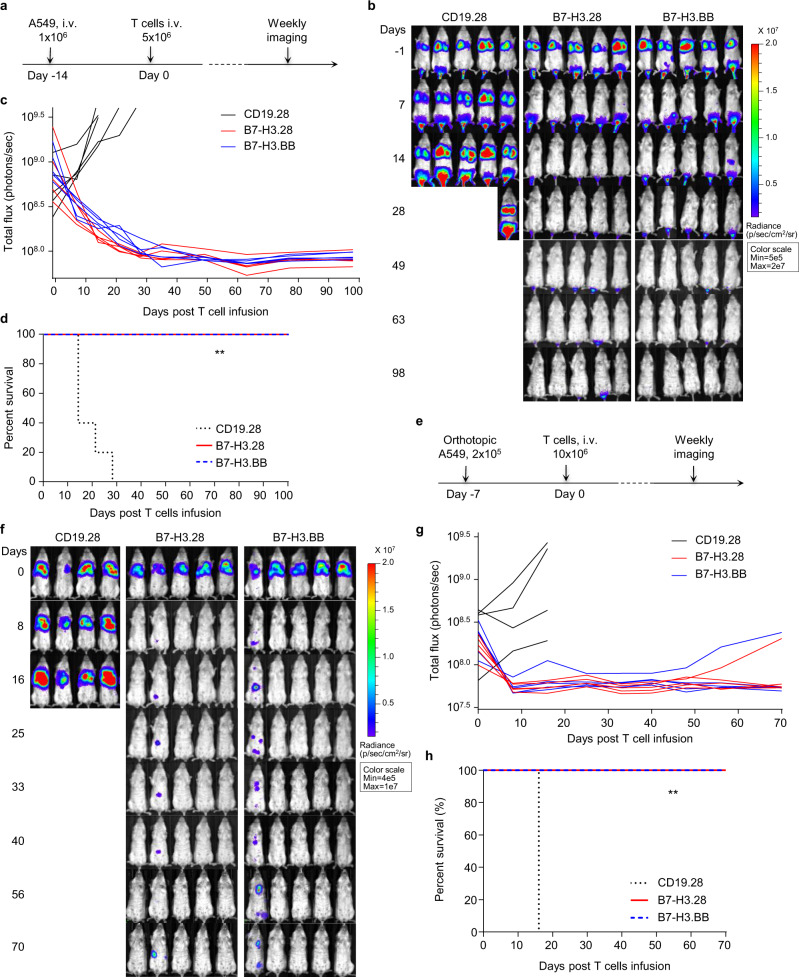
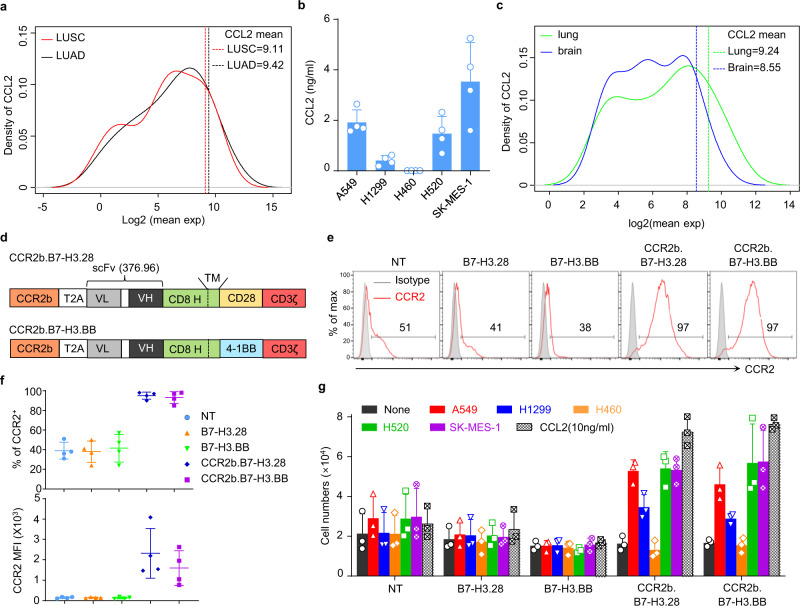
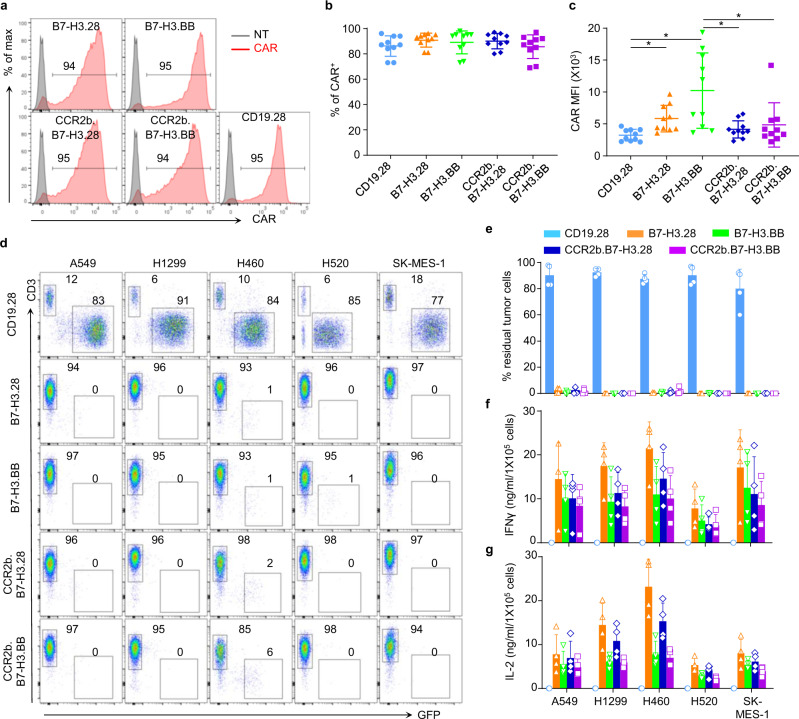
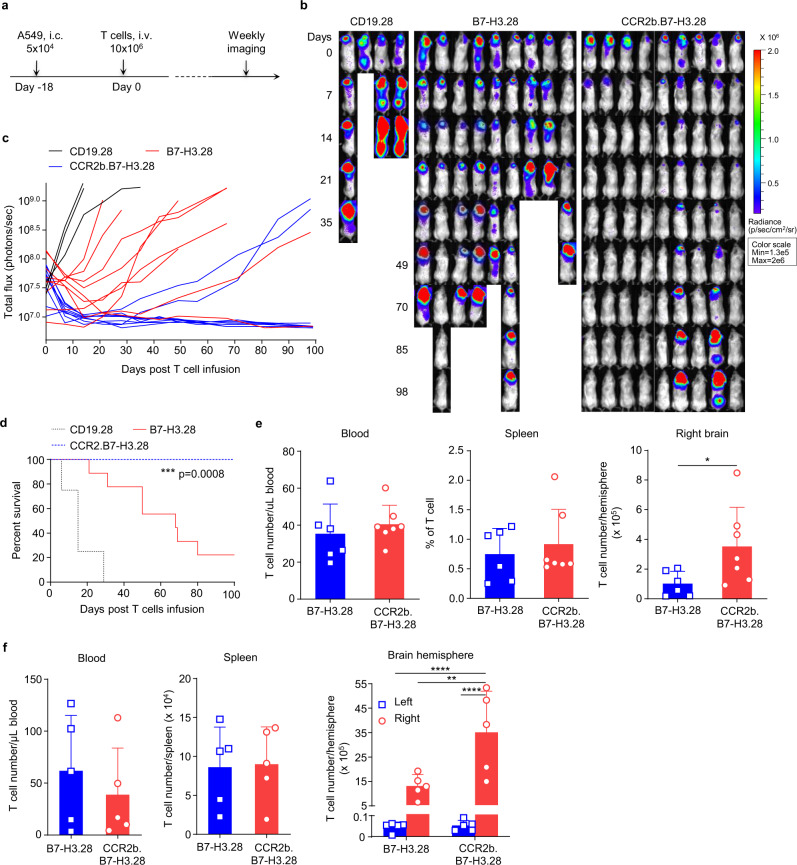
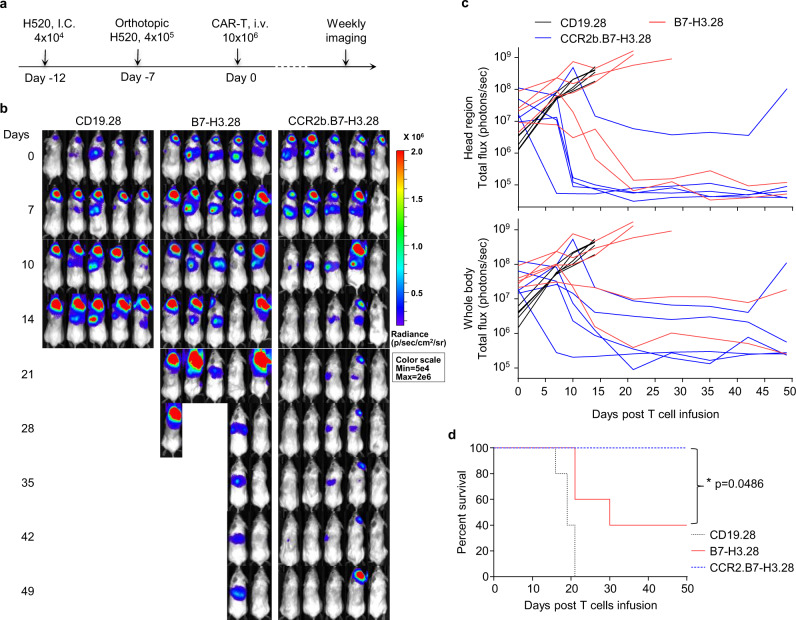
Metastatic non-small cell lung cancer (NSCLC) remains largely incurable and the prognosis is extremely poor once it spreads to the brain. In particular, in patients with brain metastases, the blood brain barrier (BBB) remains a significant obstacle for the biodistribution of antitumor drugs and immune cells. Here we report that chimeric antigen receptor (CAR) T cells targeting B7-H3 (B7-H3.CAR) exhibit antitumor activity in vitro against tumor cell lines and lung cancer organoids, and in vivo in xenotransplant models of orthotopic and metastatic NSCLC. The co-expression of the CCL2 receptor CCR2b in B7-H3.CAR-T cells, significantly improves their capability of passing the BBB, providing enhanced antitumor activity against brain tumor lesions. These findings indicate that leveraging T-cell chemotaxis through CCR2b co-expression represents a strategy to improve the efficacy of adoptive T-cell therapies in patients with solid tumors presenting with brain metastases.


Conflict of interest statement

G.D. is a member of the scientific advisory board of Bellicum Pharmaceutical and Catamaran; G.D. and B.S. are consultants for Tessa Therapeutics; G.D. receives research support from Bluebird Bio and Bellicum Pharmaceutical; G.D. and H.D. filed a patent for the CAR targeting B7-H3, the patent number is US10519214, and the title is “Methods and Compositions for Chimeric Antigen Receptor Targeting Cancer Cells”. No potential conflicts of interest were disclosed by the other authors.

Figures

Fig. 1
Fig. 1. B7-H3.CAR-T cells target B7-H3+ NSCLC cell lines and organoid in vitro.
a Representative micrographs showing B7-H3 expression in cryosections of normal lung and NSCLC assessed by staining with the 376.96 mAb at the final concentration of 1 μg/mL. Scale bars, 200 μm. b B7-H3 expression score summary of the immunochemistry results in normal lung and NSCLC showing in (a), n = 3 for normal lung, n = 5 for adenocarcinoma, n = 30 for squamous cell carcinoma. Data are presented as mean values ± SD. c Representative flow cytometry plots showing B7-H3 expression in NSCLC cell lines, stained with the 376.96 mAb antibody. d, e NSCLC cell lines labeled with GFP were cocultured with CD19.28, B7-H3.28, or B7-H3.BB CAR-T cells at the T cell to tumor cell ratio of 1:5. On day 5, NSCLC cells (GFP+) and CAR-T cells (CD3+) were enumerated by flow cytometry. Representative flow-cytometry plots (d) and quantification of residual tumor cells (e) are illustrated. Data are presented as mean values + SD. f, g Summary of IFNγ (f) and IL2 (g) released by CAR-T cells in the culture supernatant after 24 h of coculture with the indicated cell lines as measured by ELISA, n = 4 independent experiments using CAR-T cells generated from four different donors in (dg). Data are presented as mean values + SD. h Representative flow plots showing B7-H3 expression in lung cancer organoid LU6438B, which was stained with the 376.96 mAb antibody. i, j Organoid LU6438B was cocultured with CD19.28 or B7-H3.28 CAR-T cells at the T cell to organoid cell ratio of 1:2 and 1:5. On day 4, organoid cells (CD45) and CAR-T cells (CD45+) were identified by flow cytometry. Representative flow-cytometry plots (i) and quantification of residual organoid cells (j) are illustrated. Data are presented as mean values. k, l Summary of IFNγ (k) and IL2 (l) released by CAR-T cells in the supernatant after 24 h of coculture with organoids as measured by ELISA. Data are presented as mean values. N = 2 independent experiments using CAR-T cells generated from two different donors. Source data for (b, e, f, g, j, k, l) are provided as a Source Data file.
Fig. 2
Fig. 2. B7-H3.CAR-T cells eradicate B7-H3+ NSCLC in metastatic and orthotopic models.
a Schematic representation of a metastatic NSCLC model in NSG mice using the FFluc-A549 cell line. Representative images of tumor bioluminescence (BLI) (b) and kinetics (c) of tumor growth (n = 5 mice/group). d Kaplan–Meier survival curve of mice in (b) (n = 5 mice/group), **p = 0.0015 (B7-H3.28 vs. CD19.28 CAR-T cells), **p = 0.0015 (B7-H3.BB vs. CD19.28 CAR-T cells) χ2 test. In this model for the survival curve, mice were censored when the luciferase signal reached 3.5 × 109 photons per second. e Schematic representation of an orthotopic NSCLC model in NSG mice using the FFluc-A549 cell line. Representative images of tumor BLI (f) and kinetics (g) of tumor growth (n = 5 mice/group). h Kaplan–Meier survival curve of mice in (e) (n = 5 mice/group), **p = 0.0047 (B7-H3.28 vs. CD19.28 CAR-T cells), **p = 0.0047 (B7-H3.BB vs. CD19.28 CAR-T cells) χ2 test. In this model for the survival curve, mice were censored when the luciferase signal reached 3.5 × 109 photons per second. Days indicated in (b and f) are days post T cell infusion. Source data for (c, d, g, h) are provided as a Source Data file.
Fig. 3
Fig. 3. Coexpression of CCR2b in B7-H3.CAR-T cells improves the migration toward CCL2.
a Mean gene expression distributions of CCL and CXCL family members (41 genes) in lung cancer adenocarcinoma (LUAD) (n = 517) and lung cancer squamous cell carcinoma (LUSC) (n = 501) cohorts from TCGA data set. The solid curve lines indicate the distribution of the quantiles of CCL2 in all 41 chemokines genes at each expression level, and the dotted line indicates the mean expression of CCL2 in LUAD and LUSC. b CCL2 measured in the culture supernatant of NSCLC cell lines (1 × 105/mL cells cultured in 24-well plates for 24 h) (n = 4 independent samples). Data are presented as mean values + SD. c Mean gene expression distributions of CCL and CXCL family members (39 genes) from 37 NSCLC paired with brain metastasis. The solid curve lines indicate the distribution of the quantiles of CCL2 in all the 39 genes at each expression level and the dotted line indicates the mean expression of CCL2 in lung cancer and brain metastasis. CCL2 expression is in the top 15 and 8% quantiles of the 39 CCL and CXCL genes expression in primary lung cancer tissue and brain metastasis, respectively. d Schematic of the vectors encoding B7-H3.CAR and CCR2b. e Representative flow plots showing CCR2 expression in control non-transduced T cells (NT), B7-H3.28, B7-H3.BB, CCR2b.B7-H3.28 and CCR2b.B7-H3.BB CAR-T cells. f Summary of CCR2 expression percentage (top) and MFI (bottom) in NT, B7-H3.28, B7-H3.BB, CCR2b.B7-H3.28 and CCR2b.B7-H3.BB CAR-T cells (n = 4 independent experiments using CAR-T cells generated from four different donors). Data are presented as mean values ± SD. g Cell numbers of NT, B7-H3.28, B7-H3.BB, CCR2b.B7-H3.28 and CCR2b.B7-H3.BB CAR-T cells migrated to the bottom of the transwell chambers with 5 μm pores that were induced by the culture supernatant of NSCLC cell lines and human CCL2 recombinant protein (10 ng/mL), (n = 3 independent experiments using CAR-T cells generated from three different donors). Data are presented as mean values + SD. Source data for (b, f, g) are provided as a Source Data file. Source data for (a, c) are provided as Supplementary Table 1.
Fig. 4
Fig. 4. CCR2b co-expressing B7-H3.CAR-T cells have comparable antitumor activity when coculture with NSCLC cell lines in vitro.
a Representative flow plots of CARs expression in CD19.28, B7-H3.28, B7-H3.BB, CCR2b.B7-H3.28 and CCR2b.B7-H3.BB CAR-T cells as assessed by flow cytometry. b, c Summary of the percentage (b) and MFI (c) of CAR expression in B7-H3.28, B7-H3.BB, CCR2b.B7-H3.28 and CCR2b.B7-H3.BB CAR-T cells (n = 10 independent experiments using CAR-T cells generated from ten different donors, *p = 0.0219 for CD19.28 vs. B7-H3.28, *p = 0.0240 for CD19.28 vs. B7-H3.BB, *p = 0.0295 for B7-H3.BB vs. CCR2b.B7-H3.28, *p = 0.0217 for B7-H3.BB vs. CCR2b.B7-H3.BB, one-way ANOVA). Data are presented as mean values ± SD. d, e GFP-labeled NSCLC cell lines were cocultured with CD19.28, B7-H3.28, B7-H3.BB, CCR2b.B7-H3.28 or CCR2b.B7-H3.BB CAR-T cells at the CAR-T cell to tumor cell ratio of 1:5. On day 5, NSCLC cells (GFP+) and CAR-T cells (CD3+) were enumerated by flow cytometry. Representative flow-cytometry plots (d) and quantification of residual tumor cells (e) are illustrated. Data are presented as mean values + SD. f, g Summary of IFNγ (f) and IL2 (g) released by CAR-T cells in the culture supernatant after 24 h of coculture with the indicated cell lines as measured by ELISA, n = 4 independent experiments using CAR-T cells generated from four different donors in (dg). Data are presented as mean values + SD. Source data for (b, c, e, f, g) are provided as a Source Data file.
Fig. 5
Fig. 5. B7-H3.CAR-T cells co-expressing CCR2b have superior antitumor activity against the A549 tumor in the brain.
a Schematic of the A549 brain tumor model in which NSG mice were implanted intracranially (i.c.) with FFluc-A549 cells (5 × 104 cells) into the right brain hemisphere, and then treated with CD19.28, B7-H3.28, or CCR2b.B7-H3.28 CAR-T cells (10 × 106) inoculated i.v. 18 days later. b, c Representative tumor BLI images (b) and BLI kinetics (c) in the model shown in (a). Days indicated in (b) represent the days post T cell infusion. d Kaplan–Meier survival curves of mice in (b). ***p = 0.0008 (CCR2b.B7-H3.28 vs. B7-H3.28), χ2 test. N = 4 mice in CD19.28 group, and n = 9 mice in B7-H3.28 and CCR2b.B7-H3.28 in (c, d). e In the separate experiment, mice were euthanized 8 days after CAR-T cell infusion, and human CD45+CD3+ T cells were enumerated in blood, spleen, and the right brain hemisphere by flow cytometry. Bar graph summary are shown, data are presented as mean values + SD (n = 6 mice in B7-H3.28, n = 7 mice in CCR2b.B7-H3.28), *p = 0.0464, unpaired t test with Welch’s correction and two-tailed p value calculation. f In another experiment, the same procedure as the experiment in (e), when the mice were euthanized 8 days after CAR-T cell infusion, human CD45+CD3+ T cells in both the left brain hemisphere (without tumor) and right brain hemisphere (with tumor) were enumerated by flow cytometry, besides blood and spleen. Bar graph summary are shown, data are presented as mean values + SD (n = 5 mice/group), **p = 0.0062, ****p < 0.0001, two-way ANOVA with Sidak’s multiple comparisons test. Source data for (c, d, e, f) are provided as a Source Data file.
Fig. 6
Fig. 6. CCR2b co-expressing B7-H3.CAR-T cells show superior antitumor activity in the H520 lung orthotopic and brain co-xenograft tumor model.
a Schematic of the H520 lung orthotopic and brain co-xenograft tumor model in NSG mice. Briefly, the FFluc-H520 (4 × 104) cells were implanted into the right hemisphere of the brain of NSG mice by i.c. injection. Five days later, 4 × 105 FFluc-H520 cells were implanted into the left lung by intrathoracic injection. Seven days later, mice were treated with CD19.28, B7-H3.28, or CCR2b.B7-H3.28 CAR-T cells (10 × 106 cells/mouse) by i.v. injection. b Representative tumor BLI images. Days represent the days post T-cell infusion. c The BLI kinetics of the FFluc-H520 tumor growth in the model shown in (b), BLI signals from the brain (top) and whole body (bottom) are illustrated, respectively (n = 5 mice/group). d Kaplan–Meier survival curves of mice in (b), n = 5 mice/group, *p = 0.0486 for B7-H3.28 vs. CCR2b.B7-H3.28, *p = 0.0181 for CD19.28 vs. B7-H3.28, **p = 0.0026 for CD19.28 vs. CCR2b.B7-H3.28, χ2 test. Source data for (c, d) are provided as a Source Data file.

References

    1. Ramalingam SS, Owonikoko TK, Khuri FR. Lung cancer: new biological insights and recent therapeutic advances. CA Cancer J. Clin. 2011;61:91–112. doi: 10.3322/caac.20102. - DOI - PubMed
    1. Yang CJ, et al. Long-term outcomes of surgical resection for stage IV non-small-cell lung cancer: A national analysis. Lung Cancer. 2018;115:75–83. doi: 10.1016/j.lungcan.2017.11.021. - DOI - PubMed
    1. Hirsch FR, et al. Lung cancer: current therapies and new targeted treatments. Lancet. 2017;389:299–311. doi: 10.1016/S0140-6736(16)30958-8. - DOI - PubMed
    1. Barnholtz-Sloan JS, et al. Incidence proportions of brain metastases in patients diagnosed (1973 to 2001) in the Metropolitan Detroit Cancer Surveillance System. J. Clin. Oncol. 2004;22:2865–2872. doi: 10.1200/JCO.2004.12.149. - DOI - PubMed
    1. Gavrilovic IT, Posner JB. Brain metastases: epidemiology and pathophysiology. J. Neurooncol. 2005;75:5–14. doi: 10.1007/s11060-004-8093-6. - DOI - PubMed

Publication types