. 2022 Oct;7(5):415-450.
doi: 10.1136/svn-2021-001374. Epub 2022 Apr 20.

China Stroke Statistics: an update on the 2019 report from the National Center for Healthcare Quality Management in Neurological Diseases, China National Clinical Research Center for Neurological Diseases, the Chinese Stroke Association, National Center for Chronic and Non-communicable Disease Control and Prevention, Chinese Center for Disease Control and Prevention and Institute for Global Neuroscience and Stroke Collaborations

Affiliations

China Stroke Statistics: an update on the 2019 report from the National Center for Healthcare Quality Management in Neurological Diseases, China National Clinical Research Center for Neurological Diseases, the Chinese Stroke Association, National Center for Chronic and Non-communicable Disease Control and Prevention, Chinese Center for Disease Control and Prevention and Institute for Global Neuroscience and Stroke Collaborations

Yong-Jun Wang et al. Stroke Vasc Neurol. 2022 Oct.

Abstract

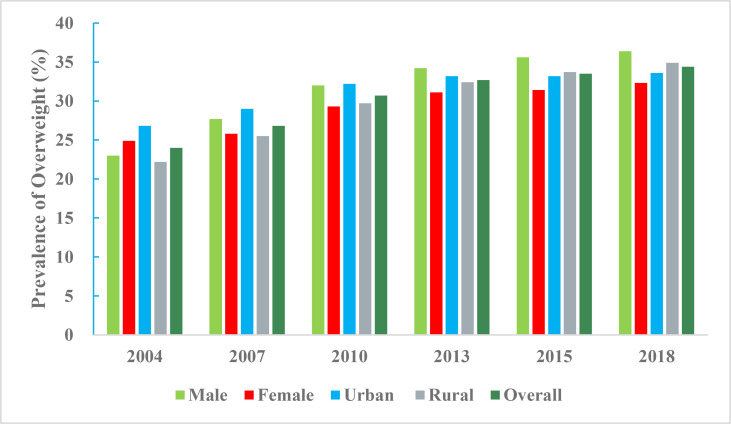
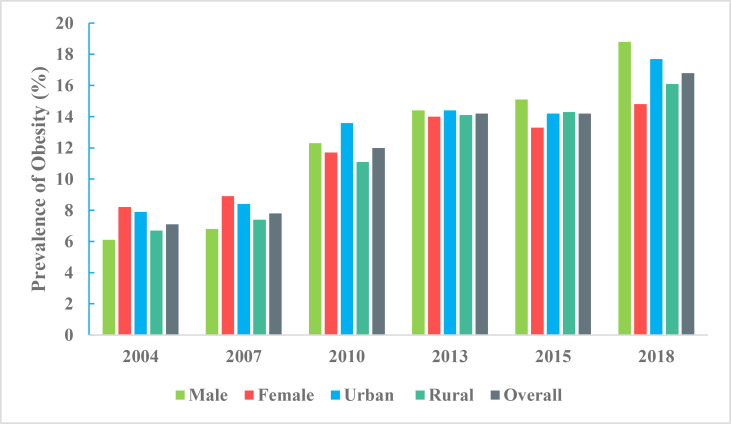
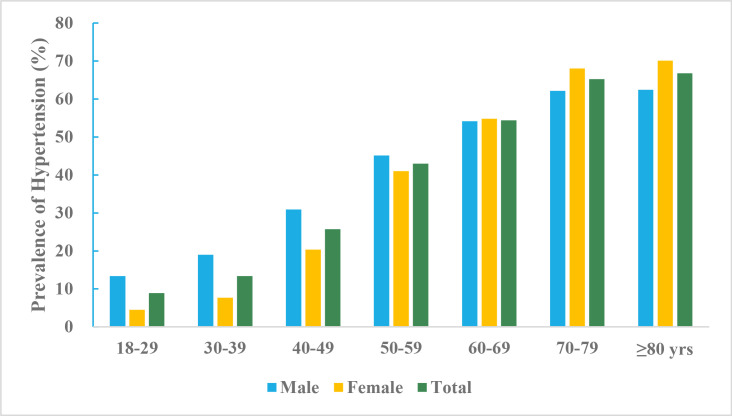
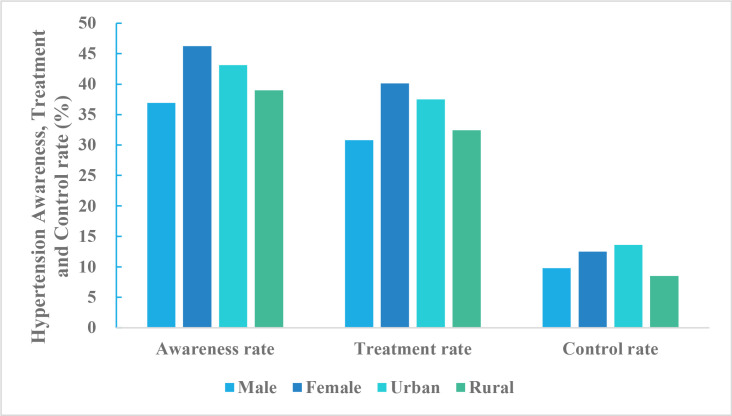
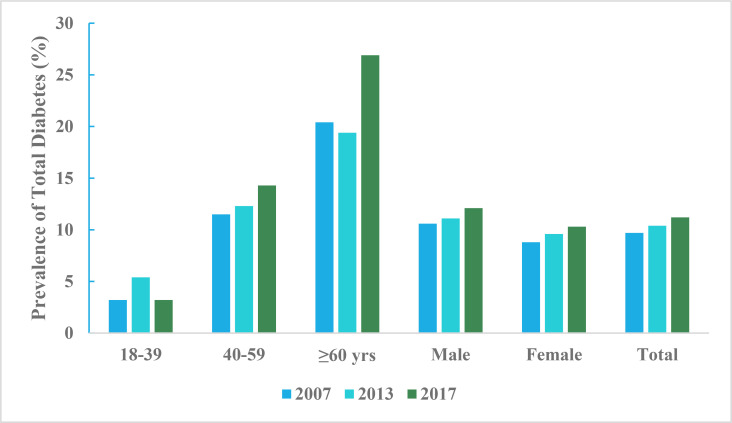
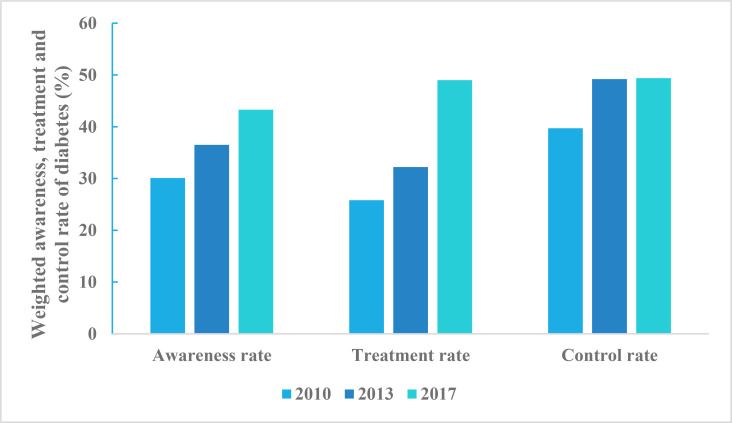
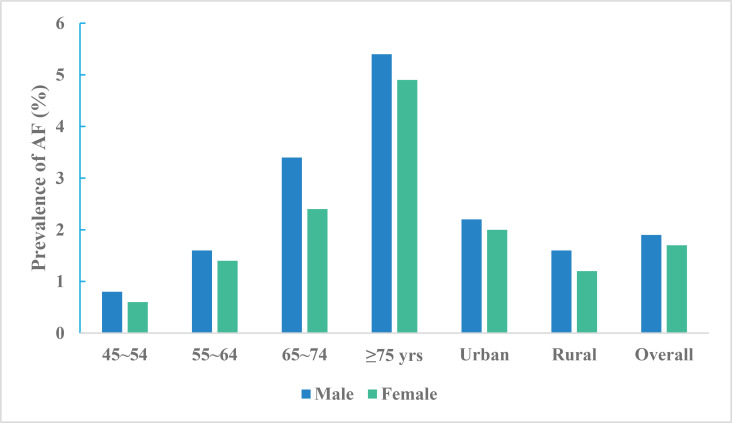
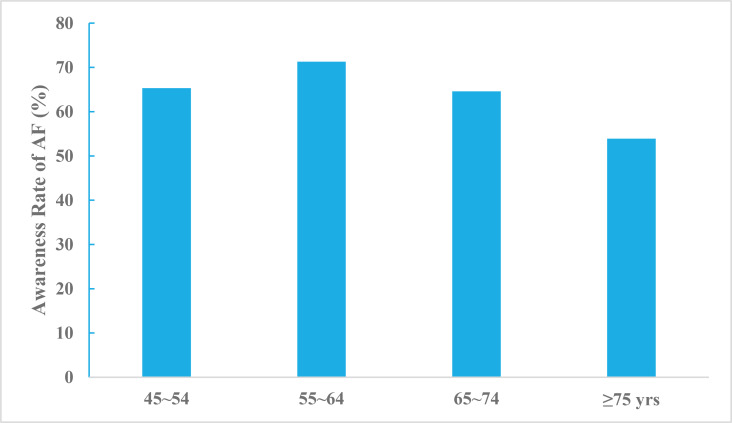
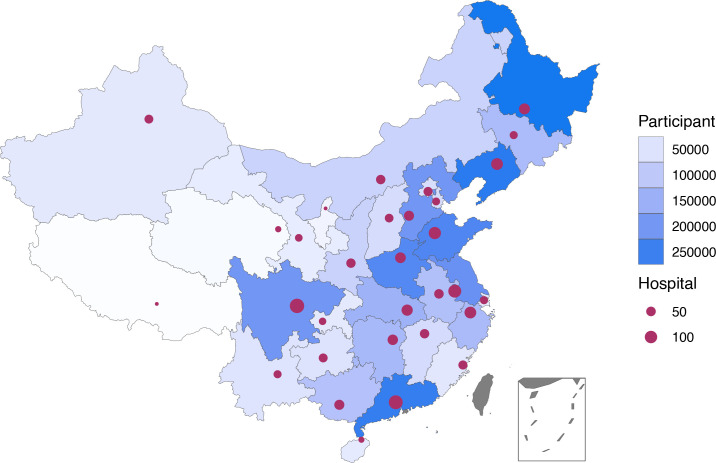
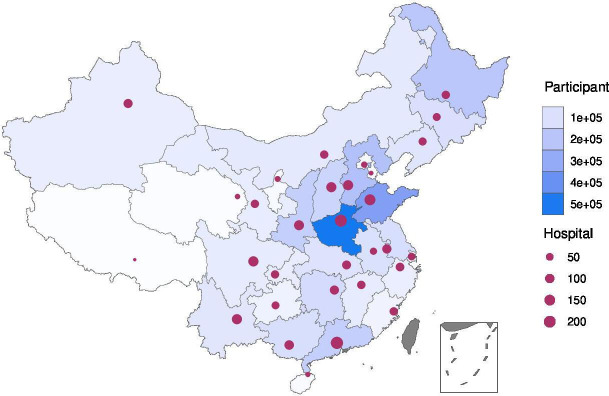
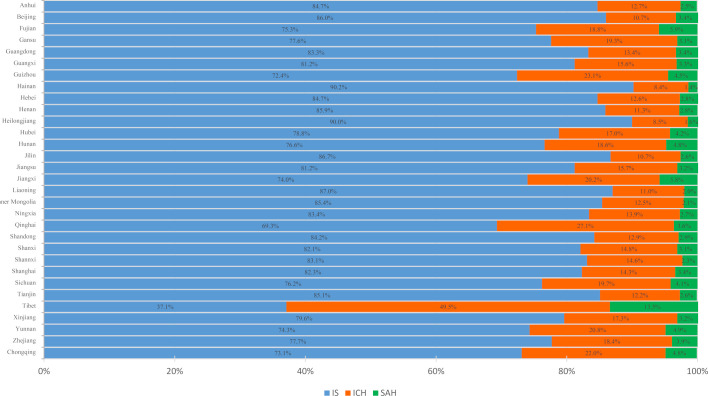
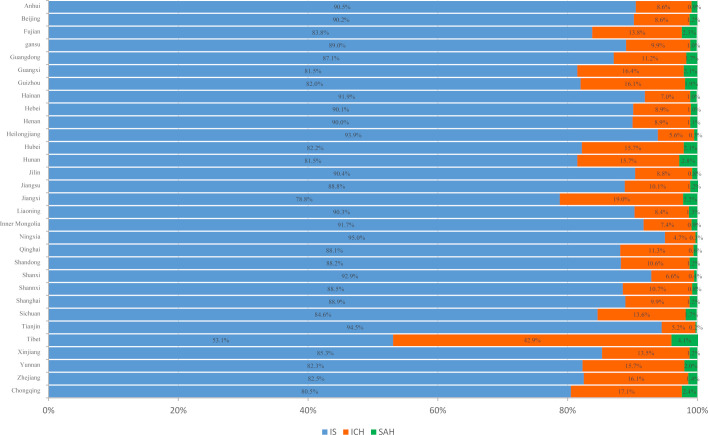
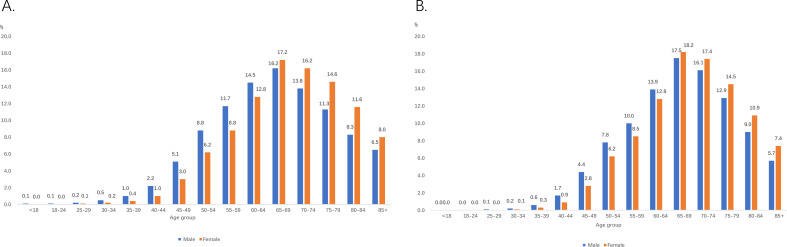
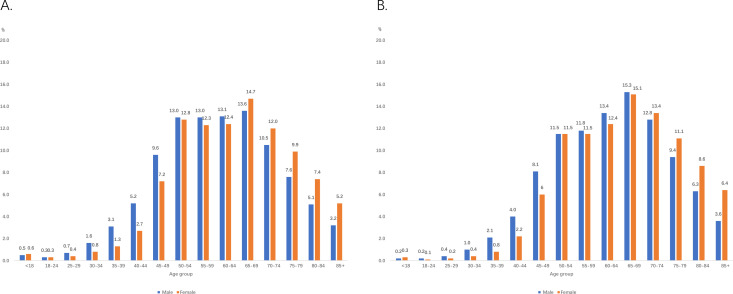
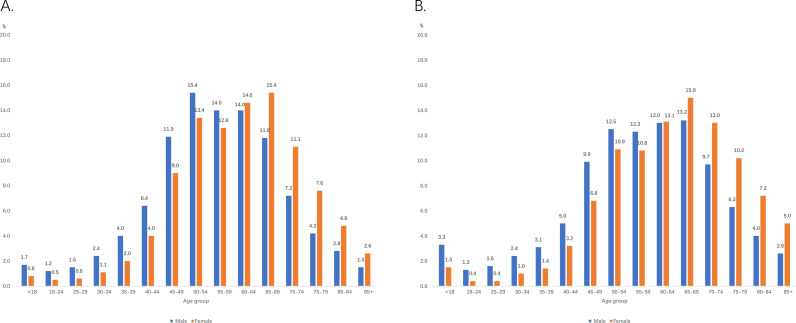
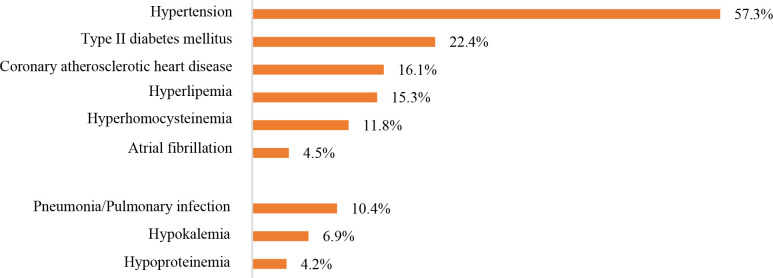
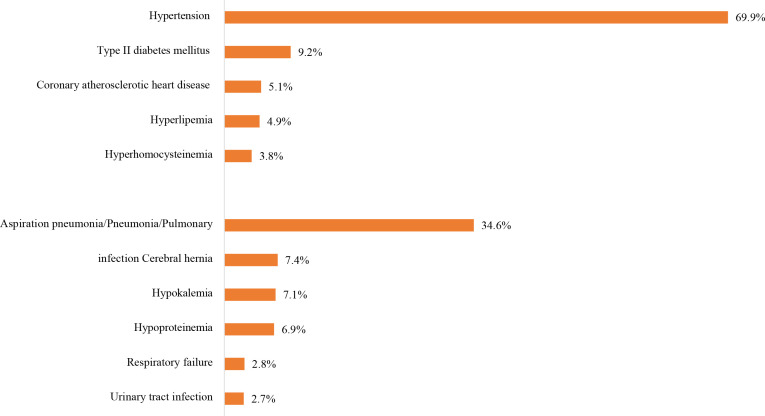
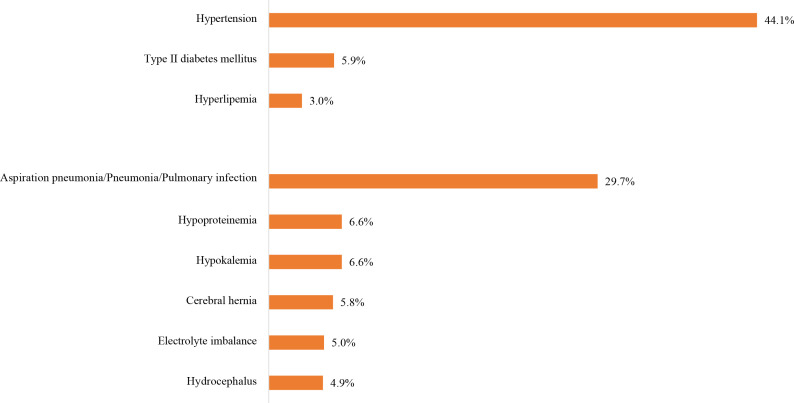
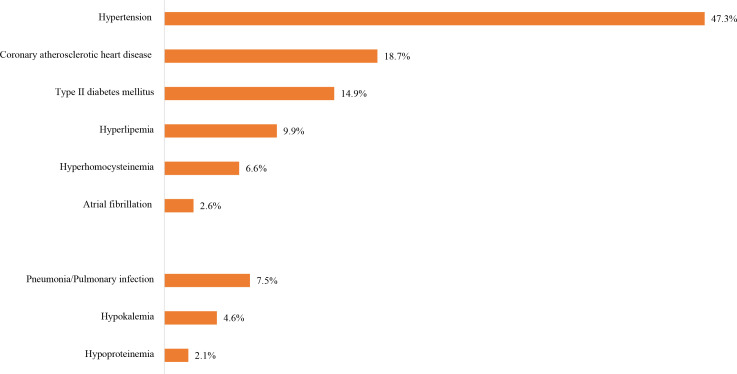
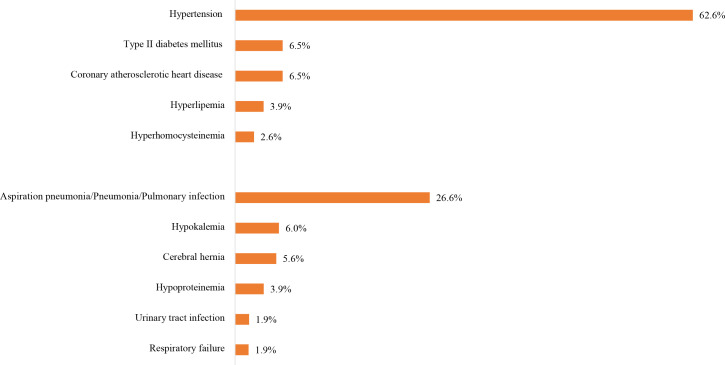
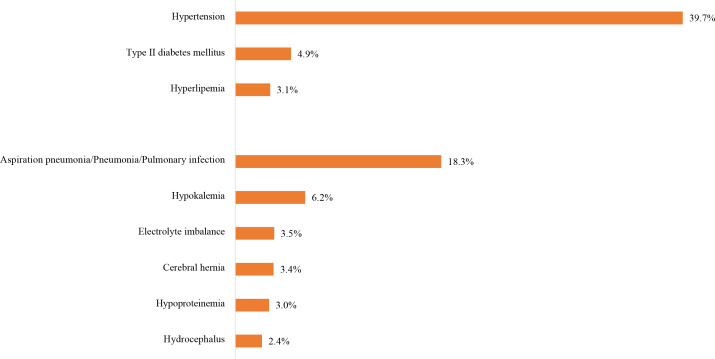
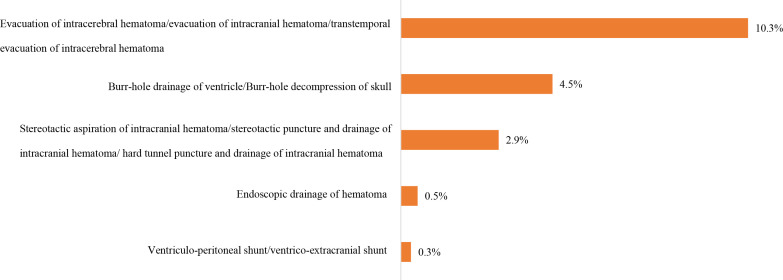
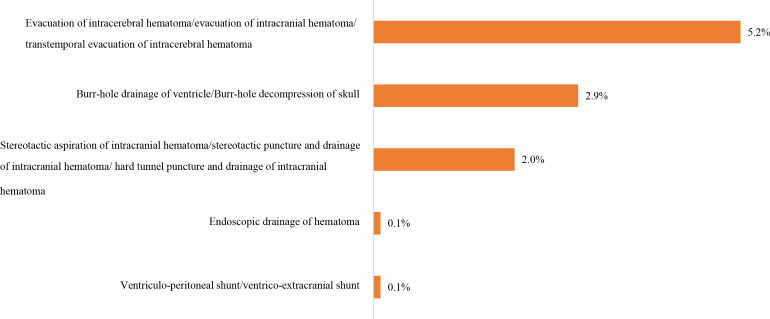
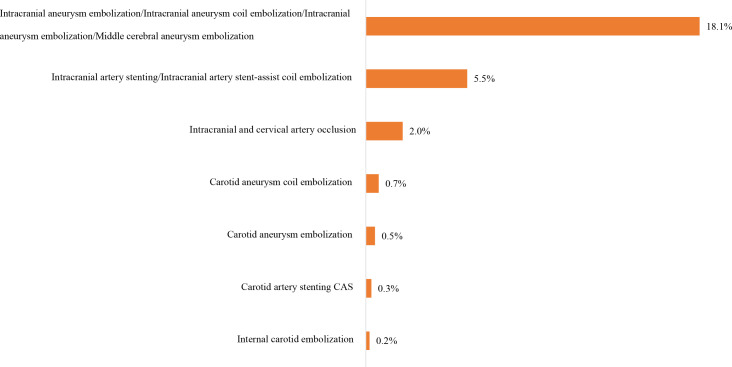
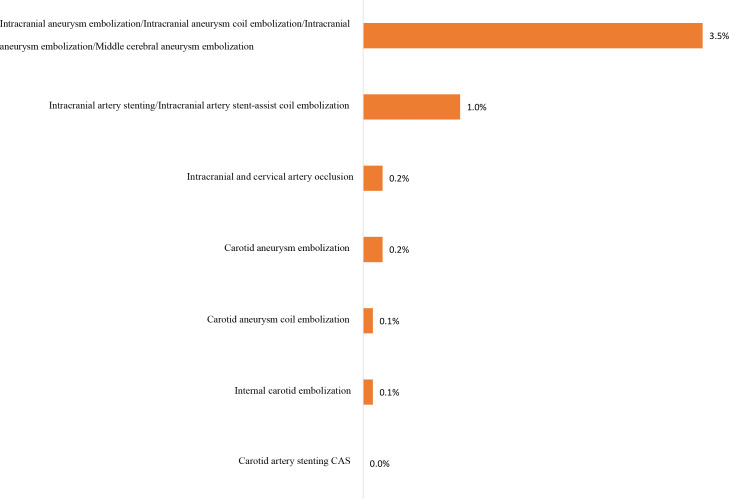
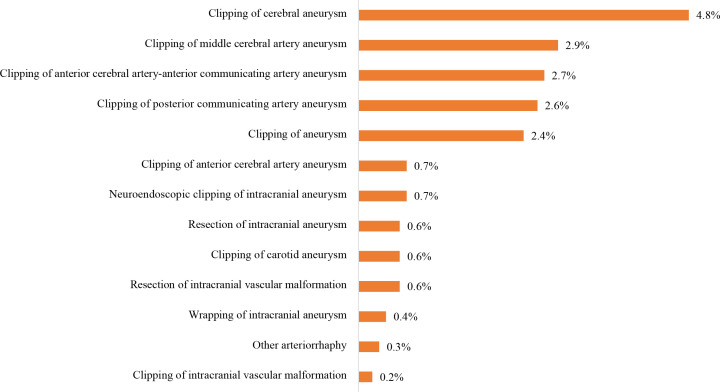
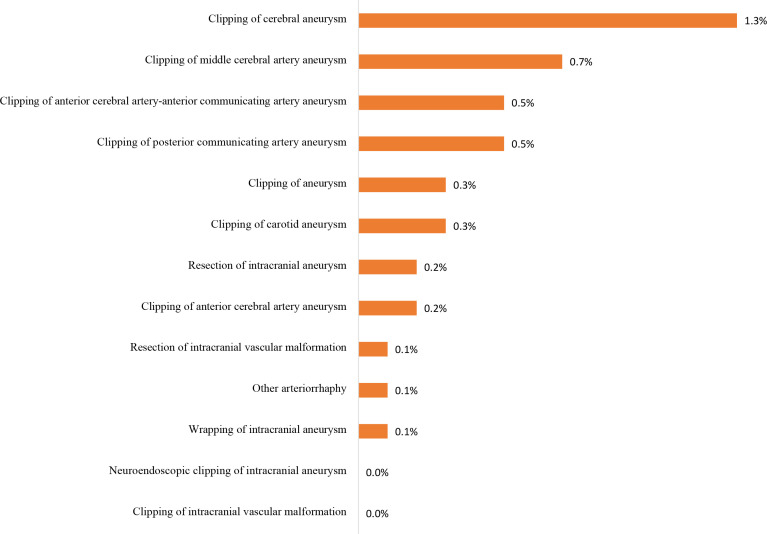
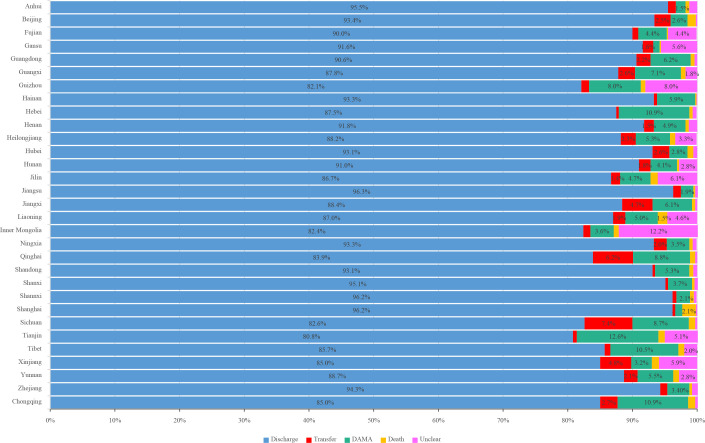
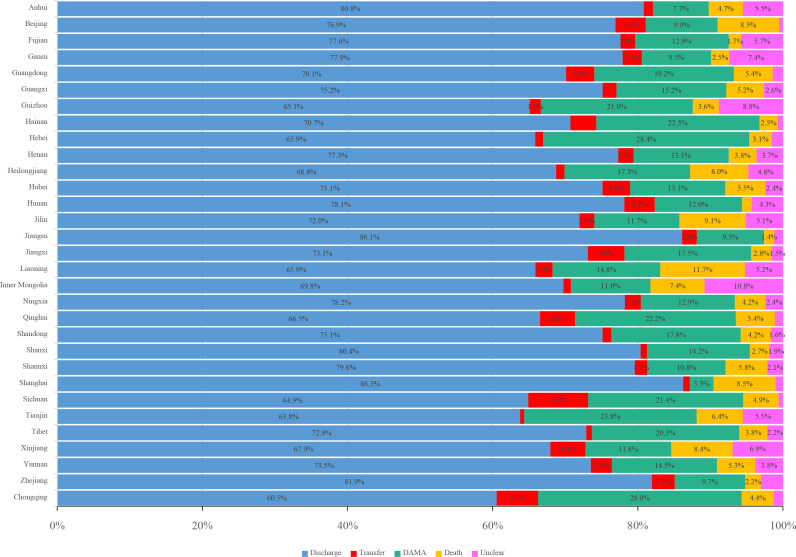
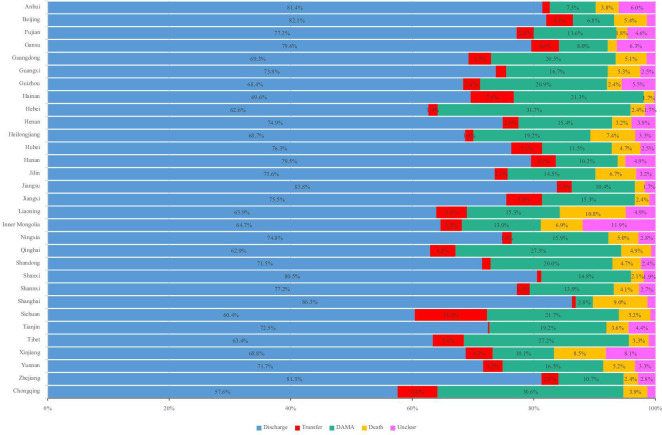
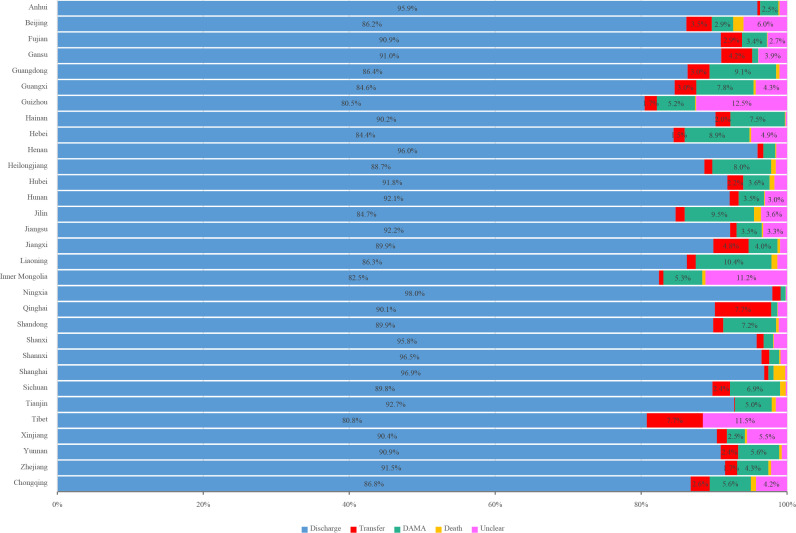
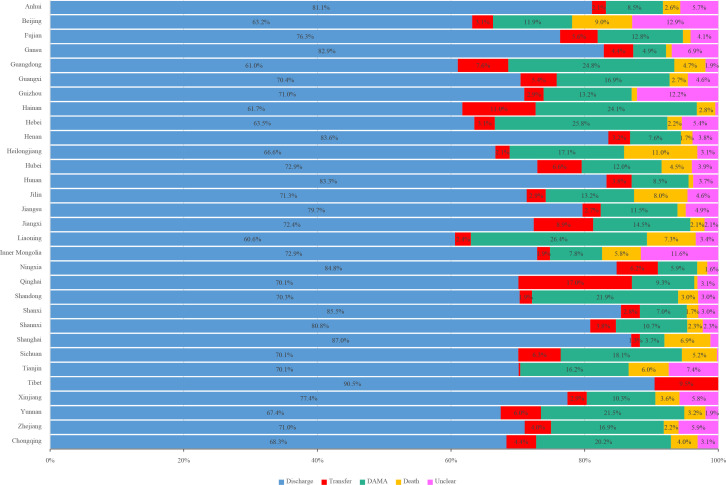
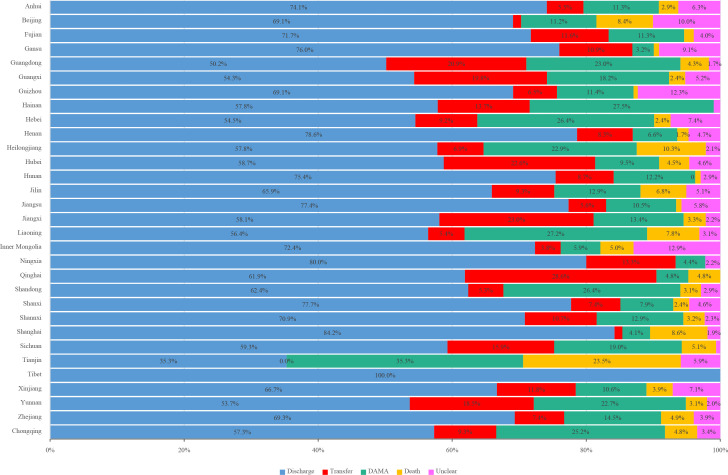
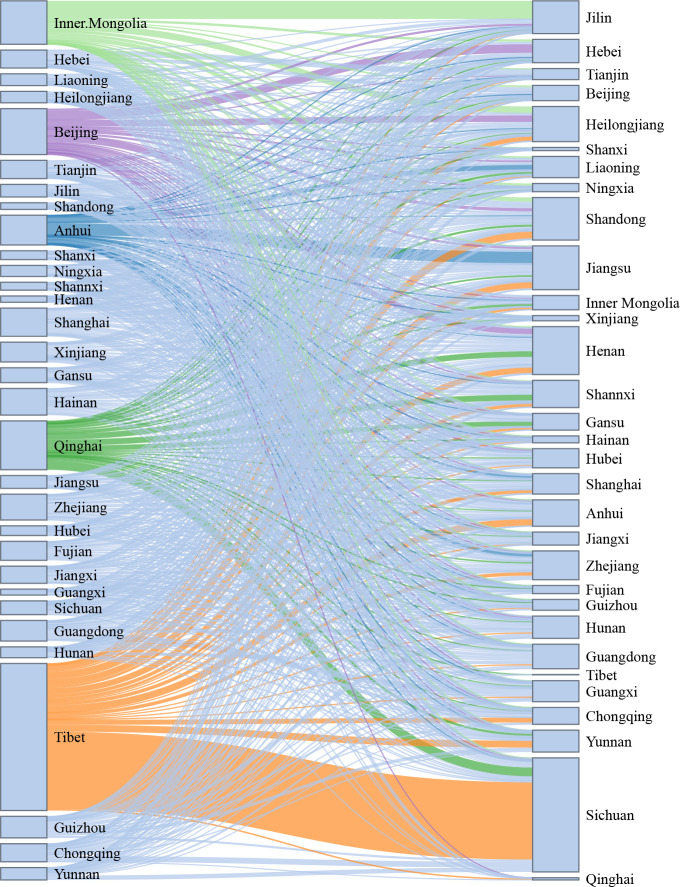
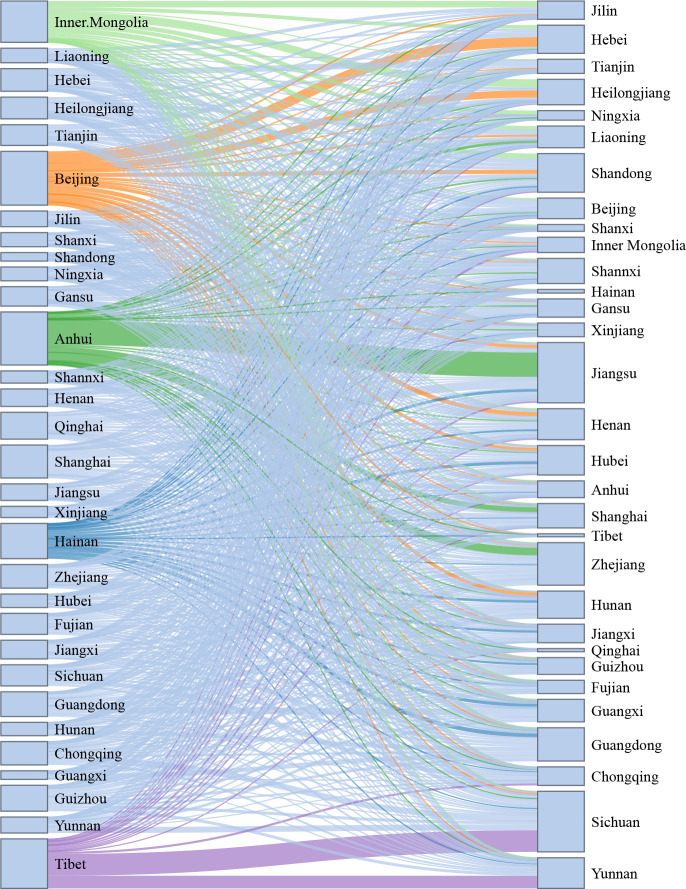
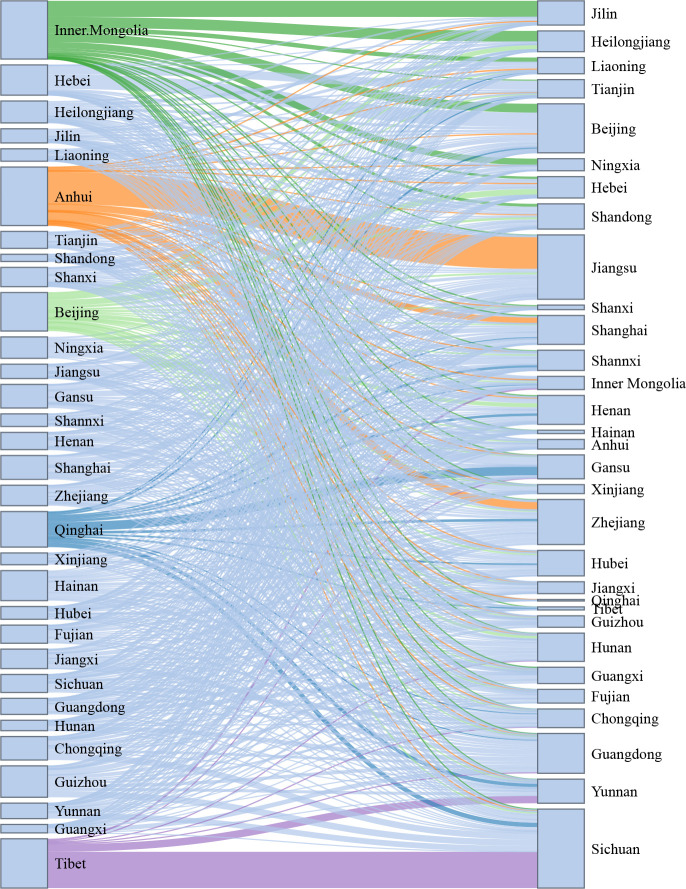
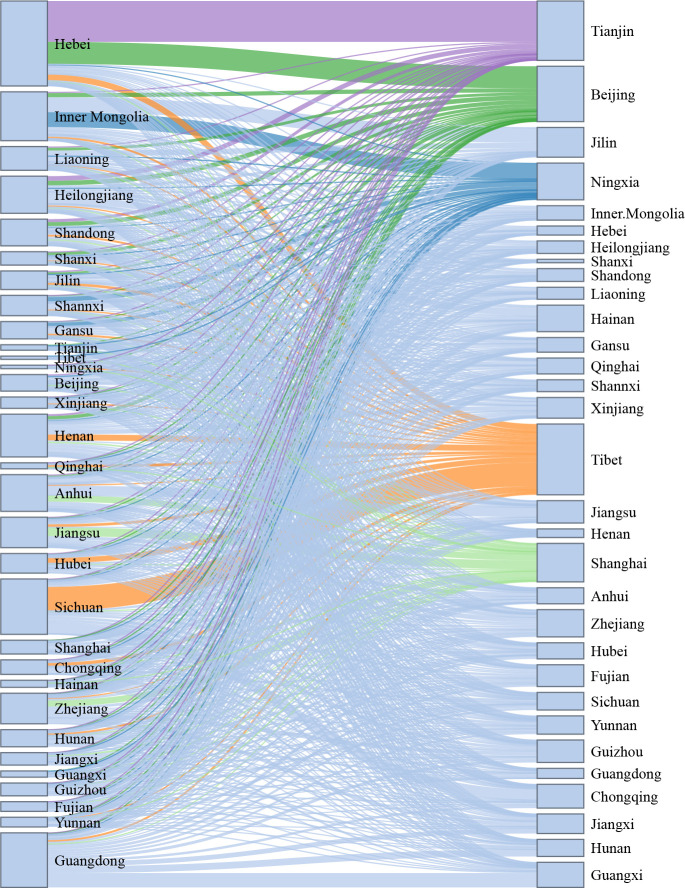
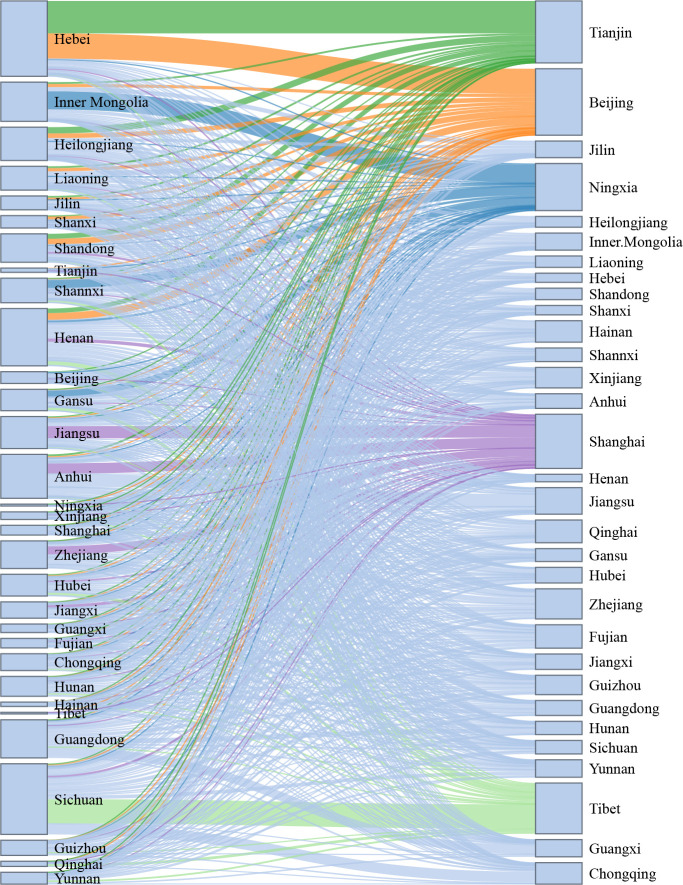
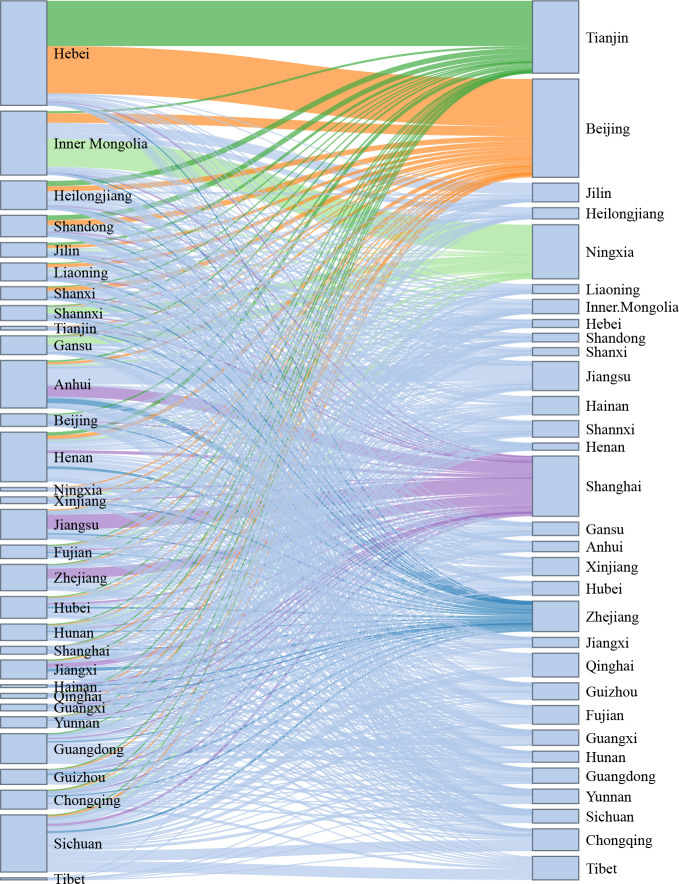
China faces the greatest challenge from stroke in the world. According to results from the Global Burden of Disease Study 2019, there were 3.94 million new stroke cases, 28.76 million prevalent cases and 2.19 million deaths due to stroke in China in 2019. Furthermore, stroke is also the leading cause of disability-adjusted life-year (DALY) in China, the number of DALYs reached 45.9 million in 2019. Several recent large-scale epidemiological surveys have updated the data on pre-existing conditions contributed to stroke. The age-adjusted prevalence of overweight among Chinese adults aged 18-69 years was 34.4%, and the prevalence of obesity was 16.8% in 2018. 50.9% of Chinese adults ≥18 years of age without history of hypertension had prehypertension in 2018. The weighted prevalence of hypertension in adults was 27.5% in 2018. The weighted prevalence of total diabetes and pre-diabetes diagnosed by the American Diabetes Association criteria were 12.8% and 35.2%, respectively, among Chinese adults ≥18 years of age in 2017. The weighted atrial fibrillation prevalence was 1.8% among Chinese adults ≥45 years of age and equates to being present in an estimated 7.9 million people in China. Data from 1672 tertiary public hospitals in the Hospital Quality Monitoring System (HQMS) showed that 3 411 168 stroke cases were admitted during 2019. Of those, 2 818 875 (82.6%) were ischaemic strokes (ISs), 485 474 (14.2%) were intracerebral haemorrhages (ICHs), 106 819 (3.1%) were subarachnoid haemorrhages (SAHs). The average age was 66 years old, and 59.6% were male. A total of 1379 (<0.1%), 2604 (0.5%), 1250 (1.2%) paediatric strokes (age <18 years) were identified among IS, ICH and SAH, respectively. Over one-third (1 231 519 (36.1%)) of the stroke cases were covered by urban resident basic medical insurance, followed by urban employee basic medical insurance (891 103 (26.1%)) and new rural cooperative medical schema (543 108 (15.9%)). The leading risk factor was hypertension (57.3% for IS, 69.9% for ICH and 44.1% for SAH), and the leading comorbidity was pneumonia or pulmonary infection (10.4% for IS, 34.6% for ICH and 29.7% for SAH). In-hospital death/discharge against medical advice rate was 8.5%, ranging from 6.0% for IS to 20.6% for SAH. The median and IQR of length of stay was 9.0 (6.0-13.0) days, ranging from 10.0 (7.0-13.0) in IS to 14.0 (8.0-22.0) in ICH. Similar data from 2847 secondary public hospitals or private hospitals in the HQMS were also reported. Data from HQMS showed that higher proportions of interprovincial admission to other provinces were seen in Inner Mongolia, Anhui, Tibet and Beijing. Higher proportions of interprovincial admission from other provinces were seen in Beijng, Tianjin, Shanghai and Ningxia. Data from 323 601 strokes from 1337 hospitals in the Chinese Stroke Center Alliance during 2019 demonstrated that the composite scores of guideline-recommended key performance indicators for patients with IS, ICH and SAH were 0.78±0.20, 0.69±0.27 and 0.60±0.31, respectively.

Keywords: stroke.


Conflict of interest statement

Competing interests: None declared.

Figures

Figure 1
Figure 1
Prevalence of overweight among Chinese adults aged 18–69 years by sex and regions, China Chronic Disease and Risk Factors Surveillance programme, from 2004 to 2018 (Chinese BMI cut-offs). BMI, body mass index.
Figure 2
Figure 2
Prevalence of obesity among Chinese adults aged 18–69 years by sex and regions, China Chronic Disease and Risk Factors Surveillance programme, from 2004 to 2018 (Chinese BMI cut-offs). BMI, body mass index.
Figure 3
Figure 3
Prevalence of hypertension among Chinese adults ≥18 years of age by sex and age groups, China Chronic Disease and Risk Factors Surveillance programme, 2018.
Figure 4
Figure 4
Hypertension awareness, treatment and control rate for Chinese adults ≥18 years of age by sex and region, China Chronic Disease and Risk Factors Surveillance programme, 2018.
Figure 5
Figure 5
Prevalence of total diabetes diagnosed by the WHO criteria among Chinese adults≥18 years of age by sex and age group from 2007 to 2017.
Figure 6
Figure 6
Weighted awareness rate, treatment rate and control rate of diabetes among Chinese adults ≥18 years of age from 2010 to 2017.
Figure 7
Figure 7
Prevalence of atrial fibrillation among adults aged ≥45 years by sex, age and region, China Atrial Fibrillation Epidemiologic Study 2014–2016.
Figure 8
Figure 8
Awareness rate of atrial fibrillation among adults aged ≥45 years by age, China Atrial Fibrillation Epidemiologic Study 2014–2016.
Figure 9
Figure 9
Distribution of tertiary public hospitals and admitted stroke cases from the Hospital Quality Monitoring System in 2019.
Figure 10
Figure 10
Distribution of secondary public hospitals/private hospitals and admitted stroke cases from Hospital Quality Monitoring System in 2019.
Figure 11
Figure 11
Proportion of stroke type for stroke admitted to tertiary public hospitals in the Hospital Quality Monitoring System in 2019 stratified by province.
Figure 12
Figure 12
Proportion of stroke type for stroke admitted to secondary public hospitals/private hospitals in the Hospital Quality Monitoring System in 2019 stratified by province.
Figure 13
Figure 13
Age distribution for ischaemic stroke admitted to hospitals in the Hospital Quality Monitoring System in 2019. A. Tertiary public hospitals; B. Secondary public hospitals/private hospitals.
Figure 14
Figure 14
Age distribution for intracerebral haemorrhage stroke admitted to hospitals in the Hospital Quality Monitoring System in 2019. A. Tertiary public hospitals; B. Secondary public hospitals/private hospitals.
Figure 15
Figure 15
Age distribution for subarachnoid haemorrhage stroke admitted to hospitals in the Hospital Quality Monitoring System in 2019. A. Tertiary public hospitals; B. Secondary public hospitals/private hospitals.
Figure 16
Figure 16
Risk factors or comorbidities for ischaemic stroke admitted to tertiary public hospitals in the Hospital Quality Monitoring System in 2019.
Figure 17
Figure 17
Risk factors or comorbidities for intracerebral haemorrhage stroke admitted to tertiary public hospitals in the Hospital Quality Monitoring System in 2019.
Figure 18
Figure 18
Risk factors or comorbidities for subarachnoid haemorrhage stroke admitted to tertiary public hospitals in the Hospital Quality Monitoring System in 2019.
Figure 19
Figure 19
Risk factors or comorbidities for ischaemic stroke admitted to secondary public hospitals/private hospitals in the Hospital Quality Monitoring System in 2019.
Figure 20
Figure 20
Risk factors or comorbidities for intracerebral haemorrhage stroke admitted to secondary public hospitals/private hospitals in the Hospital Quality Monitoring System in 2019.
Figure 21
Figure 21
Risk factors or comorbidities for subarachnoid haemorrhage stroke admitted to secondary public hospitals/private hospitals in the Hospital Quality Monitoring System in 2019.
Figure 22
Figure 22
Distribution of hospitals and participants from Chinese Stroke Center Alliance in 2019.
Figure 23
Figure 23
Procedures for ischaemic stroke admitted to tertiary public hospitals in the Hospital Quality Monitoring System in 2019.
Figure 24
Figure 24
Procedures for ischaemic stroke admitted to secondary public hospitals/private hospitals in the Hospital Quality Monitoring System in 2019.
Figure 25
Figure 25
Procedures for intracerebral haemorrhage stroke admitted to tertiary public hospitals in the Hospital Quality Monitoring System in 2019.
Figure 26
Figure 26
Procedures for intracerebral haemorrhage stroke admitted to secondary public hospitals/private hospitals in the Hospital Quality Monitoring System in 2019.
Figure 27
Figure 27
Interventions for subarachnoid haemorrhage stroke admitted to tertiary public hospitals in the Hospital Quality Monitoring System in 2019.
Figure 28
Figure 28
Interventions for subarachnoid haemorrhage stroke admitted to secondary public hospitals/private hospitals in the Hospital Quality Monitoring System in 2019.
Figure 29
Figure 29
Procedures for subarachnoid haemorrhage stroke admitted to tertiary public hospitals in the Hospital Quality Monitoring System in 2019.
Figure 30
Figure 30
Procedures for subarachnoid haemorrhage stroke admitted to secondary public hospitals/private hospitals in the Hospital Quality Monitoring System in 2019.
Figure 31
Figure 31
In-hospital outcomes of ischaemic stroke admitted to tertiary public hospitals in the Hospital Quality Monitoring System in 2019 by province, autonomous region, or municipality. DAMA, discharge against medical advice.
Figure 32
Figure 32
In-hospital outcomes of intracerebral haemorrhage stroke admitted to tertiary public hospitals in the Hospital Quality Monitoring System in 2019 by province, autonomous region or municipality. DAMA, discharge against medical advice.
Figure 33
Figure 33
In-hospital outcomes of subarachnoid haemorrhage stroke admitted to tertiary public hospitals in the Hospital Quality Monitoring System in 2019 by province, autonomous region or municipality. DAMA, discharge without medical advice.
Figure 34
Figure 34
In-hospital outcomes of ischaemic stroke admitted to secondary public hospitals/private hospitals in the Hospital Quality Monitoring System in 2019 by province, autonomous region or municipality. DAMA, discharge against medical advice.
Figure 35
Figure 35
In-hospital outcomes of intracerebral haemorrhage stroke admitted to secondary public hospitals/private hospitals in the Hospital Quality Monitoring System in 2019 by province, autonomous region, or municipality. DAMA, discharge against medical advice.
Figure 36
Figure 36
In-hospital outcomes of subarachnoid haemorrhage stroke admitted to secondary public hospitals/private hospitals in the Hospital Quality Monitoring System in 2019 by province, autonomous region or municipality. DAMA, discharge without medical advice.
Figure 37
Figure 37
Interprovincial admission to other provinces for ischaemic stroke in the Hospital Quality Monitoring System in 2019.
Figure 38
Figure 38
Interprovincial admission to other provinces for intracerebral haemorrhage stroke in the Hospital Quality Monitoring System in 2019.
Figure 39
Figure 39
Interprovincial admission to other provinces for subarachnoid haemorrhage stroke in the Hospital Quality Monitoring System in 2019.
Figure 40
Figure 40
Interprovincial admission from other provinces for ischaemic stroke in the Hospital Quality Monitoring System in 2019.
Figure 41
Figure 41
Interprovincial admission from other provinces for intracerebral haemorrhage stroke in the Hospital Quality Monitoring System in 2019.
Figure 42
Figure 42
Interprovincial admission from other provinces for subarachnoid haemorrhage stroke in the Hospital Quality Monitoring System in 2019.

References

    1. Zhou M, Xue M. Annual data set on national mortality surveillance 2019. Beijing: China Science and Technology Press, 2020.
    1. Ma Q, Li R, Wang L, et al. . Temporal trend and attributable risk factors of stroke burden in China, 1990-2019: an analysis for the global burden of disease study 2019. Lancet Public Health 2021;6:e897–906. 10.1016/S2468-2667(21)00228-0 - DOI - PMC - PubMed
    1. Wang Y, Cui L, Ji X, et al. . The China national stroke Registry for patients with acute cerebrovascular events: design, rationale, and baseline patient characteristics. Int J Stroke 2011;6:355–61. 10.1111/j.1747-4949.2011.00584.x - DOI - PubMed
    1. Li Z, Wang C, Zhao X, et al. . Substantial progress yet significant opportunity for improvement in stroke care in China. Stroke 2016;47:2843–9. 10.1161/STROKEAHA.116.014143 - DOI - PubMed
    1. Wang Y, Jing J, Meng X, et al. . The third China national stroke registry (CNSR-III) for patients with acute ischaemic stroke or transient ischaemic attack: design, rationale and baseline patient characteristics. Stroke Vasc Neurol 2019;4:158–64. 10.1136/svn-2019-000242 - DOI - PMC - PubMed

Publication types

MeSH terms