. 2022 Apr;604(7907):689-696.
doi: 10.1038/s41586-022-04602-7. Epub 2022 Apr 20.

Somatic mosaicism reveals clonal distributions of neocortical development

Collaborators, Affiliations

Somatic mosaicism reveals clonal distributions of neocortical development

Martin W Breuss et al. Nature. 2022 Apr.

Abstract

The structure of the human neocortex underlies species-specific traits and reflects intricate developmental programs. Here we sought to reconstruct processes that occur during early development by sampling adult human tissues. We analysed neocortical clones in a post-mortem human brain through a comprehensive assessment of brain somatic mosaicism, acting as neutral lineage recorders1,2. We combined the sampling of 25 distinct anatomic locations with deep whole-genome sequencing in a neurotypical deceased individual and confirmed results with 5 samples collected from each of three additional donors. We identified 259 bona fide mosaic variants from the index case, then deconvolved distinct geographical, cell-type and clade organizations across the brain and other organs. We found that clones derived after the accumulation of 90-200 progenitors in the cerebral cortex tended to respect the midline axis, well before the anterior-posterior or ventral-dorsal axes, representing a secondary hierarchy following the overall patterning of forebrain and hindbrain domains. Clones across neocortically derived cells were consistent with a dual origin from both dorsal and ventral cellular populations, similar to rodents, whereas the microglia lineage appeared distinct from other resident brain cells. Our data provide a comprehensive analysis of brain somatic mosaicism across the neocortex and demonstrate cellular origins and progenitor distribution patterns within the human brain.


Figures

Extended Data Figure 1.
Extended Data Figure 1.. Distribution and Features of Somatic Variants for ID01.
a, Circos plot of the genomic positions (hg19) of all detected and quantified positive variants. Different colors were used to distinguish AFs from different organs, the highest AF from all sequenced bulk brain regions is shown for each variant in the Brain track. The higher AF of both kidneys is plotted for the kidney track if present in left and right. Bar height: square root transformed AF from 0.0 to 0.5. Chromosomes are indicated by a number or with ‘X’. Overall, no clustering of the 259 variants was observed across the genome. b, Fraction of variants located in different genomic regions for the six categories based on tissue distribution. Categories of genomic regions are described in Methods. 95% permutation intervals were calculated from 10,000 random permutations of the same number of variants as for each mutation category from gnomAD (v2.1.1). If the detected variant category was outside of the permutation band, the band was labeled pink. Enrichment across features was as expected by random shuffling; the most distinct pattern of enrichment was observed for variants shared across the brain and the organs. c, Relative contribution of the six possible base substitutions for variants showing overall C>T predominance. Across the distribution categories, putatively early somatic mutations found across the brain and the organs were most distinct from the other categories, mainly due to an additional relative increase of C>T mutations (numbers for categories are provided in Fig. 1c).
Extended Data Figure 2.
Extended Data Figure 2.. The distribution of variants in three additional individuals suggests stochasticity.
a, Neocortical biopsies of a validation cohort ID02, ID03, and ID04 were taken with an 8mm punch (Sml: red circle) from prefrontal and temporal areas from each neocortical hemisphere (L-PF, L-T, R-PF, and R-T). In addition, one cerebellar biopsy (red circle) was taken (15 biopsies total from 3 individuals). The workflow was separated as shown in Fig. 1b. DNA from each Sml punch underwent 300× whole genome sequencing (WGS), and mosaic variants were identified. Quantification/Analysis: bulk DNA from each punch, as well as fluorescence-activated nuclei sorting (FANS) cell populations for one individual (ID02) underwent >3000× massive parallel amplicon sequencing (MPAS). b, Distribution of 471 bona fide somatic variants within sampled regions across ID02, ID03, and ID04. Cortical-only variants shared between hemispheres were labeled in red, the number is shown in parentheses. c, Square root transformed (sqrt-t) maximal allelic fraction (AFmax). Horizontal lines: median; box: quartiles; whiskers: the extent of data without outliers; outliers: inter-quartile range >1.5, n numbers are the same as labeled in b. d, Number of variants found exclusively in each Sml biopsy (from total n=292). e, As in Fig. 1h, hierarchical clustering of 102 (ID02), 235 (ID03), or 134 (ID04) variants and their pairwise Pearson’s correlation of AFs from MPAS. Due to the sampling strategy single-tissue variants dominate in ID03 and ID04. ‘Enriched’: present in both biopsies on one side but only in one on the contralateral side; dark gray: ‘non-lateral’, i.e., variants present only in the cerebellum. Bottom: highlighted clusters (black triangles) reveal increased correlation within lobes and hemispheres.
Extended Data Figure 3.
Extended Data Figure 3.. Patterns of Clonal Spread within Lobes Are Predicted by Immediate Proximity for ID01.
a, Scatter plot as in Fig. 2h for 102 (ID02), 235 (ID03), 134 (ID04), or 471 (ID02, ID03, and ID04) variants and 5 sample pairs where mosaicism was detected. Horizontal red line: separation of 1 sample and >1 samples; vertical red line: AF at 0.05; OR=18.996 (95% CI: 9.276–45.276) and P<2.2e-16. OR and P-value for h and i: Two-tailed Fisher’s exact test for count data, based on the measured AF and number of positive samples for each variant. b, 13 punches (8 punches proximal and 4 punches distal to the central punch) were assessed for all 259 variants from ID01 from 3 representative lobes (L-PF, L-T, and R-PF) to measure the degree of AF sharing based upon proximity. Lobe is projected onto the checkerboard. Central small biopsy (Sml) used for variant discovery is site ‘g’. Lrg: homogenized remaining lobar tissue was also assessed for variants. Sample dropouts in gray. c, Local spread of a variant shown in Fig. 2f, restricted to R-PF (see geoclone Fig. 2f). d, Local spread of four different variants that were restricted to a single Sml punch from one lobe. Variants identified only within a Sml punch were often evident in one or more adjacent punches, but even then often not evident in the Lrg tissue, likely a result of dilution within Lrg even at 3000x coverage. e-g, AF-based hierarchical clustering of variants and tissues in subsamples in L-T (e), R-PF (f), and L-PF (g). Dark gray: sample dropout. Light gray, not closely correlated with colored boxes. Central punch ‘g’ is marked in red. For each Sml punch, we noted a block of private variants not found in any adjacent punches, suggesting these as geographically restricted, and for this reason, clustering did not demonstrate that punches adjacent to ‘g’ were also clustered closest to ‘g’. Most closely related pairs in the hierarchy were adjacent samples (e.g., in e, ‘i’ and ‘l’ block, ‘c’ and ‘h’ block), although not all adjacent samples show correlated AFs. The degree of sharing by adjacent clones exceeds random chance (P=0.0003), as determined by 10,000 random shuffles of the sample labels. h, Spearman correlation’s ρ for a pair-wise comparison of the central Sml biopsy ‘g’ with all other analyzed sublobar samples. While some punches correlate more significantly with g than others, the correlation was not directly related to distance, suggesting that while adjacent samples may have correlated AFs, as seen in e-g, inter-biopsy distance, in general, is a poor predictor of correlation.
Extended Data Figure 4.
Extended Data Figure 4.. Fluorescence-Activated Nuclei Sorting Isolates Enriched Cellular Populations.
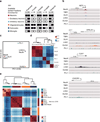
a, Available and MPAS-analyzed sorted populations from cortical areas of ID01. Black: available; White: DNA quantity/quality not sufficient for MPAS analysis. b, UCSC genome browser tracks of H3K27ac for brain cell-type nuclei populations. Representative genes for neurons include excitatory neurons (NEFL encoding Neurofilament Light), OPCs/Oligodendrocytes (OPALIN encoding for Oligodendrocytic Myelin Paranodal And Inner Loop Protein), astrocytes (GJA1 for Gap Junction Protein Alpha 1), and microglia (CX3CR1 for Fractalkine Receptor). c, PCA of H3K27ac in nuclei from NeuN+, TBR1+, DLX1+, OLIG2+, NeuN-/LHX2+, and PU.1+ brain populations. d, Heatmap of Pearson’s correlation of H3K27ac ChIP-seq log2(Normalized tags+1) in NeuN+, TBR1+, DLX1+, OLIG2+, LHX2+/ NeuN-, and PU.1+ cell populations. e, Comparison of H3K27ac ChIP-seq of brain nuclei populations from the postmortem, adult brain of ID01 with nuclei populations from surgically resected, pediatric brain. Heatmap of Pearson’s correlation of all H3K27ac ChIP-seq log2(Normalized tags+1) values from cell types in the postmortem tissue (marked with an asterisk) compared to H3K27ac ChIP-seq data sets from surgically resected brain tissue of pediatric patients.
Extended Data Figure 5.
Extended Data Figure 5.. Correlations of AFs in Bulk Tissues and Sorted Populations Highlight Features of Mosaic Variants in ID01.
Correlation plots with hierarchical clustering based on Pearson’s correlation coefficients between AFs measured in different bulk tissues (Bulk) or sorted cellular fractions (Sorted Populations). AFs were assessed by MPAS and correlations were calculated between all possible combinations from the 259 detected variants, as described in Fig. 1h. Color codes show the left-right distribution of the variant, and in which tissue the variants were detected on the level of bulk tissues. The upper half of the diamond is the correlation used to determine the order in the lower half of the diamond. The two correlations show that bulk sample analysis and sorted cellular fraction analysis contain overlapping but distinct information. For instance, shared lateralized variants appear in both analyses when using ‘Bulk’ to cluster, but the variants restricted in one sample are mostly absent from ‘Sorted Populations’.
Extended Data Figure 6.
Extended Data Figure 6.. Statistical Modeling Estimates an Effective Population Size of ∼90–200 Progenitors prior to Left-Right Separation.
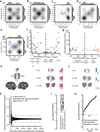
a-e, Contour plot similar to Fig. 3i for informative variants for ID01 (n=187, a), ID02 (n=95, b), ID03 (n=226, c), ID04 (n=131, d), or the combination of ID02, ID03, and ID04 (n=452, e) but for bulk tissues; anterior (PF) and posterior (T) brain regions: A, P. Arrows shown in e indicate the continuous distribution between anterior-posterior but not left-right as in Figure 3i. f, Normalized difference of mosaic variant average AF (Rmean - Lmean) of sorted brain-derived cells (i.e., non-PU.1+) of ID01 from left and right hemisphere (Normalized Δ; see Methods) and their negative log10 P-value comparing individual values from both hemispheres (Two-way ANOVA for side, using side and sorted cell type as two independent variables; Bonferroni-corrected). Size of markers, fill-color, and edge-color indicate a variant’s AFmax, significant lateralization, and P<10–10, respectively and as indicated. Enrichment is determined by a P<0.05 and a Normalized Δ of below −0.5 or above 0.5. g, Allelic fractions of variants enriched in either hemisphere of ID01. X-axis as in a, y-axis is the AFmax of a variant. The color indicates enrichment as in f. h, Red: cells with variants occurring during very early development stages before brain lateralization, distributed differently in both hemispheres and potentially shared by non-brain tissues. Blue: cells with variants that occur after the left-right split, detected only in one hemisphere. i, AF quantified from the left and right hemisphere of the red variants: the larger the predicted starting population at the time of the left-right separation is, the smaller the expected AF differences will be. j, AF quantified for fully lateralized variants; the smaller the population immediately after the left-right separation, the higher AF will be observed for lateralized variants. k, Example variant of ID01 used for the estimation of the maximal effective population size supported by the observed difference between left and right (95% bands of a hypergeometric distribution are plotted in black). Blue and red dashed lines: average AF measured in both hemispheres. Green line: upper bound of the estimated starting population. l, Upper bound of the starting population estimated from all variants of ID01 shared in both hemispheres, by non-brain organs, or both, suggesting that they were present before the left-right split. The 5-percentile for all the estimated variants was 211 (grey dashed line), the lowest estimation was 160. m, Minimum Starting population estimated from all variants of ID01 unique to one hemisphere; the smallest estimated number was 86 (black dashed line). This estimated that the effective founder population prior to the left-right separation was 86–211 progenitors.
Extended Data Figure 7.
Extended Data Figure 7.. Individual Geoclones and Overall AF Correlation of Cell Types is consistent with the Detection of Contributing Ventral and Dorsal Clones.
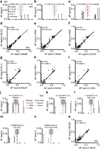
a, Clone from ID01 with NeuN+, OLIG2+, and LXH2+ cells in one right-sided lobe, suggesting a dorsally and ventrally derived clone with restriction along left-right and anterior-posterior. b, Clone from ID01 with OLIG2+ and LXH2+ cells in R-PF, but not observed in NeuN+ cells and not in other lobes, suggesting a dorsally derived clone. c, Clone from ID01 with bilateral LHX2+ cells and PU.1+ cells, suggesting an early low-abundance clone that might have been positively selected in both proliferating populations. N: neurons; OG: oligodendrocytes; AC: astrocytes; MG: microglia d-f, Correlation plots of AFs for sorted populations of NeuN+, OLIG2+ and LHX2+ cells from ID01. Each data point shows one variant for one region where high-quality data (>1,000×) was available; d: n=522 pairs/118 variants; e: n=416/117; f: n=395/115. While all three cell types showed a significant positive correlation, neurons showed a higher correlation with oligodendrocytes than astrocytes, consistent with current knowledge about cellular origins. g-i, Correlation plots of AFs for sorted populations of PU.1+ cells with NeuN+, OLIG2+, and LHX2+, and TBR1+ cells from ID01. Each data point shows one variant for one region where high-quality data (>1,000×) was available; g: n=134 pairs/82 variants; h: n=138/86; i: n=65/65. Overall, correlation is low, but best for astrocytes, likely driven by the clonal patterns similar to c. j-n, Clones from ID02 where samples of the four cortical areas were sorted for NeuN+ and OLIG2+ cells. Examples show a widely distributed clone (j), an enriched clone (k), unilateral clones (l and m), and a clone restricted in one sample (n). o, Correlation plots of AFs for sorted populations of NeuN+ and OLIG2+ cells from ID02. Each data point shows one variant for one region where high-quality data (>1,000×) was available; n=108 pairs/71 variants. Spearman correlation’s ρ and two-tailed P-value are shown for the pair-wise comparison, as is a simple (one independent) linear regression with least-square estimated mean in the center and 95% error bands for d-i and o.
Extended Data Figure 8.
Extended Data Figure 8.. Excitatory Neuron Marker TBR1 and Inhibitory Neuron Marker DLX1 Enable Dissection of Ventral and Dorsal Clone Contribution.
a, TBR1+ sorted nuclei from ID01 show acetylation of H3K27 at promoter-specific for excitatory neurons but not for inhibitory neurons. DLX1+ sorted nuclei from ID01 show acetylation of H3K27 at promoter-specific for inhibitory neurons but not for excitatory neurons. UCSC genome browser track for H3K27ac in NeuN+, TBR1+, and DLX1+ populations at loci for excitatory and inhibitory neuronal markers (SLC1A7: Excitatory amino acid transporter 5; GRIN2B Glutamate Ionotropic Receptor NMDA Type Subunit 2B; TBR1: T-box Brain Transcription Factor 1; GAD2: Glutamate Decarboxylase 2; SLC6A1: GABA-Transporter 1; GAD1: Glutamate Decarboxlase 1). b-d, Correlation plots of AFs for sorted populations of TBR1+ cells with NeuN+, OLIG2+, and LHX2+ cells. Each data point shows one variant for one region where high-quality data (>1,000×) was available; b: n=137 pairs/89 variants; c: n=66 pairs/66 variants; d: n=140 pairs/96 variants. e-h, Correlation plots of AFs for sorted populations of DLX1+ cells with NeuN+, OLIG2+, LHX2+, and TBR1 cells. Each data point shows one variant for one region where high-quality data (>1,000×) was available; e: n=139 pairs/88 variants; f: n=69 pairs/69 variants; g: n=145 pairs/96 variants; h: n=147/94 variants. Available data is from L-T and R-PF only. i-l, Lolliplot of the AFs in NeuN+, TBR1+, and DLX1 cells in L-T and R-PF for 1-180856518-T-G, 8-72947366-G-A, 7-80017095-C-T, and 2-139753954-C-T. The two hemispheres show distinct patterns for excitatory and inhibitory markers for all of the variants, likely due to the stochastic seeding of early cortical cell lineages after midline separation. Spearman correlation’s ρ and two-tailed P-value are shown for the pair-wise comparison, as is a simple (one independent) linear regression with least-square estimated mean in the center and 95% error bands for b-h.
Extended Data Figure 9.
Extended Data Figure 9.. BEAST Lineage tree confirms manual clade assignment and UMAP Embedding of Mosaic Variants Suggests that Clade Variants Are Randomly Intermixed.
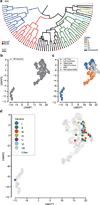
a, Lineage tree for all considered cells (n=71) using the filtered mosaic variants detectable in L-T (n=33) from ID01. A representative tree was constructed using the maximum clade credibility method while branch colors represent inferred clades. Scale bar represents the expected substitutions per site as a function of branch length. b-c, UMAP embeddings of mosaic variants (n=259) across 79 samples using the considered AF for tissues. In c, variants are colored according to their lateralization, as shown in Fig. 1h. As expected, lateralization segregates variants in this analysis. d, UMAP embedding as in b, but variants are colored according to the clades as determined from snMPAS analysis.
Extended Data Figure 10.
Extended Data Figure 10.. Clades Contribute Unequally to Interrogated Tissues and Cell Types.
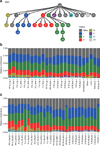
a Genotype of somatic variants determined by snMPAS and their AF information from bulk and FANS-sorted samples from MPAS was used to reconstruct the lineages in ID01. Coloring is based on the manually identified clades (Fig. 4b). Numbers correspond to variant rank (Fig. 4b). This integrated analysis confirms clade existence and determines the lineage contributions of each clade to individual organs and tissues. b, Relative contribution of variants labeled in each lineage group presented in panel a were calculated through a linear regression model. An absolute error method was used to optimize the estimation so that the weighted sum of all predicted lineages reflected the AFs measured in the 25 bulk tissues. c, Relative contribution of lineages from each clade for all sorted populations.
Figure 1.
Figure 1.. Mosaic Variants in a Human Neocortex are Mostly Lateralized and Region-Specific.
a, Dissection of individual ID01. Neocortex was divided into 10 lobes (red lines). L: left; R: right; PF: prefrontal; F: frontal; P: parietal; O: occipital; T: temporal. Box central 8mm punch (Sml: red circle) and 12 peripheral punches (white circles) were separated, the remaining lobe homogenized (Lrg). 8mm punches in other organs (red circles): C: cerebellum; H: heart; K: kidney; Liv: liver. b, Workflow diagram. ‘Discovery’: DNA from Sml, the Lrg homogenates, and additional punches (total of 25) underwent 300× whole genome sequencing (WGS. ‘Quantification/Analysis’: the originally sequenced 25 tissues, lobar peripheral punches, fluorescence-activated nuclei sorting (FANS) cell populations, and single nuclei underwent >3000× massive parallel amplicon sequencing (MPAS). c, Distribution of 259 bona fide somatic variants within sampled regions. Neocortical-only variants shared between hemispheres labeled in red, numbers in parentheses. d, Square root transformed (sqrt-t) maximal allelic fraction (AFmax). Horizontal lines: median; box: quartiles; whiskers: the extent of data without outliers; outliers: inter-quartile range >1.5, n numbers are the same as labeled in c. e-f, AFmax rank with 95% exact binomial confidence intervals (e), and violin plot (f). g, Number of variants found exclusively in each Sml biopsy (from total n=106; private, upper panel), or in Sml plus at least one other sample (from total n=134; shared). Red solid and dotted lines: mean (10.6) and 95% CI (5.3–18.3) of expectation if private variants were randomly distributed. h, Hierarchical clustering of 259 variants and their pairwise Pearson’s correlation of AFs from MPAS. Shades of blue and orange: lateralization; dark gray: ‘non-lateral’, i.e. present only in non-lateralized organs; ‘enriched’: >1.5-fold difference in the number of tissues; shades of purple and green: cortical lobe or organ distribution. Bottom: highlighted clusters (black triangles) reveal increased correlation within lobes and hemispheres.
Figure 2.
Figure 2.. Overlapping ‘Geoclone’ AFs Reveal Evidence of Cellular Bottlenecks within the Neocortical Anlage.
a, Projection of a variant onto sampled regions using a ‘geography of a clone’, or ‘geoclone’. CHR: chromosome; POS: genome position (hg19); REF: reference base; ALT: alternative mosaic base. Shaded red: AF. b-g, Example geoclones of variants with comparable AFs in single samples but distinct distributions. h, Scatter plot of all 259 variants and 25 sample pairs where mosaicism was detected (e.g., a variant with 15 positive samples is represented 15 times at the respective AFs). Horizontal red line: separation of ≤5 and >5 samples; vertical red line: AF at 0.05; odds ratio (OR)=13.514 (95% CI: 6.044–37.484) and P<2.2e-16 by a two-tailed Fisher’s exact test. A variant above 0.05 AF is more than 10 times more likely to be detected in more than 5 tissues. i-k, Routes to broad or narrow variant distribution as seen in ID01. Variants originating at 10 cell-stage prior to tissue specification (green) should be present at 0.05 AF throughout the body plan (j). Variant originating in, for instance, the 10-cell anlage of the right prefrontal (R-PF) cortex should also be present at 0.05 AF but only in the R-PF region (k). Both the green and blue example variants are thus at 0.05 AF but green shows broad spread (25 positive samples), whereas blue shows narrow spread (1 positive sample).
Figure 3.
Figure 3.. Brain-Derived Cell Types of the Cortex Separate along the Midline in Early Development.
a, Fluorescence-activated nuclei sorting (FANS) isolates nuclei from homogenates (Lrg) for neurons (NeuN+), oligodendrocytes (OLIG2+), astrocytes (LHX2+/ NeuN-; denoted as LHX2+ hereafter), or microglia (PU.1+). b, Hypothetical example variant visualized as a ‘lolliplot’: AFs across anatomic regions (PF, F, P, O, T) and cell types (bottom) in left vs. right of sampled tissues. Geoclones projected onto the background of each lolliplot. c-h, Laterally enriched and restricted variants. N: neurons, OG: oligodendrocytes, MG: microglia. i, Contour plot of informative variants (n=133) from ID01 with individual data points and two kernel density estimation plots; axes show the normalized difference for each mosaic variant between average AF of sorted brain-derived cells (i.e., non-PU.1+) on the left and right (L, R) hemispheres (Normalized Δ) and between anterior (PF, F) and posterior (P, O, T) brain regions (A, P). The ‘H’ shape suggests that the first restriction to variant spread was across the midline. Arrows indicate the continuous distribution between anterior-posterior but not left-right. j, Model for variant spread. Early clones distribute bilaterally, but newly emerging clones (blue) arising after midline separation distribute unilaterally. Later, newly emerging clones (orange) show ever greater restricted geographies. k, Correlation plots of the Normalized Δ between left and right Sml bulk tissue biopsies in the neocortex (n=5 left/5 right) and lateralized biopsies of the cerebellum (n=3 left/3 right) in ID01. Shown are informative variants present in the neocortex and cerebellum (n=79 variants). Spearman correlation’s ρ and two-tailed P-value are shown for the pair-wise comparison, as is a simple (one independent) linear regression with least-square estimated mean in the center and 95% error bands.
Figure 4.
Figure 4.. Single Nuclei Genotyping of Mosaic Variants Resolves Cellular Lineage.
a, Single nuclear MPAS workflow: 95 single nuclei (NeuN+ or NeuN-) from Sml left temporal lobe of ID01 were sorted, then amplified, and studied by MPAS. b, Ranked plot of filtered mosaic variants (n=33) and the cells in which they were detected (n=76). Grey edges/white fill: non-informative variants (clade placement was inconsistent with other clades and AFs across tissues, likely caused by genotyping errors). Red/black fill: NeuN+ and NeuN- cells. The majority of cells belonged to three major clades: I-III. Seven clades (I-VII) and likely sub-clades in I and II (I-1, I-2, II-1, and II-2) were detected, represented in both neurons and non-neurons. c, Observed AF in L-T-Sml for each of the founder variants for clade I-VII (i.e., the left-most variant in each clade) was consistent with their detection in single nuclei. d, The proposed origin of major clades during early embryonic divisions is based on the observed AF, placing the founder variants of clades I and II at ∼4-cell stage, and clade III at ∼8-cell stage. e, Relative contribution of clade I-III to the 25 bulk tissues, using nested pie charts (Sml: inner; Lrg: outer), showing only minor variation in relative contributions. f, Model for cellular diffusion barriers (CDBs). Prior to CDBs, cells diffuse or migrate freely. A CDB restricts clonal exchange and leads to differential clonal abundance. Model of hierarchical CDBs, following in order: left-right, anterior-posterior, and dorsal-ventral. t: time. Red lines: orientation of CDB. Dashed lines: visual plane in the schematic.

References

    1. Freed D, Stevens EL & Pevsner J. Somatic mosaicism in the human genome. Genes (Basel) 5, 1064–1094, doi:10.3390/genes5041064 (2014). - DOI - PMC - PubMed
    1. Woodworth MB, Girskis KM & Walsh CA. Building a lineage from single cells: genetic techniques for cell lineage tracking. Nat Rev Genet 18, 230–244, doi:10.1038/nrg.2016.159 (2017). - DOI - PMC - PubMed
    1. D’Gama AM & Walsh CA. Somatic mosaicism and neurodevelopmental disease. Nat Neurosci 21, 1504–1514, doi:10.1038/s41593-018-0257-3 (2018). - DOI - PubMed
    1. Bae T et al. Different mutational rates and mechanisms in human cells at pregastrulation and neurogenesis. Science 359, 550–555, doi:10.1126/science.aan8690 (2018). - DOI - PMC - PubMed
    1. Ye AY et al. A model for postzygotic mosaicisms quantifies the allele fraction drift, mutation rate, and contribution to de novo mutations. Genome Res. 28, 943–951, doi:10.1101/gr.230003.117 (2018). - DOI - PMC - PubMed