. 2022 May;605(7908):139-145.
doi: 10.1038/s41586-022-04632-1. Epub 2022 Apr 20.

Programme of self-reactive innate-like T cell-mediated cancer immunity

Affiliations

Programme of self-reactive innate-like T cell-mediated cancer immunity

Chun Chou et al. Nature. 2022 May.

Abstract

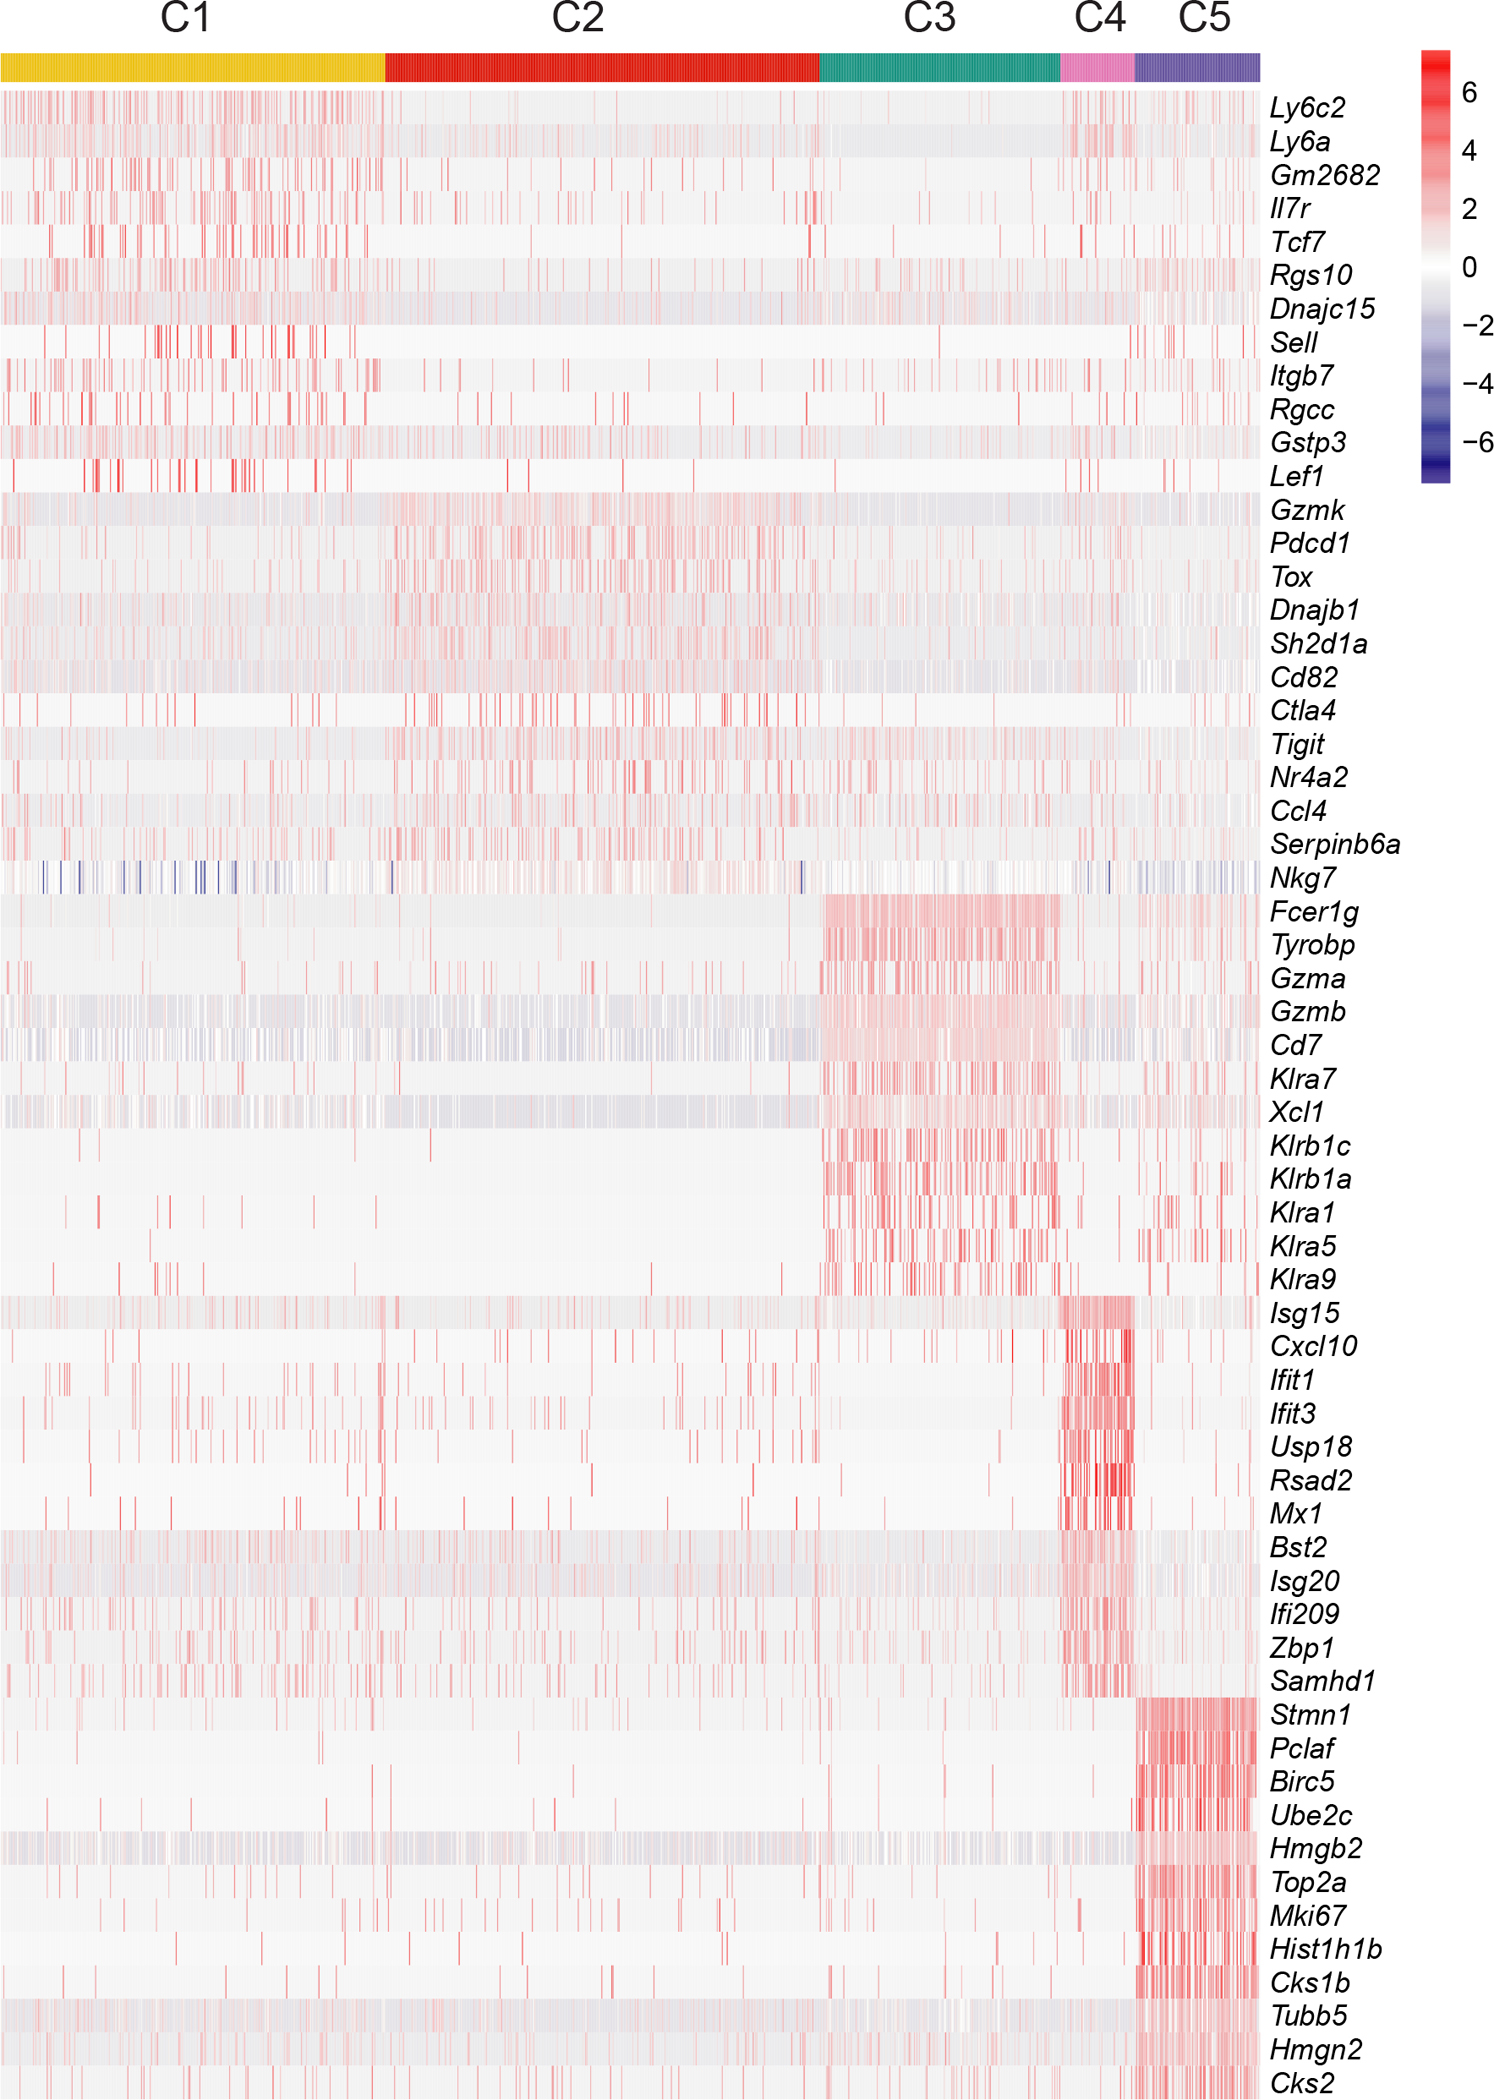
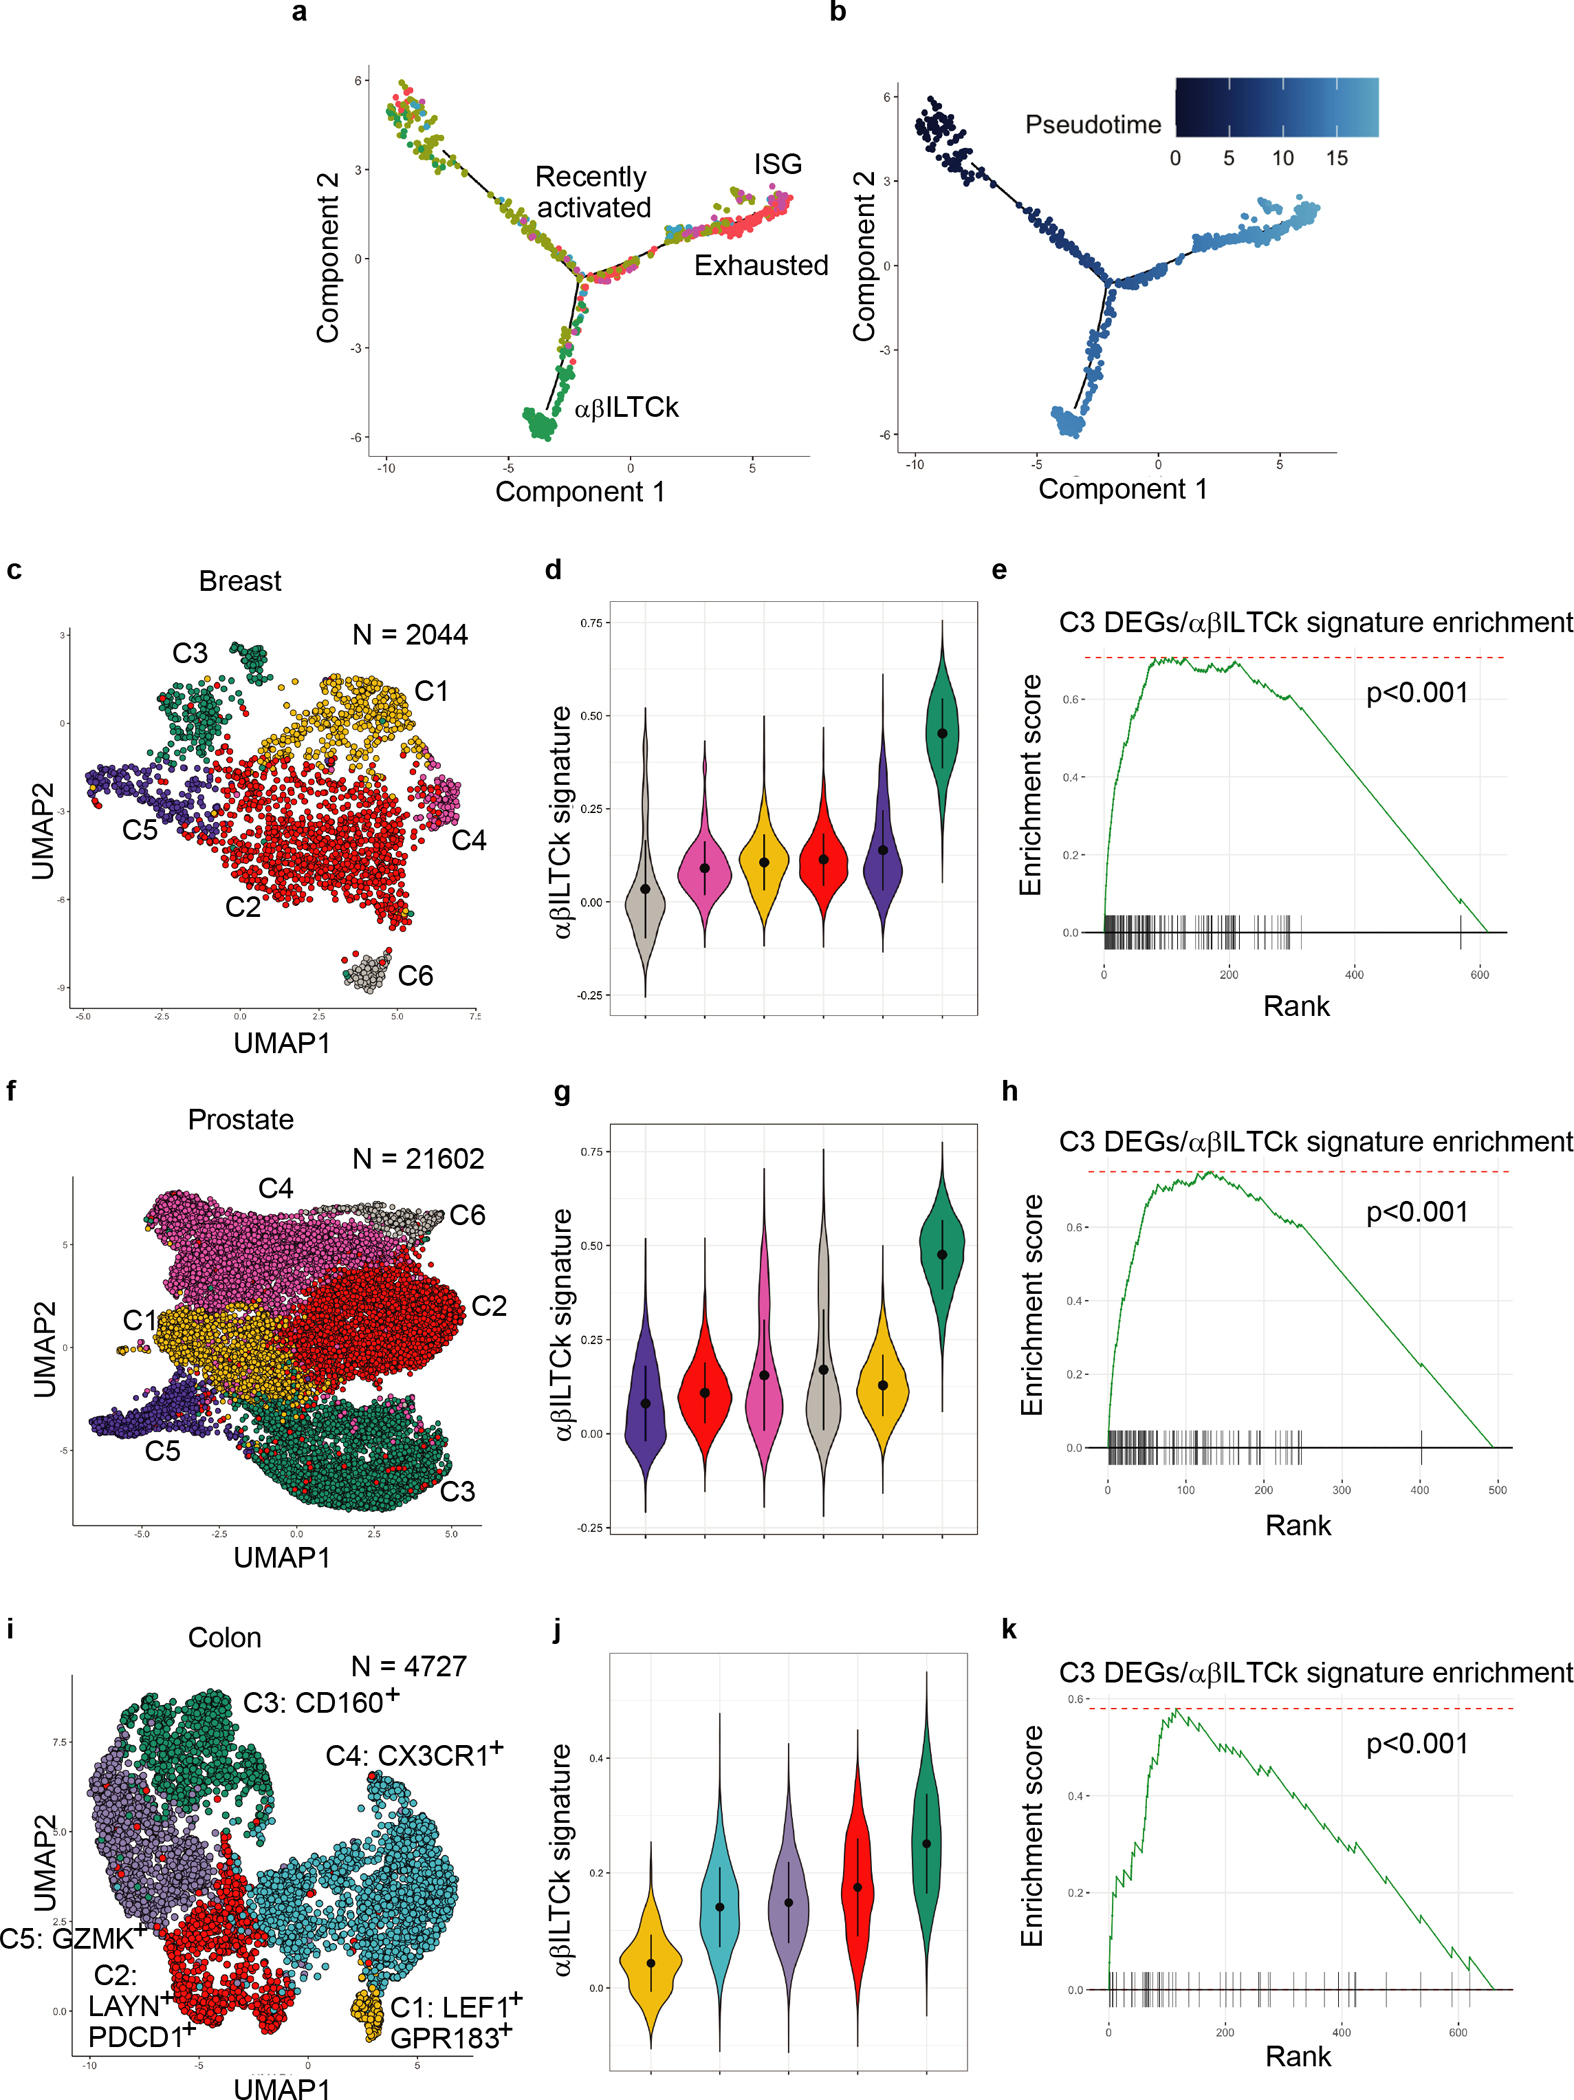
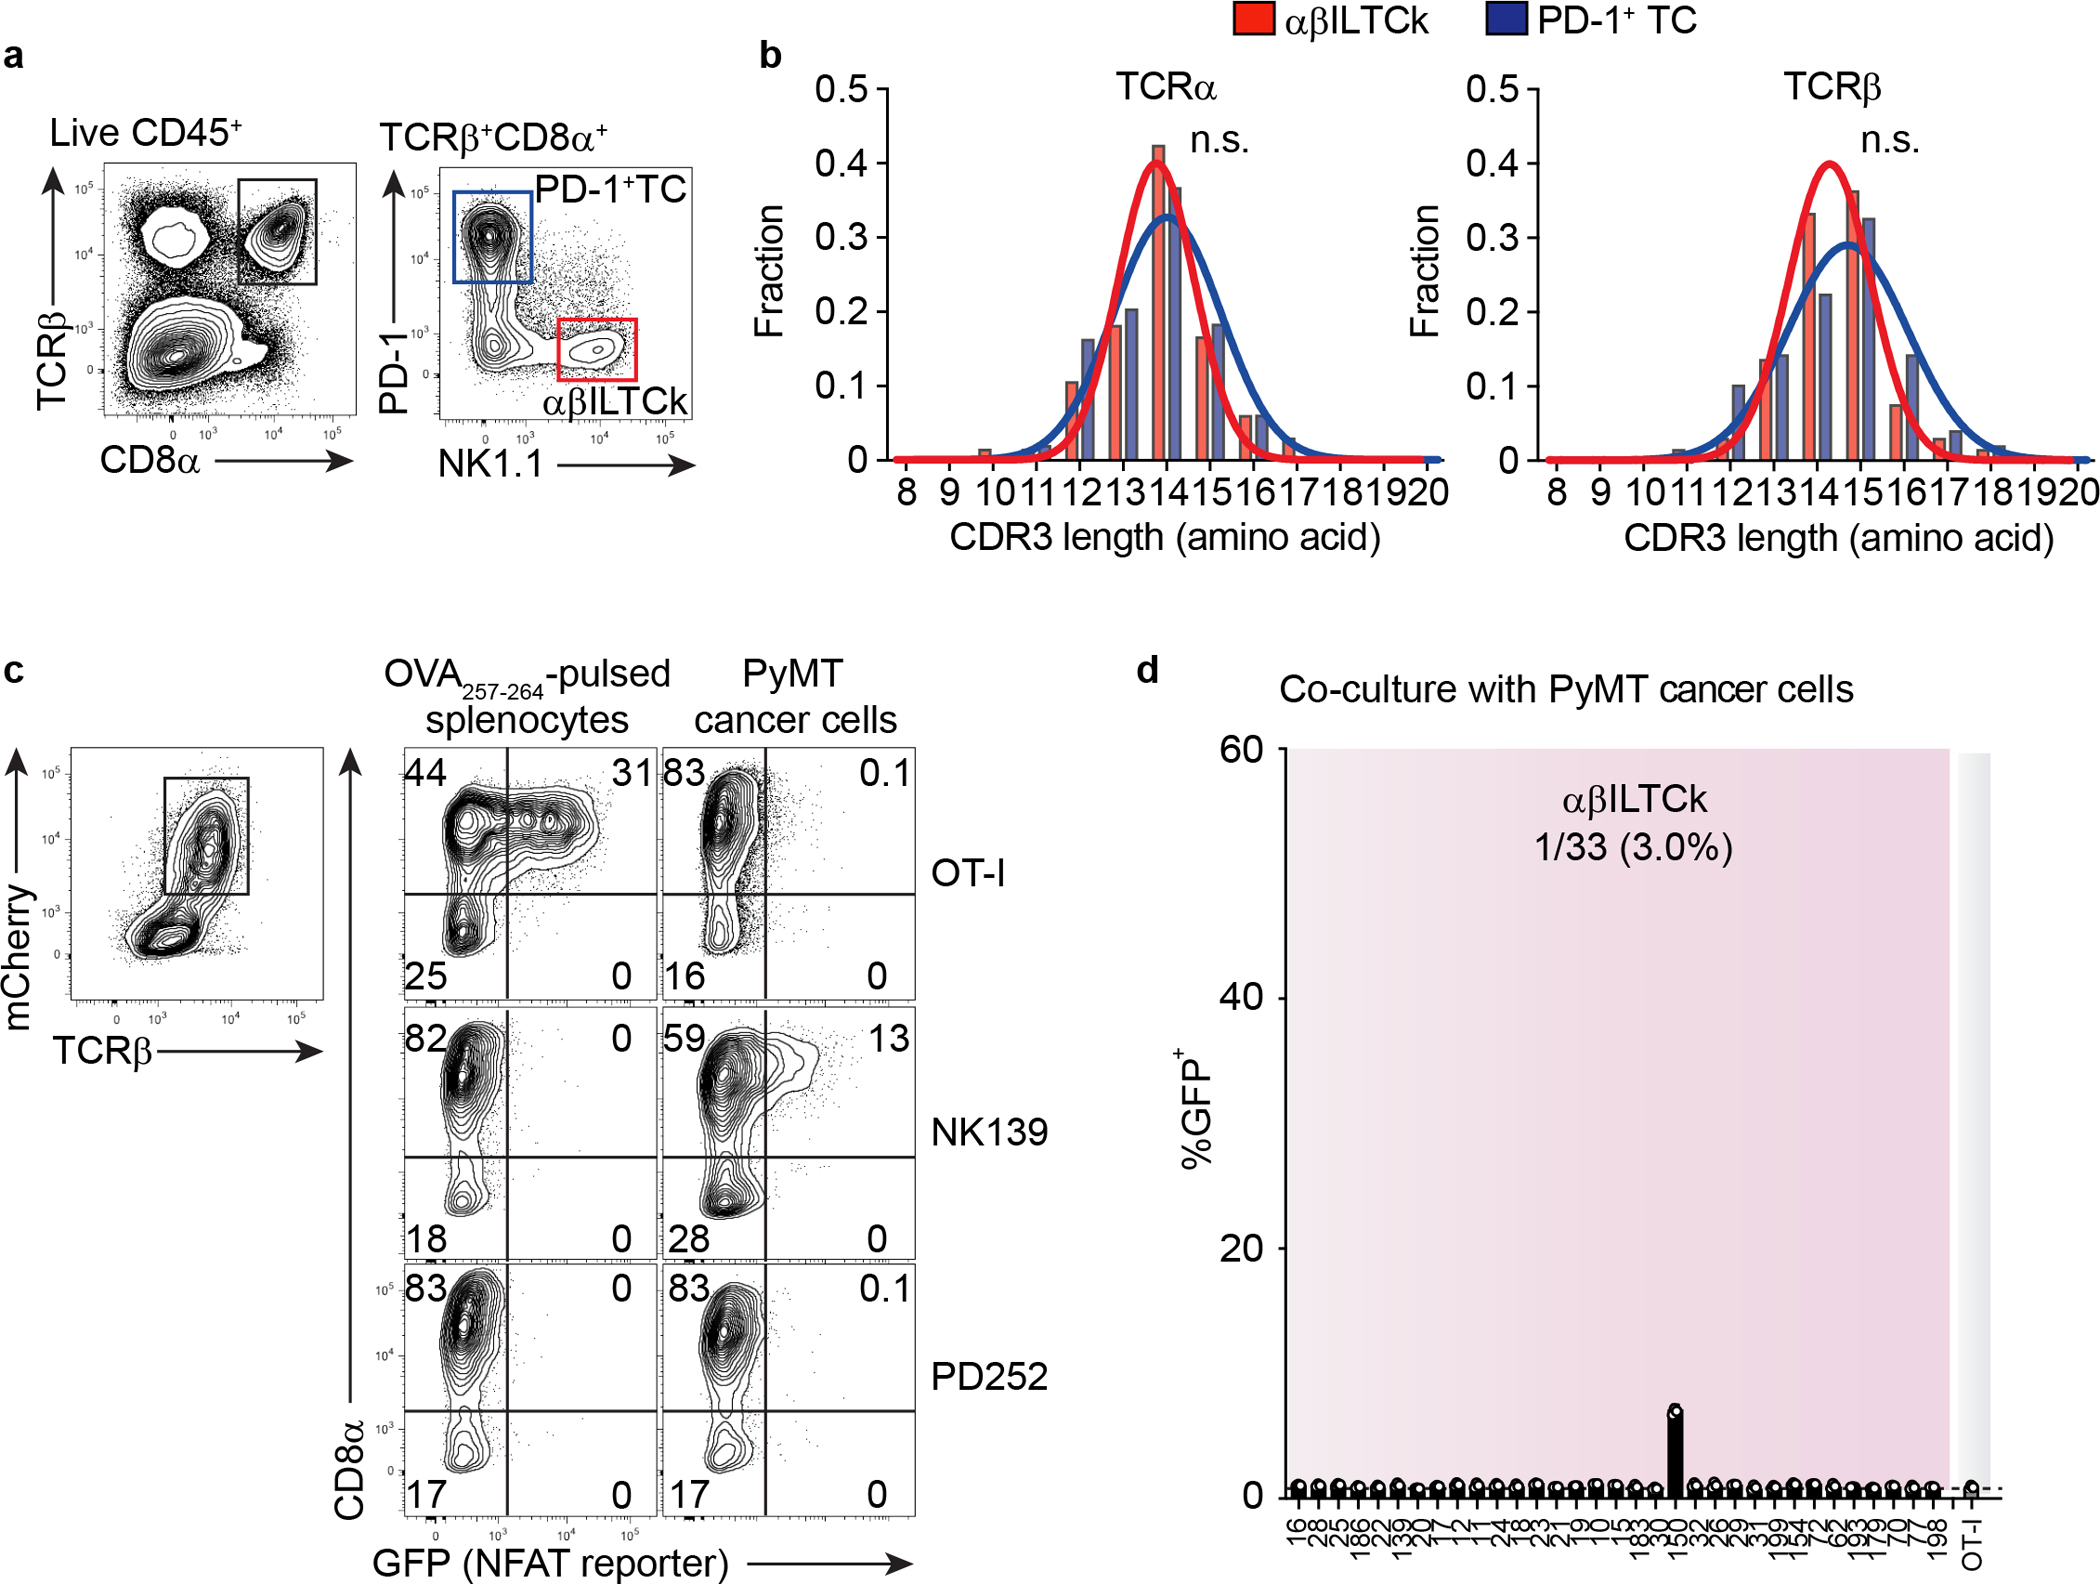
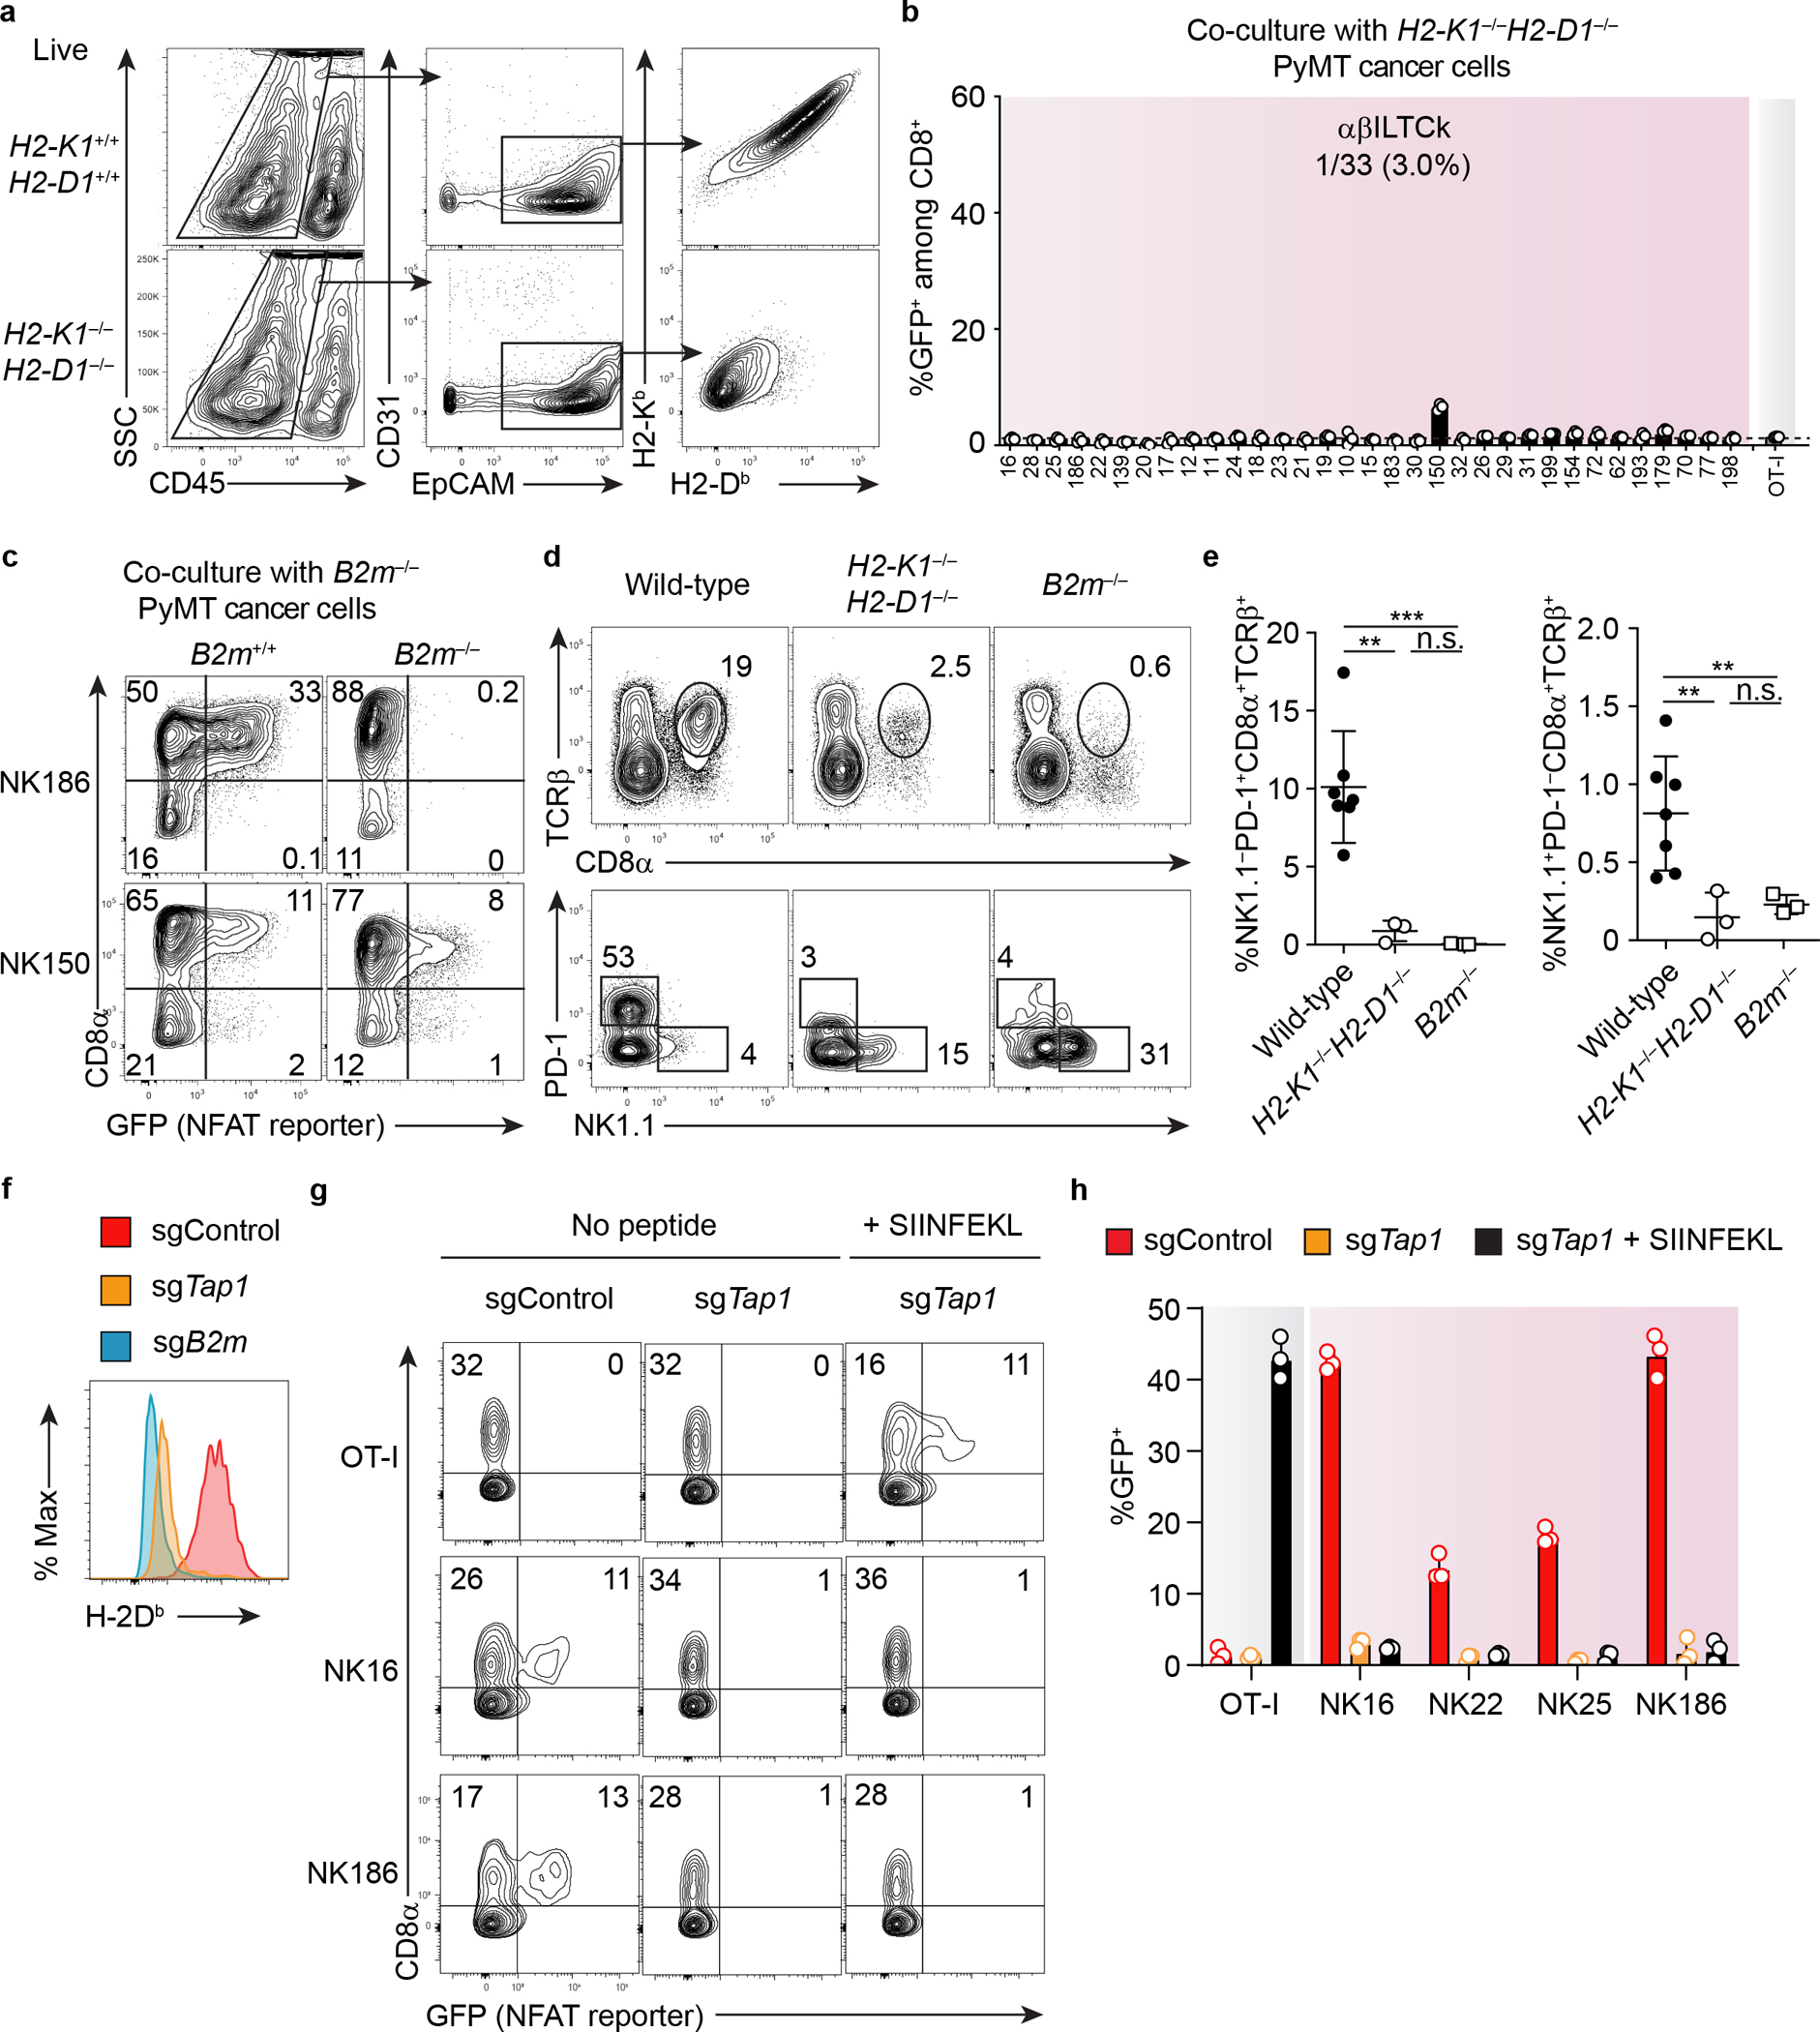
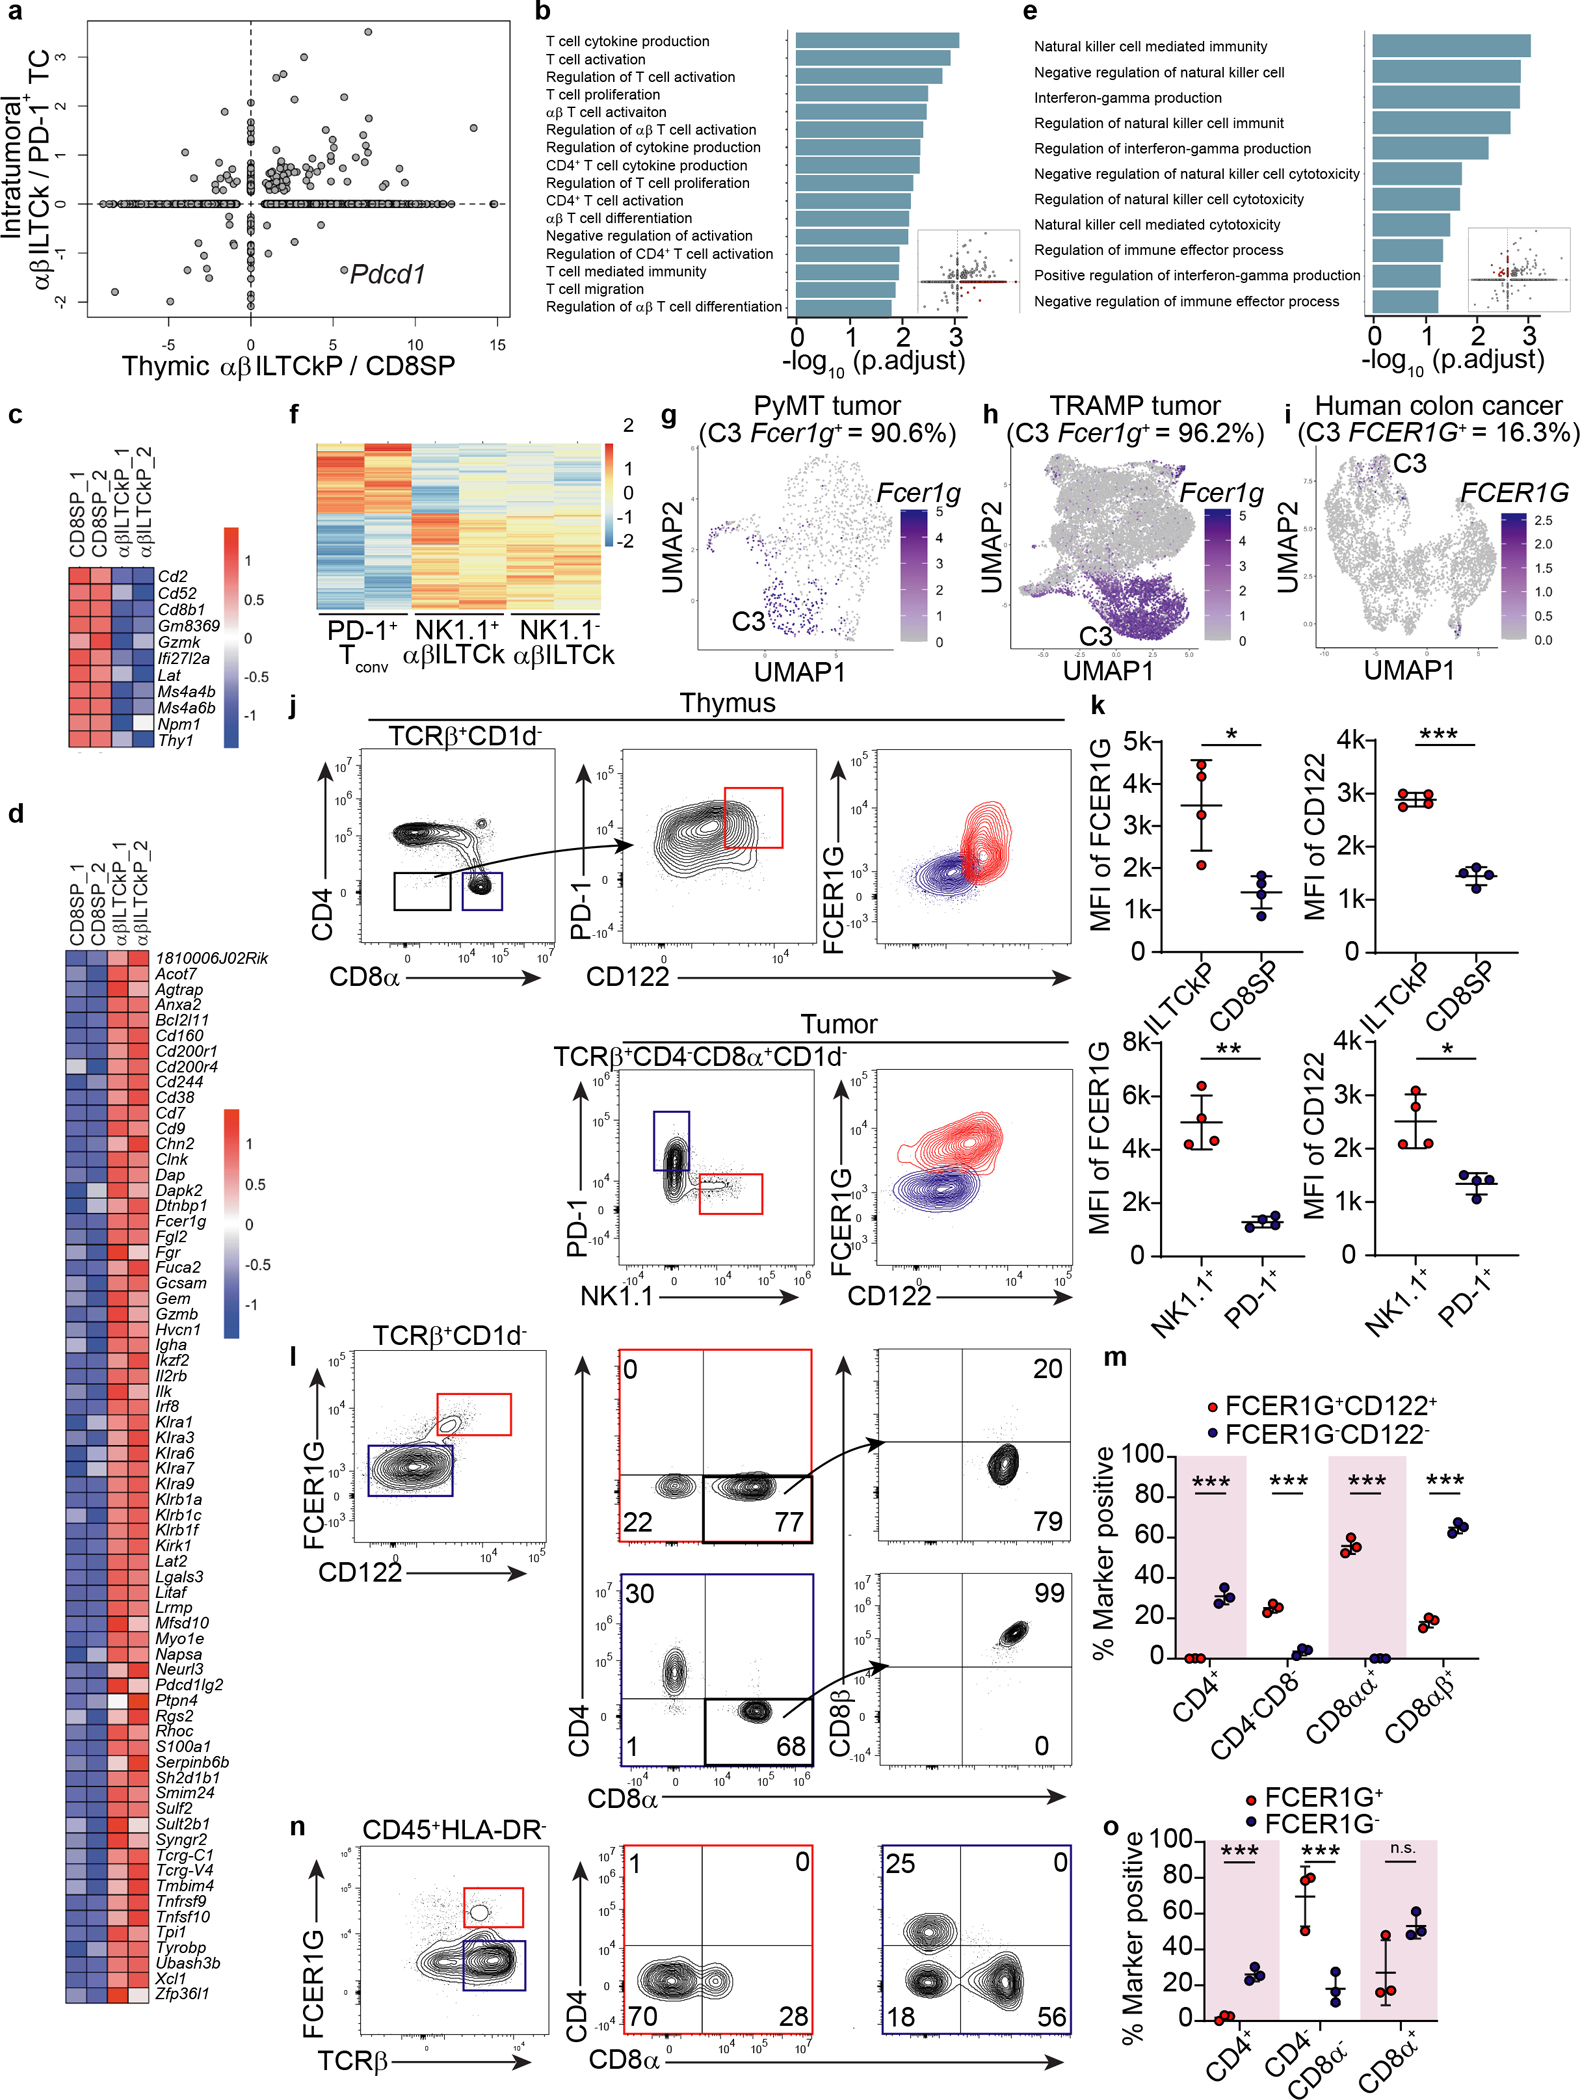
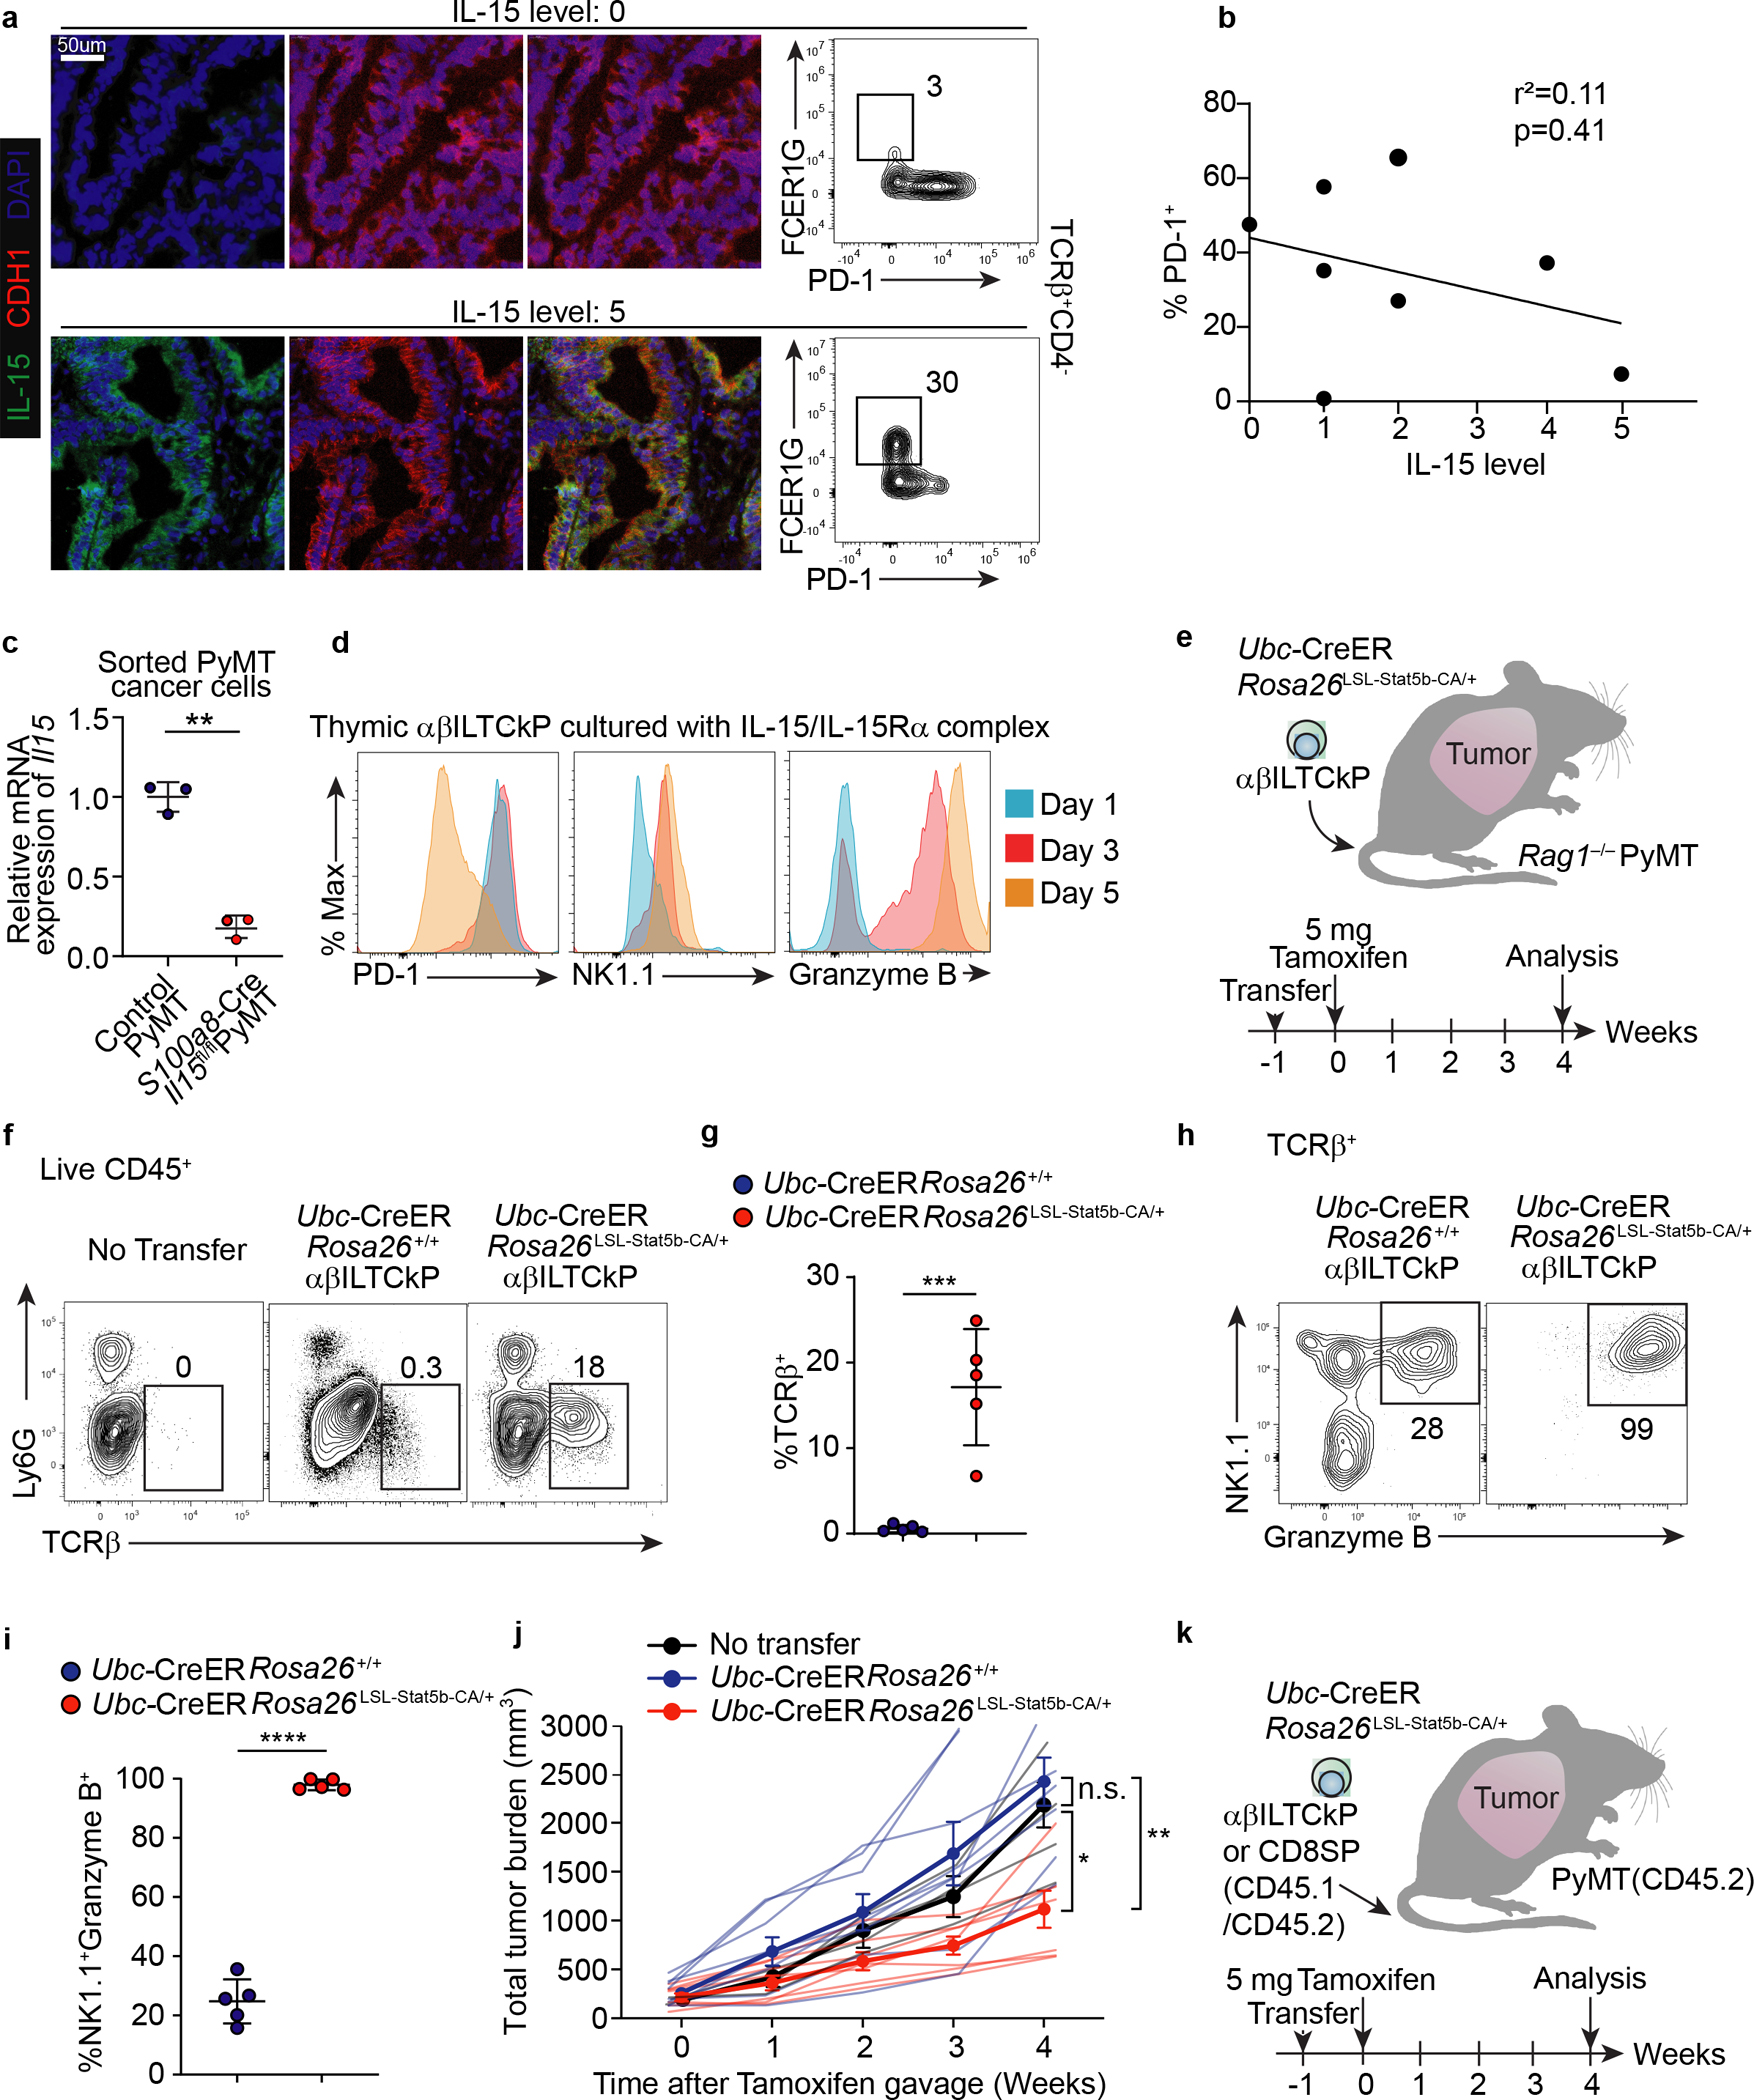
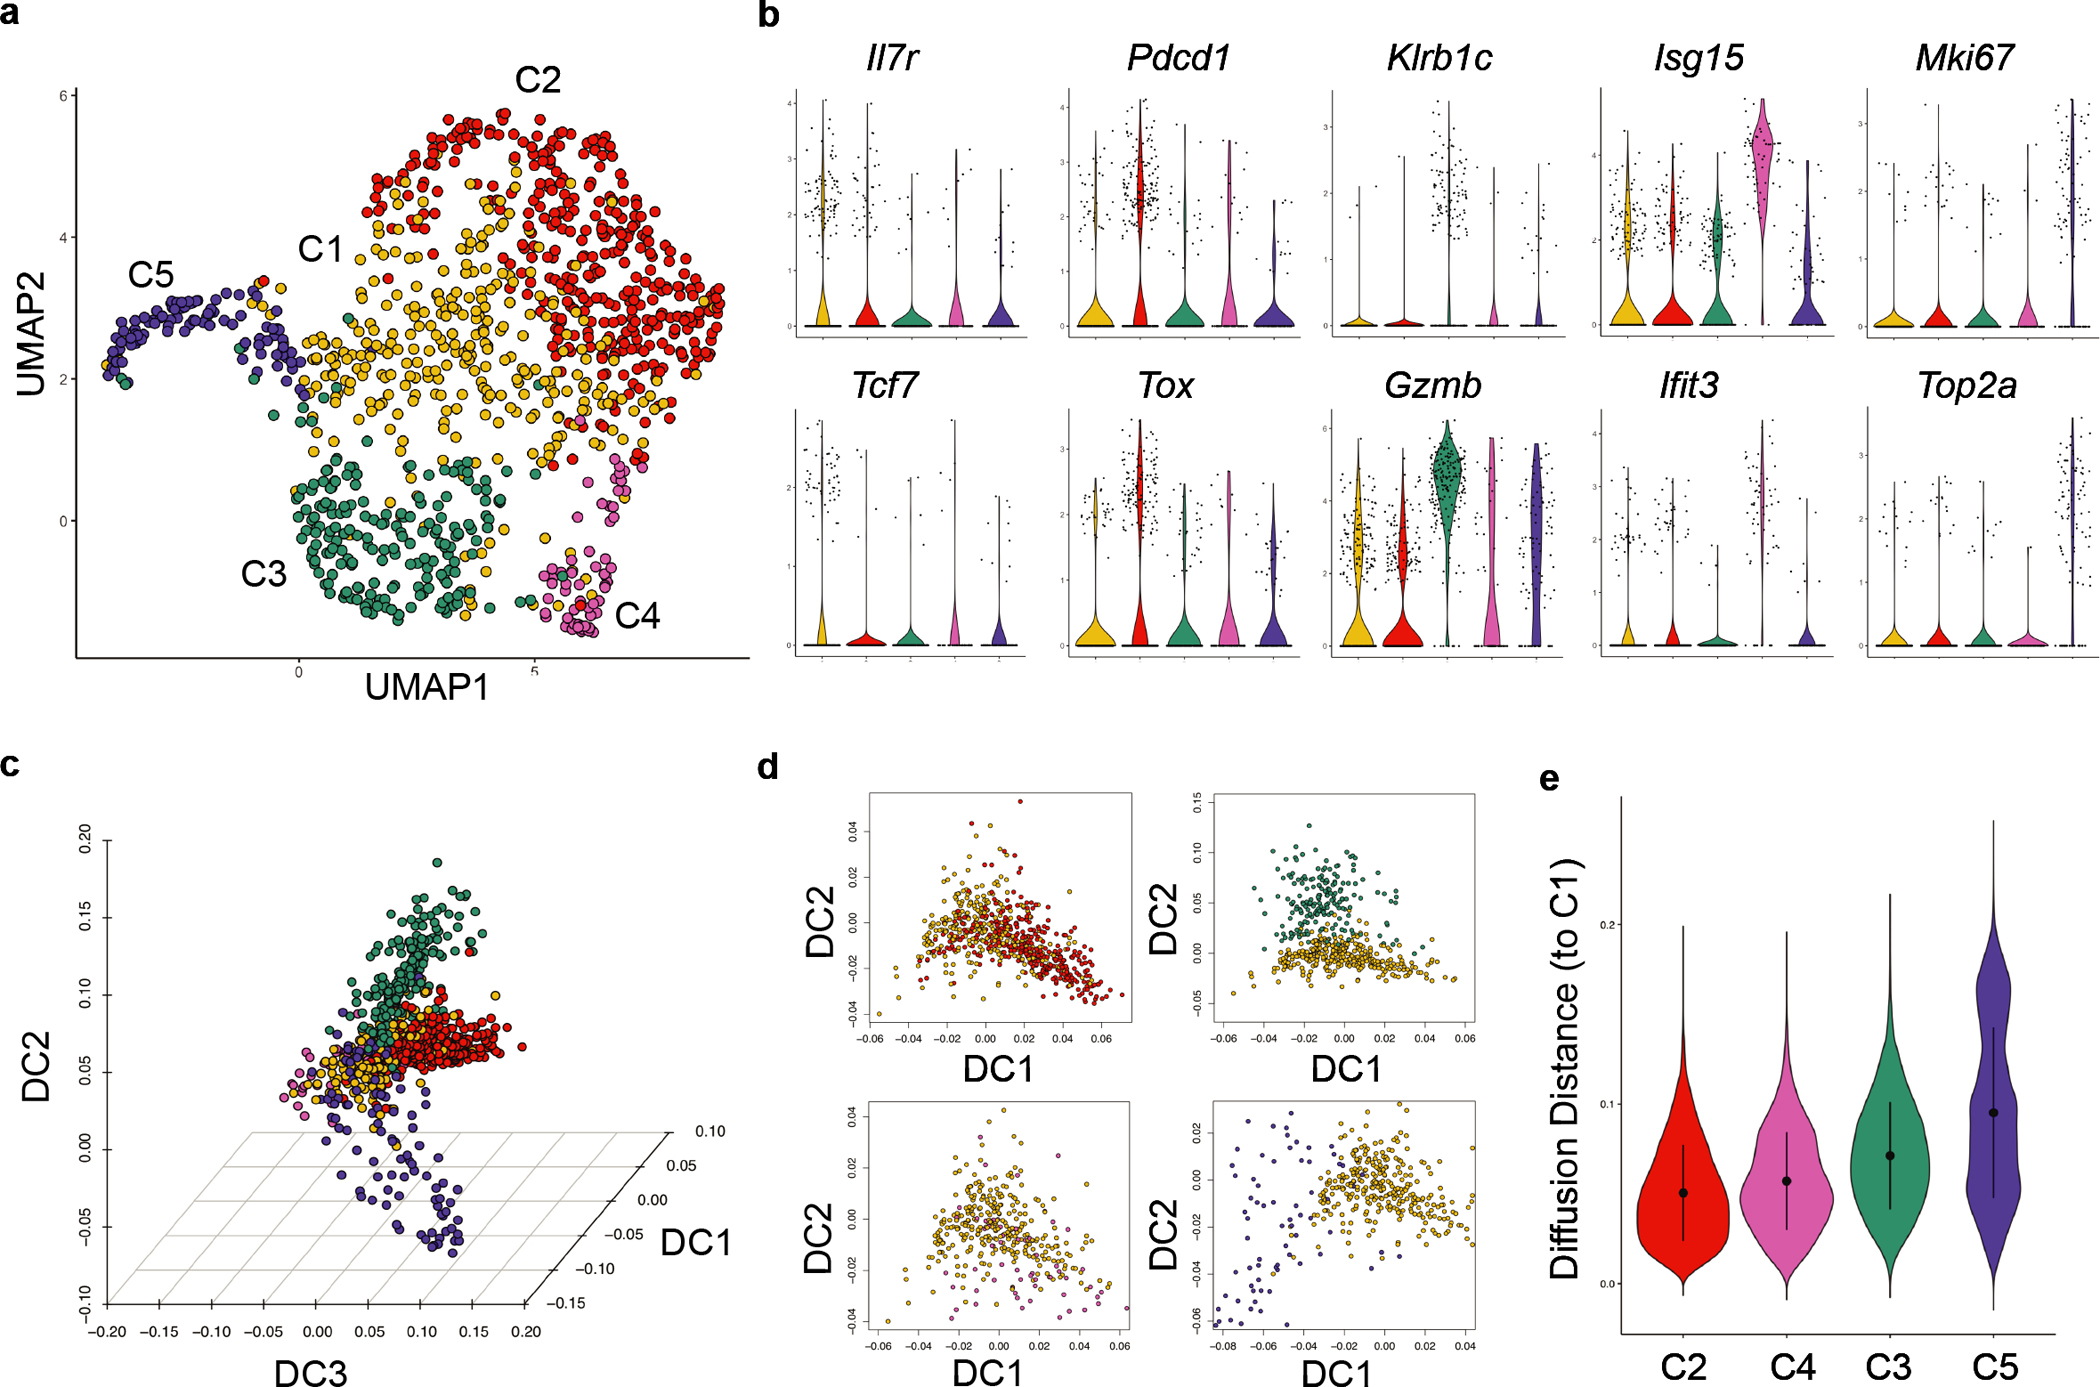
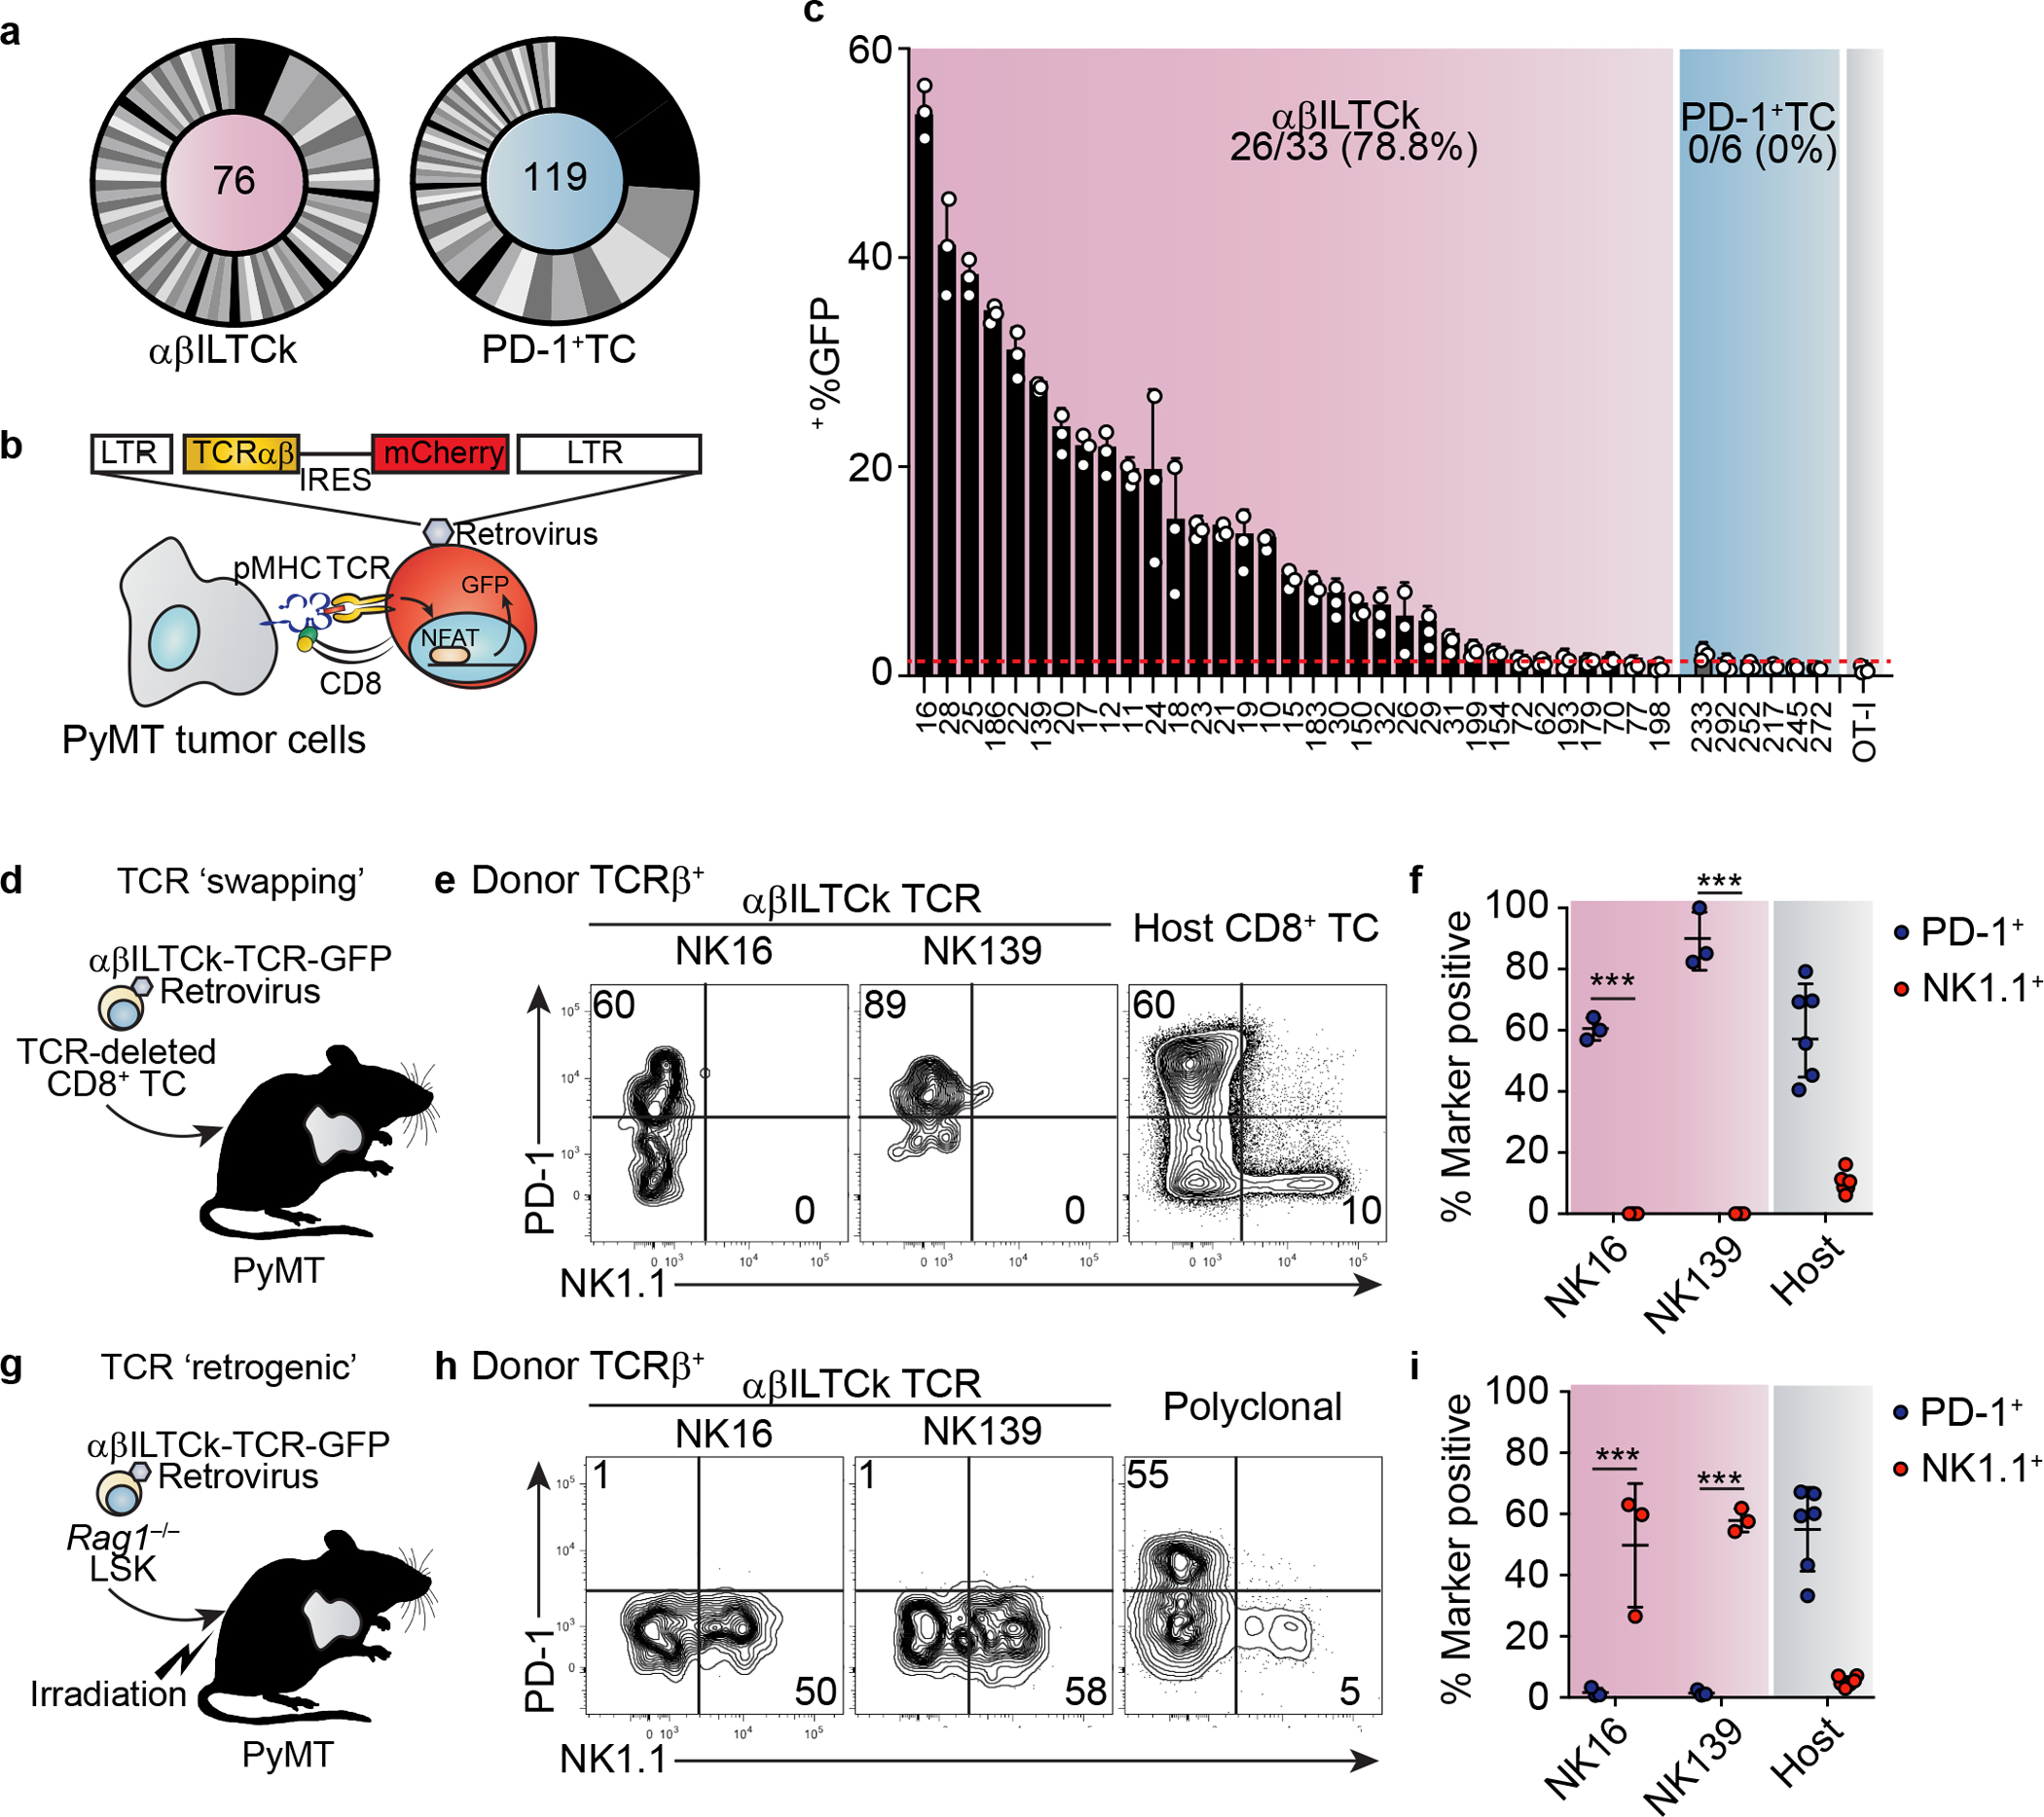
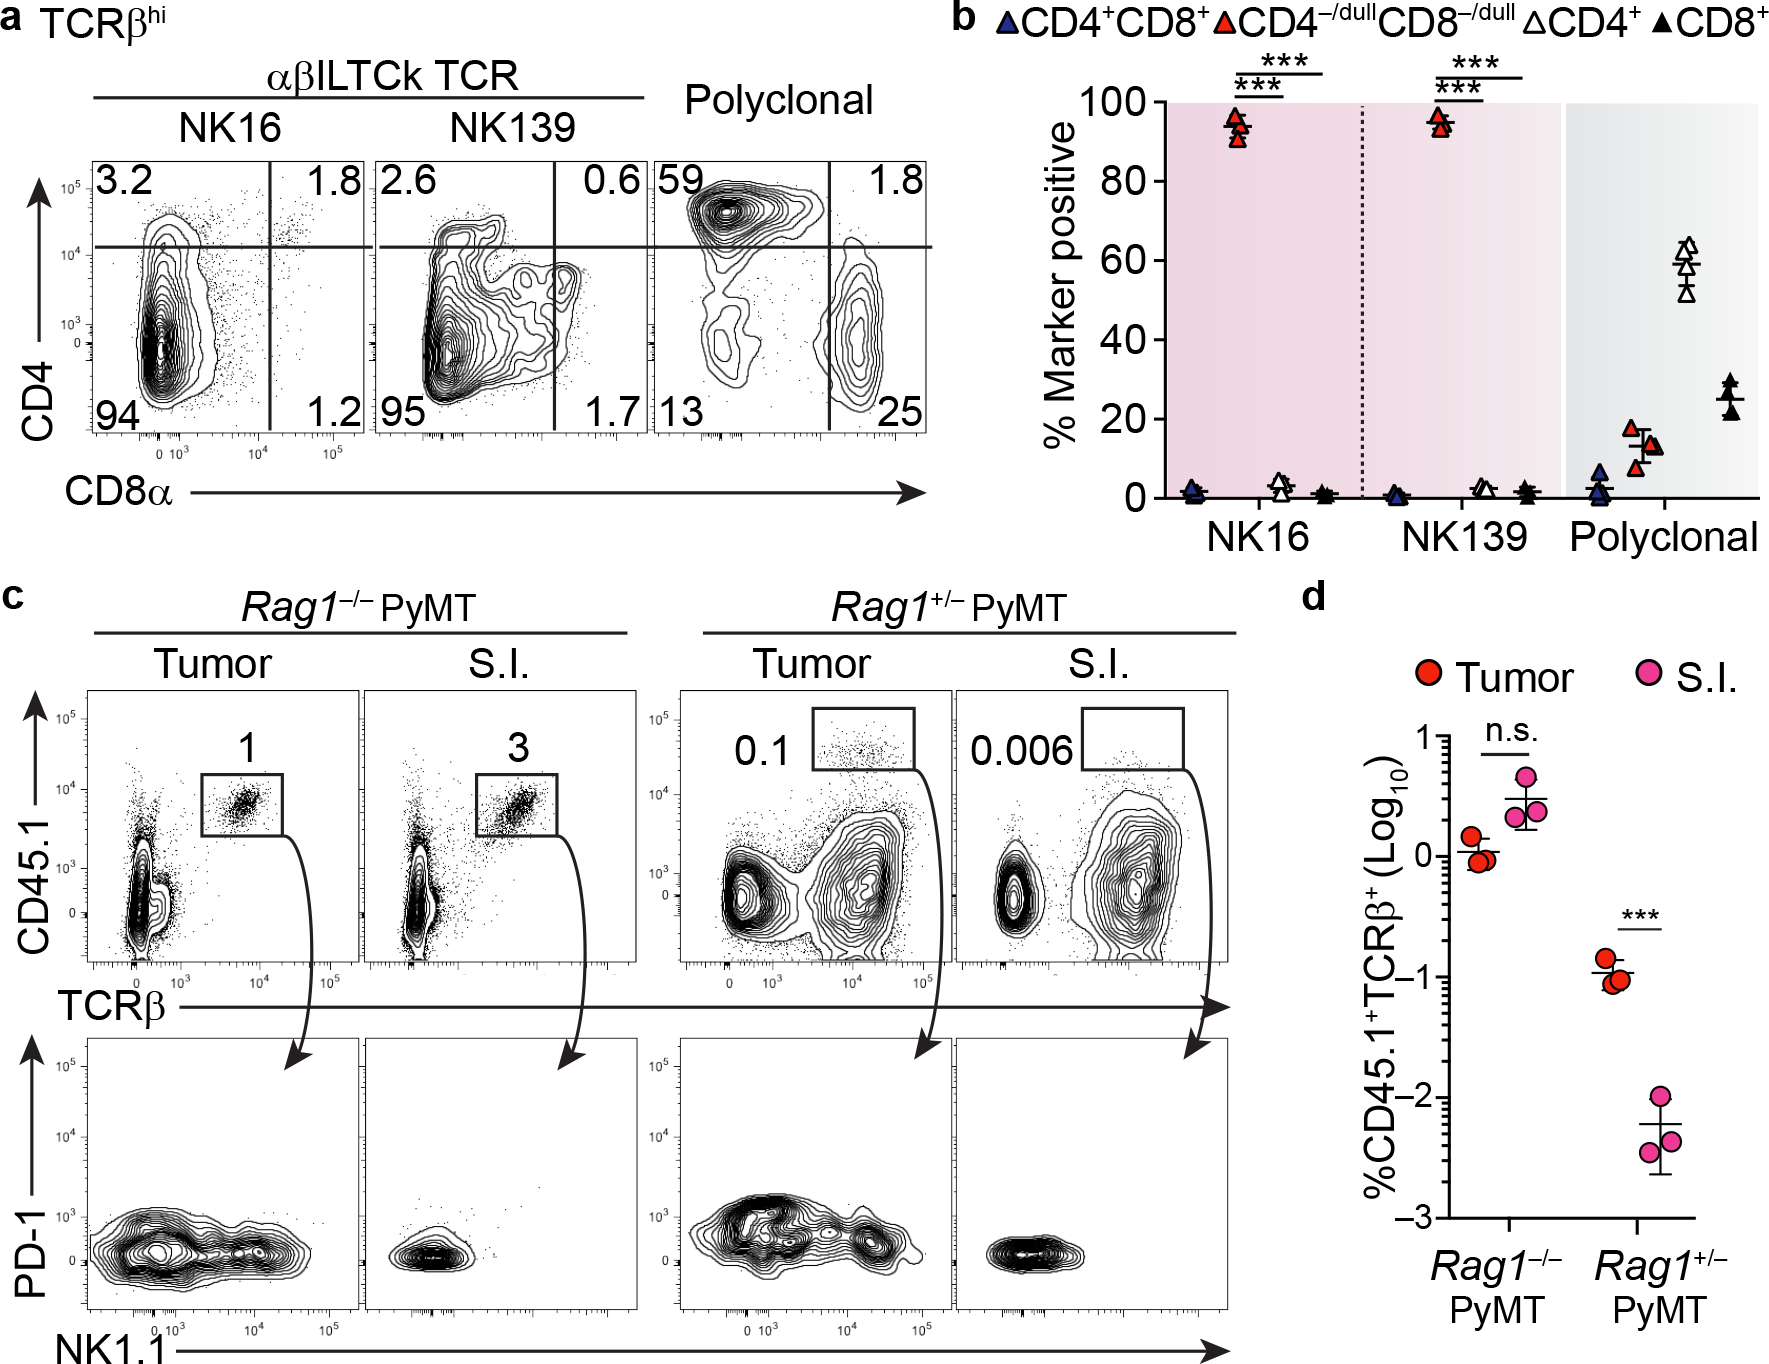
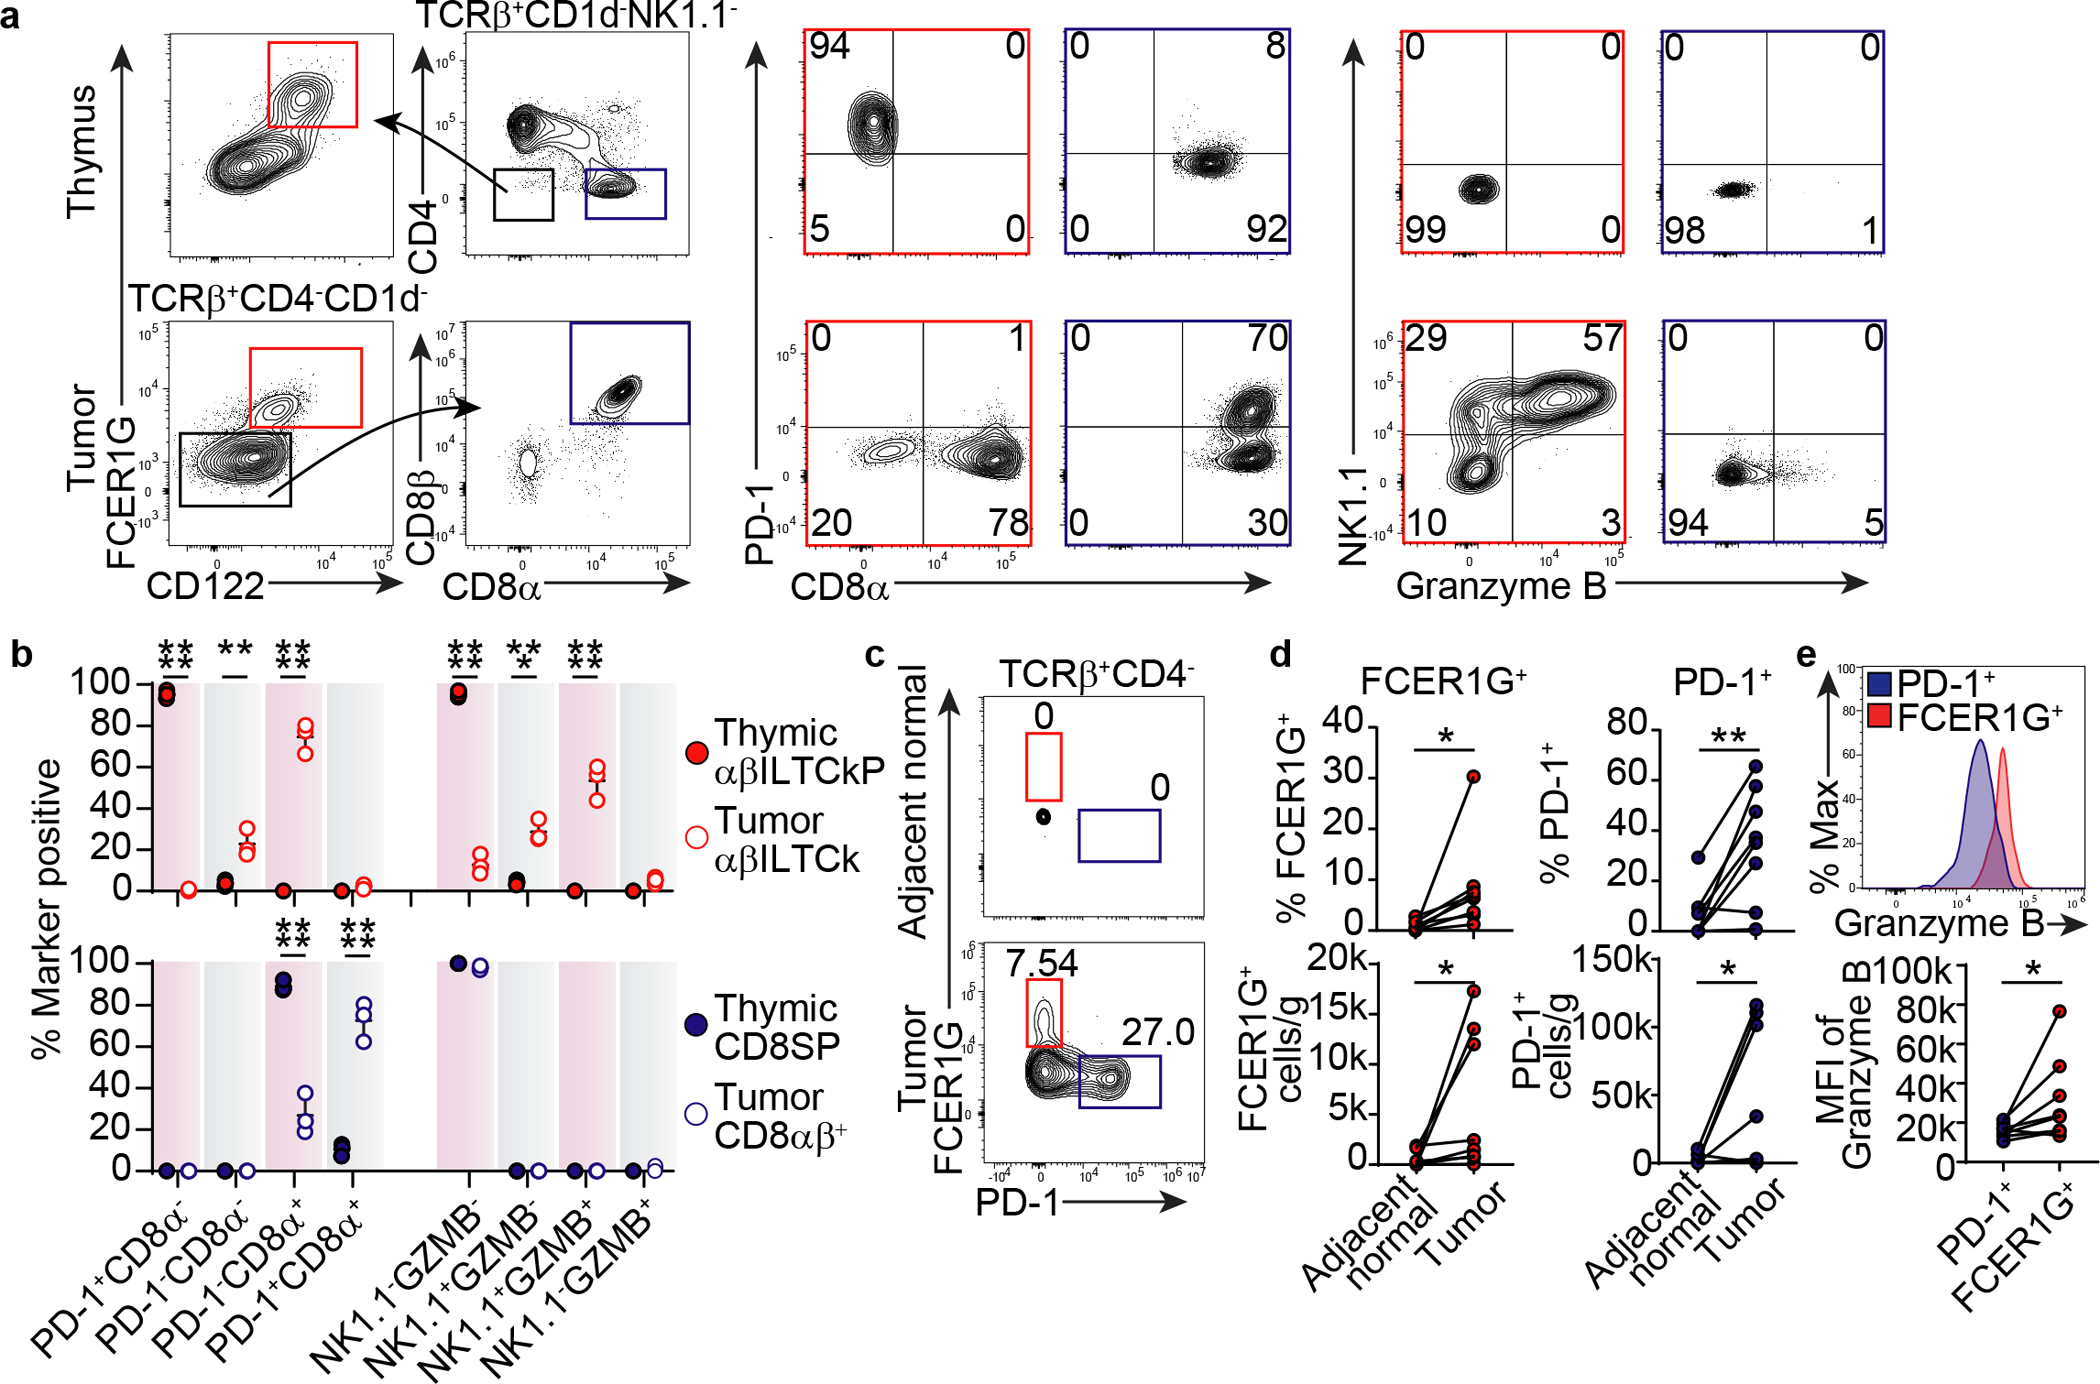
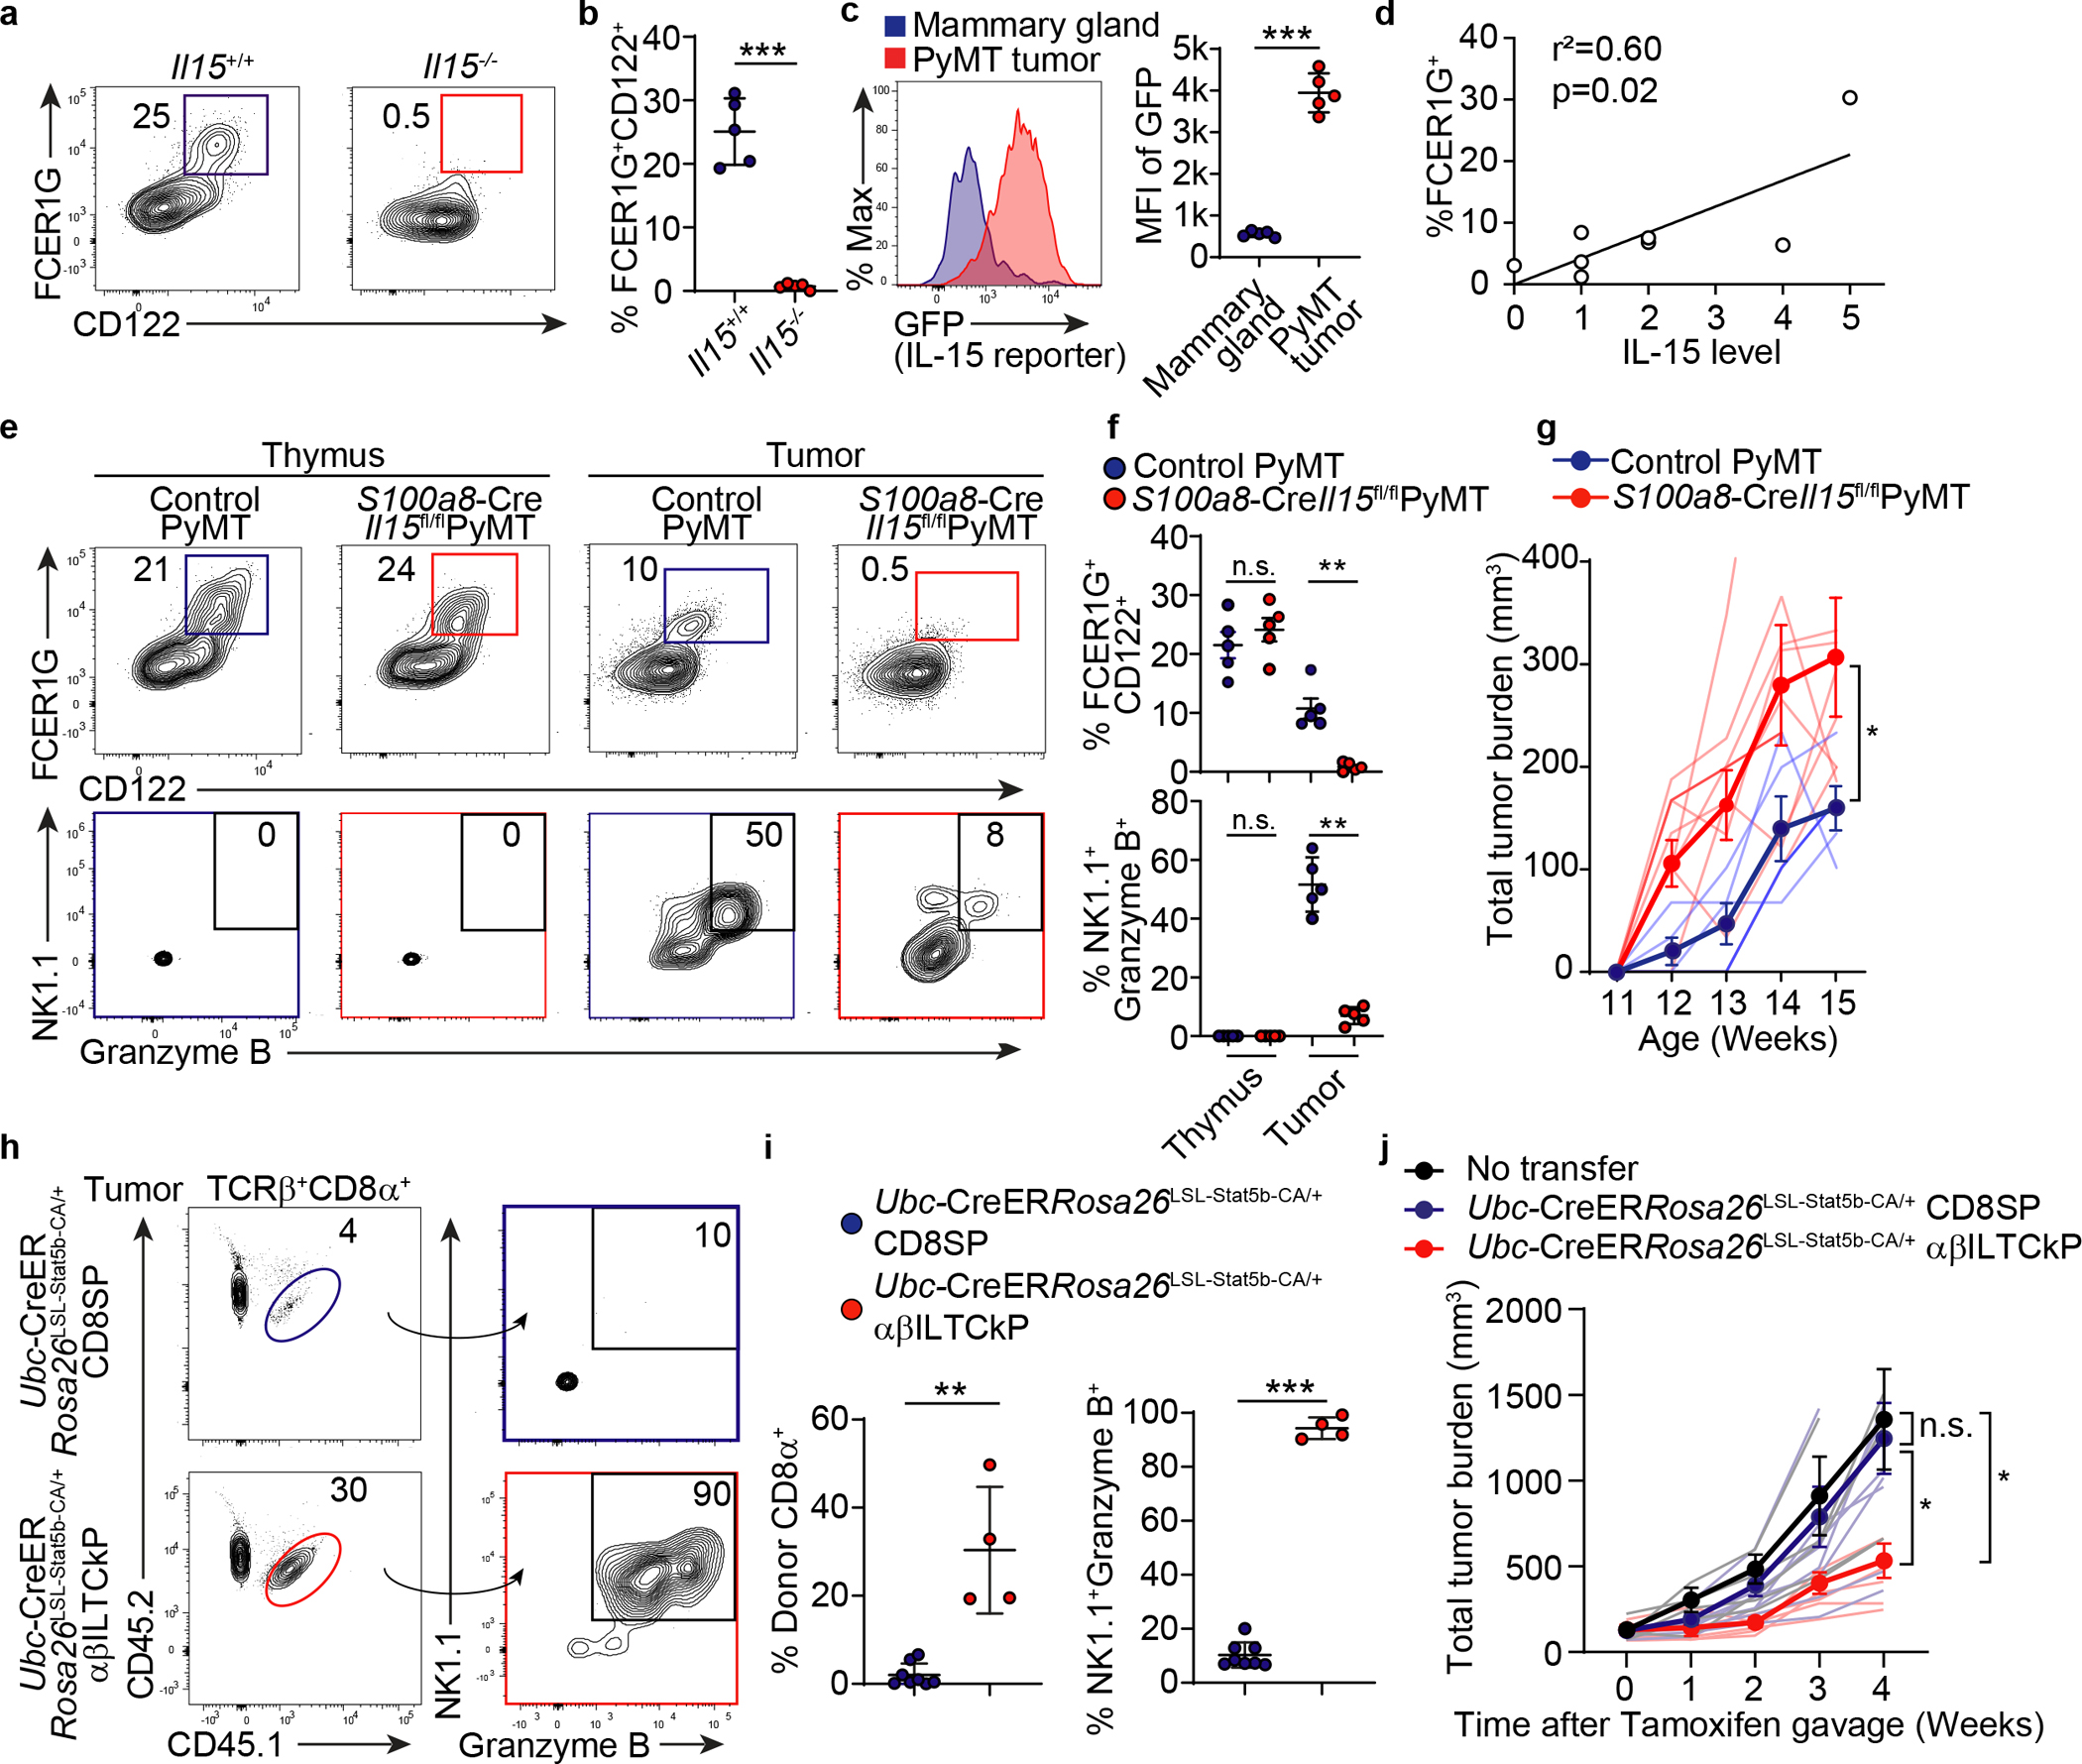
Cellular transformation induces phenotypically diverse populations of tumour-infiltrating T cells1-5, and immune checkpoint blockade therapies preferentially target T cells that recognize cancer cell neoantigens6,7. Yet, how other classes of tumour-infiltrating T cells contribute to cancer immunosurveillance remains elusive. Here, in a survey of T cells in mouse and human malignancies, we identified a population of αβ T cell receptor (TCR)-positive FCER1G-expressing innate-like T cells with high cytotoxic potential8 (ILTCKs). These cells were broadly reactive to unmutated self-antigens, arose from distinct thymic progenitors following early encounter with cognate antigens, and were continuously replenished by thymic progenitors during tumour progression. Notably, expansion and effector differentiation of intratumoural ILTCKs depended on interleukin-15 (IL-15) expression in cancer cells, and inducible activation of IL-15 signalling in adoptively transferred ILTCK progenitors suppressed tumour growth. Thus, the antigen receptor self-reactivity, unique ontogeny, and distinct cancer cell-sensing mechanism distinguish ILTCKs from conventional cytotoxic T cells, and define a new class of tumour-elicited immune response.


Conflict of interest statement

Competing Interest

MSKCC has filed a patent application regarding use of ILTCk in cancer immunotherapy. MOL is an SAB member of and holds equity or stock options in Amberstone Biosciences Inc, and META Pharmaceuticals Inc.

Figures

Extended Data Figure 1.
Extended Data Figure 1.. scRNA-seq analysis of tumor-infiltrating CD8+ T cells.
Heat map of the expression levels of selected genes in different clusters.
Extended Data Figure 2.
Extended Data Figure 2.. Distinct developmental trajectories underlie the evolutionarily conserved αβILTCk responses.
a-b, Monocle pseudotime analysis showing hypothetical developmental trajectories of indicated tumor-infiltrating CD8+ T cell subsets using recently activated cells as a starting population. c, Uniform manifold approximation and projection (UMAP) of CD45+TCRβ+CD8α+ lymphocytes isolated from breast tumor tissues of PyMT mice. d, Violin plots showing the enrichment of αβILTCk gene signature in the indicated cell clusters from PyMT mice. e, Enrichment of αβILTCk signature genes in cluster C3 from PyMT mice. f, UMAP of CD8+ T cells isolated from prostate tumor tissues of TRAMP mice. g, Enrichment of αβILTCk gene signature in the indicated cell clusters from TRAMP mice. h, Enrichment of αβILTCk signature genes in cluster C3 from TRAMP mice. i, UMAP of CD8+TCRαβ+ T cells present in a previously published human colorectal carcinoma dataset. j, Violin plots showing enrichment of αβILTCk gene signature in various cell clusters from the human colorectal carcinoma tissues. k, Enrichment of αβILTCk signature genes in cluster C3 from the human colorectal carcinoma dataset.
Extended Data Figure 3.
Extended Data Figure 3.. Recognition of cancer cell antigens by NK1.1+ αβILTCk-TCRs.
a, A representative flow plot showing the gating strategy used to isolate NK1.1+ αβILTCks and PD-1+ T cells (TCs) from PyMT mice. NK1.1+ αβILTCks are identified as CD45+TCRβ+CD8α+PD-1NK1.1+ whereas PD-1+ TCs are defined as CD45+TCRβ+CD8α+PD-1+NK1.1. b, A histogram showing the distribution of CDR3 lengths of TCRα and TCRβ pairs isolated from αβILTCks and PD-1+ TCs. Data are pooled from two independent experiments. c, Flow cytometric analysis showing the frequency of GFP+ cells among CD8+ and CD8 reporter cell line expressing indicated TCRs 24 hours after co-culturing with primary PyMT cancer cells or splenocytes pulsed with the SIINFEKL peptide (OVA257–264). Data are representative of three independent experiments. d, Frequency of GFP+ cells among CD8 reporter cell line expressing indicated NK1.1+ αβILTCk-derived TCRs 24 hours after co-culturing with primary PyMT cancer cells. n = 3 for each TCR. All statistical data are shown as mean ± S.D (biologically independent mice in a-c and independent samples in d).
Extended Data Figure 4.
Extended Data Figure 4.. The majority of αβILTCks recognize tumor-associated antigens presented in the context of classical MHC-I.
a, A representative flow plot showing the expression of classical MHC-I (H2-Kb and H2-Db) on PyMT cancer cells, defined as CD45CD31EpCAM+ from mice of indicated genotypes. Data are representative of two independent experiments. b, Frequency of GFP+ cells among CD8+ reporter cell line expressing indicated TCRs 24 hours after co-culturing with primary PyMT cancer cells doubly deficient for H2-Kb and H2-Db. Data are pooled from three independent experiments. c, Flow cytometric analysis showing the frequency of GFP+ cells among CD8+ and CD8 reporter cell line expressing the indicated TCRs 24 hours after co-culturing with primary PyMT cancer cells lacking β2m. Data are representative of two independent experiments. d, Frequency of TCRβ+CD8α+ cells among CD45+ tumor-infiltrating cells in mice lacking classical MHC-I (H2-K1−/−H2-D1−/−, n = 3), both classical and non-classical MHC-I (B2m−/−, n = 3) or control wild-type mice (n = 7). The profiles of PD-1 and NK1.1 expression by TCRβ+CD8α+ are shown in the bottom panel. e, Statistical analysis of frequency of PD-1+ T cells and αβILTCks among tumor-infiltrating CD45+ cells in mice of indicated genotypes. f, Flow cytometric analysis showing H-2Db expression on control, TAP1- or β2m-deficient PyMT cell lines generated by Cas9-mediated genome editing with small guide RNA (sgRNA). g, Expression of GFP in reporter cell lines expressing the indicated TCRs 24 hours after co-culture with control or TAP1-deficient PyMT cells lines in the presence of absence of SIINFEKL peptide. h, Frequency of GFP+ cells among TCR-expressing reporter cells after co-culture with PyMT cell lines of indicated genotypes with or without SIINFEKL peptide. Data are pooled from three independent experiments. All statistical data are shown as mean ± S.D (biologically independent mice in a,c-e and independent samples in b,f-h). **P < 0.01; ***P < 0.001 and n.s.: not significant.
Extended Data Figure 5.
Extended Data Figure 5.. Generation of CD8+ T cells with altered specificity via TCR ‘swapping.’
a-b, A schematic diagram showing the experimental design. Cas9-mediated deletion of endogenously rearranged TCR in CD8+ T cells is achieved by the introduction of three distinct TCR-loci-targeting small guide RNAs (sgRNAs) expressed from a single retrovirus. A TCR of interest is introduced into the TCR-deleted CD8+ T cells by another retrovirus. c, A timeline outlining the steps to generate CD8+ T cells with altered antigen receptor specificity. d, Representative flow plots showing the successful deletion of both the TCRα and TCRβ chains after transduction with sgRNA-expressing retrovirus. e, Flow plots showing the re-expression of surface TCR after retrovirus-mediated introduction of a TCR of interest. f, Representative flow plots showing the colonization of tumor tissues in CD45.2+ recipient mice by CD45.1+CD45.2+ donor CD8+ T cells, which have undergone the ‘swap’ procedure to express the indicated TCRs seven days post adoptive transfer. Data are representative of two independent experiments. Biologically independent mice in f and independent samples in d-e.
Extended Data Figure 6.
Extended Data Figure 6.. αβILTCk development is cDC1-independent.
a, Flow cytometric analysis of TCRβ, CD8α, PD-1, and NK1.1 expression in tumor-infiltrating CD45+ cells from Batf3−/−PyMT (n = 10) and control Batf3+/+PyMT mice (n = 13). b, Frequency of tumor-infiltrating PD-1+ T cells and αβILTCks in mice of indicated genotypes. c, Flow cytometric analysis of TCRβ, CD8α, PD-1, and NK1.1 expression in tumor-infiltrating CD45+ cells from Itgax-CreIrf8fl/flPyMT (n = 8) and control Itgax-CreIrf8+/+PyMT mice (n = 9). d, Frequency of tumor-infiltrating PD-1+ T cells and αβILTCks in mice of indicated genotypes. All statistical data are shown as mean ± S.D (biologically independent mice in a-d). Two-tailed unpaired t-test in b,d. ****P < 0.0001 and n.s.: not significant.
Extended Data Figure 7.
Extended Data Figure 7.. Recognition of thymus-derived self-antigens by αβILTCk-TCRs specifies αβILTCk lineage commitment from DP thymocytes.
a, Frequency of TCRβ+ cells among donor-derived (GFP+) tumor-infiltrating cells in ‘retrogenic’ TCR bone marrow chimeras. n = 3 for each TCR. b, Expression of PD-1 and NK1.1 by donor-derived tumor-infiltrating T cells expressing indicated αβILTCk-derived TCRs in the TCR ‘retrogenic’ bone marrow chimeras. c, Frequency of PD-1+ or NK1.1+ cells among donor-derived tumor-infiltrating cells expressing the indicated TCRs. n = 3 for each TCR. d, Expression of CD4 and CD8α by donor-derived TCRβ+ thymocytes bearing the indicated TCRs in the TCR ‘regtrogenic’ bone marrow chimeras. e, Frequency of CD4+CD8+, CD4−/dullCD8−/dull, CD4+, and CD8+ T cells among donor-derived TCRβ+ thymocytes expressing the indicated TCRs. n = 3 for TCR. f, Expression of tdTomato by splenic CD19+ cells and intratumoral PD-1+ T cells (TCs) as well as αβILTCks in Rorc-CreRosa26LSL-tdTomatoPyMT mice. Data are representative of two independent experiments. g, Frequency of tdTomato+ cells among each indicated lymphocyte compartment. n = 3. h, Expression of YFP by splenic CD19+ cells, intratumoral PD-1+ TCs as well as αβILTCks, and thymic iNKT cells in PyMT mice reconstituted with YFP bone marrow from Zbtb16-CreRosa26LSL-YFP mice. i, Frequency of YFP+ cells among indicated lymphocyte compartment. n = 4. j, Surface expression of PD-1 and CD122 on donor-derived TCRβ+ thymocytes bearing the indicated monoclonal TCR in the TCR ‘retrogenic’ bone marrow chimeras. Data are representative of three independent experiments. k, Frequency of PD-1+CD122+ T cells among donor-derived TCRβ+ thymocytes with indicated TCR. n = 3 for NK16, NK28, and NK25, n = 4 for NK186, NK22, and NK139 TCR. l, Frequency of GFP+ cells among CD8+ reporter cell line expressing indicated TCRs 24 hours after co-culturing with a cortical thymic epithelial cell line. Data are pooled from two independent experiments. m, Frequency of αβILTCk progenitors (αβILTCkPs) among donor-derived thymocytes expressing the NK139 or NK186 TCRs in B2m+/+ or B2m−/− recipient mice reconstituted with Rag1−/−B2m+/+ bone marrow cells. n = 3 for each TCR. n, Frequency of αβILTCkPs among donor-derived thymocytes in B2m+/+ or B2m−/− recipient mice reconstituted with B2m+/+ or B2m−/− bone marrow cells. n = 3 for each bone marrow chimera. All statistical data are shown as mean ± S.D (biologically independent mice in a-k and independent samples in i). Two-tailed unpaired t-test in c,e,m,n. **P < 0.01; ***P < 0.001 and n.s.: not significant.
Extended Data Figure 8.
Extended Data Figure 8.. Continuous replenishment of the intratumoral αβILTCk compartment by circulating progenitors.
a, Flow cytometric analysis of CD8α and CD8β co-receptor expression on donor-derived T cells bearing the indicated monoclonal TCR in the tumor and small intestinal (S.I.) epithelium from TCR ‘retrogenic’ bone marrow chimeras. Data are representative of three independent experiments. b, Frequency of CD8αα+ and CD8αβ+ cells among donor TCRβ+ cells in the small intestine epithelium. c, Frequency of CD8αα+ and CD8αβ+ cells among donor TCRβ+ cells in PyMT tumors. Data are pooled from three independent experiments. d, A gating strategy for isolating the putative αβILTCk-committed thymic progenitors (αβILTCkPs). αβILTCkPs are defined as CD4−/dullCD8−/dullTCRβ+CD1dCD25PD-1+CD122+NK1.1. Data are representative of three independent experiments. e, A schematic diagram showing the experimental setup to assess the differentiation potential of putative αβILTCkPs. f, Tracking the contribution of adult bone marrow hematopoiesis to various lymphocyte lineages. Fgd5-CreERRosa26LSL-tdTomatoPyMT mice were administered 5 mg of Tamoxifen via oral gavage, and lymphocytes in multiple organs were analyzed 21 weeks later for tdTomato expression. g, Flow plots showing tdTomato expression in bone marrow lineagec-Kit+Sca1+ (LSK) hematopoietic stem cells from Fgd5-CreERRosa26LSL-tdTomatoPyMT mice 21 weeks post Tamoxifen administration. n = 4. h, Flow cytometric analysis showing the expression of tdTomato in indicated thymic progenitors as gated in the left panel. i, Frequency of Fgd5-CreER-fate-mapped cells among indicated thymic progenitor populations. n = 4. j, Flow cytometric analysis showing the expression of tdTomato in PD-1+ T cells (TCs) and αβILTCk as gated in the left panel. k, Expression of tdTomato and CD8β in TCRβ+CD8α+ cells isolated from the S.I. epithelium. l, Frequency of tdTomato-expressing cells among the indicated lymphocyte populations isolated from the tumor and S.I. epithelium. n = 4. All statistical data are shown as mean ± S.D (biologically independent mice in a-d,g-l). Two-tailed unpaired t-test in b-c,l. *P < 0.05; ***P < 0.001 and n.s.: not significant.
Extended Data Figure 9.
Extended Data Figure 9.. FCER1G and CD122 co-expression identifies αβILTCks in mouse and human.
a, A scatter plot comparing the gene expression program differentiating αβILTCk-committed thymic progenitors (αβILTCkPs) from CD8 single positive T cells (SPs) (x-axis) to that distinguishing intratumoral αβILTCks from PD-1+ T cells (TCs) (y-axis). Each dot denotes a gene with the axes representing fold change of the gene expression level. b, Pathway analysis of genes upregulated in thymic αβILTCkPs but subsequently downregulated in intratumoral αβILTCks. c, A heatmap showing genes downregulated in thymic αβILTCkPs relative to their CD8 SP counterparts. d, A heatmap showing genes upregulated in thymic αβILTCkPs relative to their CD8 SP counterparts. e, Pathway analysis of genes upregulated in intratumoral αβILTCks compared to their thymic precursors. f, A heat map showing differentially expressed genes among intratumoral PD-1+ TCs, NK1.1+ and NK1.1 αβILTCks isolated from ‘retrogenic’ bone marrow chimeras generated with NK139 TCR-expressing Rag1−/− bone marrow cells. g, Uniform manifold approximation and projection (UMAP) of CD45+TCRβ+ lymphocytes in breast tumor tissues from PyMT mice showing Fcer1g-expressing cells. h, UMAP of CD45+TCRβ+ lymphocytes in prostate tumor tissues from TRAMP mice showing Fcer1g-expressing cells. i, UMAP of CD45+TCRβ+ lymphocytes present in a previously published human colorectal carcinoma dataset, showing FCER1G-expressing cells. j, Flow cytometric analysis of FCER1G and CD122 expression in CD4CD8αTCRβ+CD1d and CD8α+TCRβ+CD1d thymocytes as well as TCRβ+CD4CD1dCD8α+NK1.1+ and TCRβ+CD4CD1dCD8α+PD-1+ tumor-infiltrating cells from PyMT mice (n = 4). k, Expression levels of FCER1G and CD122 in indicated cell populations. l, Flow cytometric analysis of CD4, CD8α, and CD8β expression in FCER1G+CD122+ and FCER1GCD122 tumor-infiltrating TCRβ+CD1d cells from PyMT mice (n = 3). m, Frequency of FCER1G+CD122+ and FCER1GCD122 tumor-infiltrating TCRβ+CD1d cells expressing indicator combination of markers. n, Flow cytometric analysis of CD4 and CD8α expression by FCER1G+ and FCER1G CD45+HLA-DRTCRβ+ cells in tumor tissues from patients with colon carcinoma. o, Frequency of FCER1G+CD45+HLA-DRTCRβ+ and FCER1GCD45+HLA-DRTCRβ+ tumor-infiltrating cells expressing indicated combination of markers. Data are representative of and pooled from three patient samples. All statistical data are shown as mean ± S.D (biologically independent mice in j-m and human samples in n-o). Two-tailed unpaired t-test in k,m,o. *P < 0.05; **P < 0.01; ***P < 0.001 and n.s.: not significant.
Extended Data Figure 10.
Extended Data Figure 10.. Adoptive transfer of Stat5b-CA-armed αβILTCks deters tumor growth.
a, Immunofluorescence images showing expression of IL-15 and CDH1 in tumor tissues from patients with colon carcinoma (left panel). Flow cytometric analysis of FCER1G and PD-1 expression in TCRβ+CD4 cells from the same tumor tissue (right panel). Data are representative of two independent experiments. b, Correlation between frequency of PD-1+ cells among CD45+TCRβ+CD4 cells and IL-15 expression level in tumor tissues from patients with colon carcinoma. Each dot denotes an independent patient sample. c, Statistical analysis showing relative mRNA expression of Il15 in sorted CD45EpCAM+ cancer cells from S100a8-CreIl15fl/flPyMT (n = 3) and control PyMT mice (n = 3). d, Flow cytometric analysis of PD-1, NK1.1, and granzyme B expression in thymic αβILTCk progenitors (αβILTCkPs) one, three, or five days after culturing in the presence of 100 ng/ml IL-15/IL-15Ra complex. Data are representative of three independent experiments. e, A schematic diagram showing αβILTCk-based adoptive cellular transfer experiment. A constitutively active form of Stat5b (Stat5b-CA) was induced in thymic αβILTCkPs by tamoxifen administration one week after adoptive transfer into lymphocyte-deficient PyMT recipient mice with a total tumor burden of 300 – 400 mm3. f, Expression of Ly6G and TCRβ by tumor-infiltrating CD45+ cells. g, Statistical analysis of the frequency of donor-derived Ubc-CreERRosa26+/+ (n = 5) or Ubc-CerERRosa26LSL-Stat5b-CA/+ (n = 5) TCRβ+ cells among tumor-infiltrating CD45+ cells. h, Flow cytometric analysis of NK1.1 and granzyme B expression by donor-derived TCRβ+ cells in the tumor. i, Frequency of NK1.1+Granzyme B+ cells among transferred TCRβ+ cells. j, Total tumor burden in mice adoptively transferred with no cells or thymic αβILTCkPs of indicated genotypes. Data are pooled from three independent experiments. No transfer (n=4), Ubc-CreERRosa26+/+ (n=8), and Ubc-CreERRosa26Stat5b-CA/+ (n=7). k, A schematic diagram showing αβILTCk-based adoptive cellular transfer experiment. A constitutively active form of Stat5b (Stat5b-CA) was induced in thymic CD45.1+CD45.2+ αβILTCk progenitors or CD8 single positive T cells by tamoxifen administration one week after adoptive transfer into congenically distinct CD45.2+ PyMT recipient mice. All statistical data are shown as mean ± S.D (independent human samples in a-b, biologically independent mice in c,f-j and independent cell culture samples in d). Linear regression (b), two-tailed unpaired t-test (c,g,i) and two-way analysis of variance (ANOVA) (j) with post hoc Bonferroni t-test.. *P < 0.05; **P < 0.01; ***P < 0.001; ****P < 0.0001 and n.s.: not significant.
Figure 1.
Figure 1.. Characterization of tumor-infiltrating CD8+ T cells.
a, Uniform manifold approximation and projection (UMAP) of CD45+TCRβ+CD8α+ lymphocytes in breast tumor tissues from PyMT mice. Clusters (C) are denoted by color. b, Violin plots comparing expression of signature genes of indicated clusters. c, Three-dimensional diffusion embedding generated using clusters C1-C5 cells. d, Visualization of diffusion component (DC) analysis comparing the gene expression programs of cells from C2-C5 to that of C1 cells. e, Diffusion distance from C2-C5 cells to C1 cells. Statistical differences between the distribution of diffusion distances for each pair of clusters were calculated using a two-sided Wilcoxon test with P < 2.2e-16 between C2 and C4, C2 and C3, and C2 and C5.
Figure 2.
Figure 2.. αβILTCk differentiation diverges from conventional CD8+ T cells during thymic development in a TCR-specificity dependent manner.
a, CDR3 analysis of TCR pairs isolated from the indicated cell populations with the number of unique CDR3 analyzed for indicated cell types denoted in the middle of each pie chart. Data are pooled from three mice. b, A schematic diagram of the TCR-reporter assay. c, Frequency of GFP+ among CD8+ reporter cells expressing indicated TCRs after co-culturing with primary PyMT cancer cells. Data are pooled from three independent experiments. d, A schematic diagram showing the TCR ‘swapping’ experiment. Endogenously rearranged TCRs of naïve CD8+ T cells were substituted with indicated NK1.1+ αβILTCk-derived TCRs. Engineered cells were adoptive transferred into tumor-bearing mice and analyzed seven days later. e-f, Expression of PD-1 and NK1.1 by donor conventional CD8+ T cells engineered to express indicated NK1.1+ αβILTCk-derived TCR. n = 3 for each TCR. g, Generation of TCR ‘retrogenic’ bone marrow chimeras by reconstitution of lethally irradiated PyMT mice with a mixture of Rag1−/− Lineagec-Kit+Sca1 (LSK) cells which were transduced with retroviruses expressing the indicated NK1.1+ αβILTCk-derived TCRs and Rag1+/+ total bone marrow cells. h-i, Expression of PD-1 and NK1.1 by donor-derived tumor-infiltrating CD8+ T cells expressing indicated monoclonal or polyclonal TCRs in the TCR ‘retrogenic’ bone marrow chimeras. n = 3 for each TCR. All statistical data are shown as mean ± S.D (biologically independent mice in e-f and h-i). Two-tailed un-paired t-test (f,i). ***P < 0.001.
Figure 3.
Figure 3.. Thymocytes bearing αβILTCk-TCRs undergo ‘agonist’ selection, and continually repopulate tumor.
a-b, Expression of CD4 and CD8α by donor-derived TCRβ+ thymocytes bearing the indicated monoclonal or polyclonal TCRs in the TCR ‘retrogenic’ bone marrow chimeras. c, Frequency of donor αβILTCk progenitor-derived cells, identified as CD45.1+TCRβ+ present in the tumor and small intestinal (S.I.) epithelium from CD45.2+ Rag1−/− (n = 3) or Rag1+/− PyMT recipient mice (n = 3). The bottom panel shows the expression pattern of PD-1 and NK1.1 on CD45.1+TCRβ+ donor cells. d, Statistical analysis of the contribution of donor αβILTCk progenitors to the tumor αβILTCk and SI IEL compartments in indicated recipient mice. All statistical data are shown as mean ± S.D (biologically independent mice in a-d). Two-tailed un-paired t-test (b, d). ***P < 0.001 and n.s.: not significant.
Figure 4.
Figure 4.. FCER1G expression marks cells of the αβILTCk-lineage.
a-b, Flow cytometric analysis of FCER1G, CD122, CD4, CD8α, CD8β, PD-1, NK1.1, and granzyme B expression in TCRβ+CD1dNK1.1 thymocytes and TCRβ+CD4CD1d tumor-infiltrating T cells from PyMT mice (n = 3). Frequency of thymic FCER1G+CD122+ αβILTCk progenitor (αβILTCkP), intratumoral αβILTCk, thymic CD8 single positive (CD8SP), and intratumoral CD8αβ+ T cells expressing indicated combination of markers are plotted. c-d, Expression of FCER1G and PD-1 by CD45+TCRβ+CD4 cells in tumor tissues or adjacent normal colon from patients with colon carcinoma (n = 8). e, Granzyme B expression in FCER1G+TCRβ+ and PD-1+TCRβ+CD4 cells in tumor tissues from patients with colon carcinoma (n = 8). All statistical data are shown as mean ± S.D (biologically independent mice in a-b and human samples in c-e). Two-tailed un-paired (b) and paired t-test (d-e). *P < 0.05; **P < 0.01; ***P < 0.001 and ****P < 0.0001.
Figure 5.
Figure 5.. αβILTCks sense cancer cell-expressed IL-15, and inducible hyperactivation of IL-15 signaling in αβILTCks suppresses tumor growth.
a-b, Flow cytometric analysis of FCER1G and CD122 expression in TCRβ+CD1dNK1.1CD4CD8α thymocytes from Il15−/− (n = 5) and Il15+/+ (n = 5) mice. c, GFP expression by CD45EpCAM+ cells from IL-15-GFP reporter control (n = 5) and PyMT mice (n = 5). d, Correlation between frequency of FCER1G+ cells among CD45+TCRβ+CD4 cells and IL-15 expression level in tumor tissues from colon carcinoma patients. e-f, Flow cytometric analysis of FCER1G and CD122 expression in TCRβ+CD1dNK1.1CD4CD8α thymocytes and CD45+TCRβ+CD4 tumor-infiltrating cells from S100a8-CreIl15fl/flPyMT (n = 5) or control PyMT (n = 5) mice. Bottom panel shows expression of NK1.1 and granzyme B in FCER1G+CD122+ cells. g, Tumor burden in mice of indicated genotypes. Control PyMT (n = 4) and S100a8-CreIl15fl/flPyMT (n = 8). h-i, Flow cytometric analysis of adoptively transferred CD45.1+CD45.2+ αβILTCk progenitors (αβILTCkP, n = 4) or CD8 single positive T cells (CD8SP, n = 8) cells among TCRβ+CD8α+ tumor-infiltrating cells and NK1.1 as well as granzyme B expression in donor cells. j, Tumor burden in mice adoptively transferred with no cells (n = 5), Ubc-CreERRosa26LSL-Stat5b-CA/+ thymic CD8SPs (n = 8) or αβILTCkPs (n = 5). All statistical data are shown as mean ± S.D (biologically independent mice in a-c, e-g, h-j). Two-tailed un-paired t-test (b-c,f,i), linear regression (d) and two-way analysis of variance (ANOVA) (g,j) with post hoc Bonferroni t-test. *P < 0.05; **P < 0.01; ***P < 0.001 and n.s.: not significant.

Comment in

References

    1. Zheng C et al. Landscape of Infiltrating T Cells in Liver Cancer Revealed by Single-Cell Sequencing. Cell 169, 1342–1356 e1316 (2017). - PubMed
    1. Azizi E et al. Single-Cell Map of Diverse Immune Phenotypes in the Breast Tumor Microenvironment. Cell 174, 1293–1308 e1236 (2018). - PMC - PubMed
    1. Simoni Y et al. Bystander CD8(+) T cells are abundant and phenotypically distinct in human tumour infiltrates. Nature 557, 575–579 (2018). - PubMed
    1. Zhang L et al. Lineage tracking reveals dynamic relationships of T cells in colorectal cancer. Nature 564, 268–272 (2018). - PubMed
    1. Zheng L et al. Pan-cancer single-cell landscape of tumor-infiltrating T cells. Science 374, abe6474 (2021). - PubMed