. 2022 Apr;604(7907):749-756.
doi: 10.1038/s41586-022-04638-9. Epub 2022 Apr 20.

CCNE1 amplification is synthetic lethal with PKMYT1 kinase inhibition

Affiliations

CCNE1 amplification is synthetic lethal with PKMYT1 kinase inhibition

David Gallo et al. Nature. 2022 Apr.

Abstract

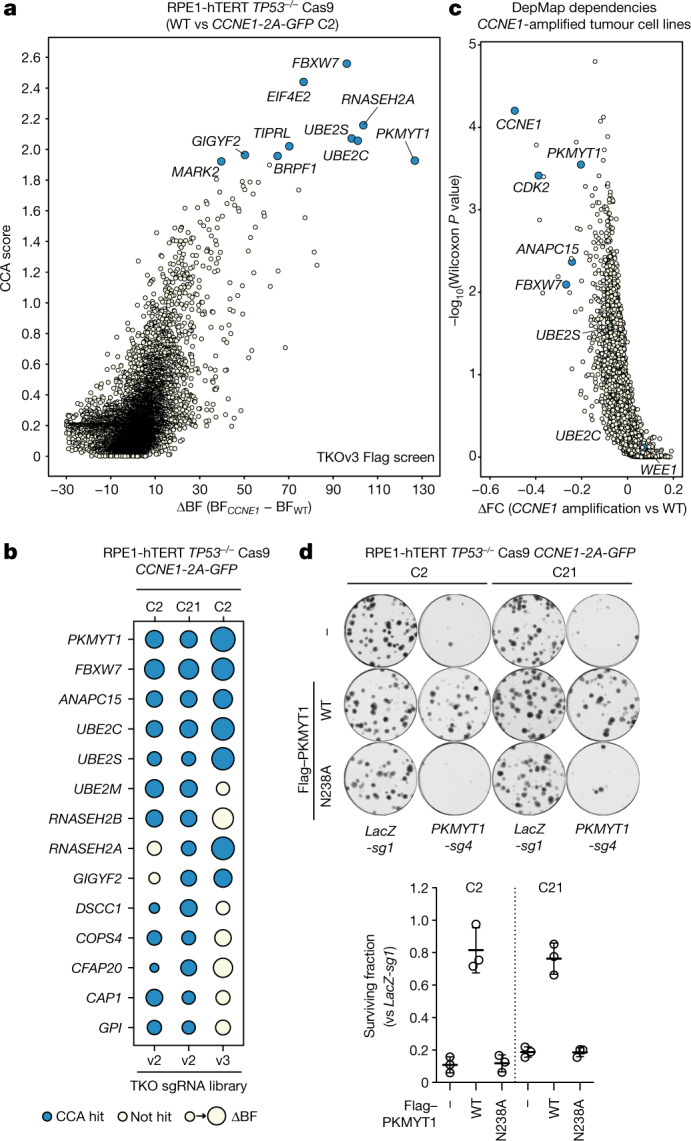
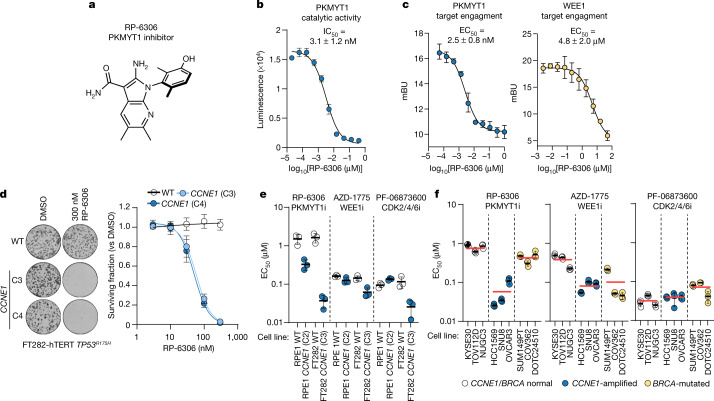
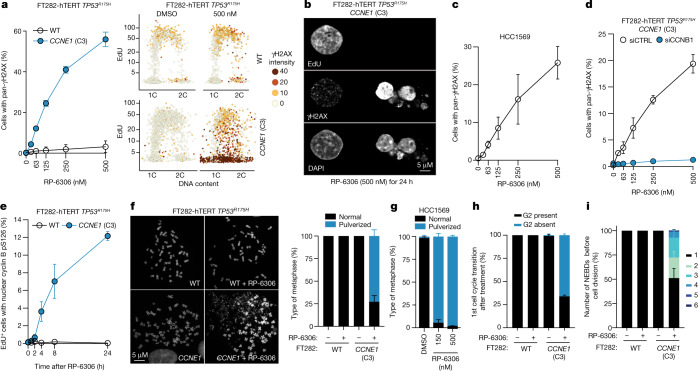
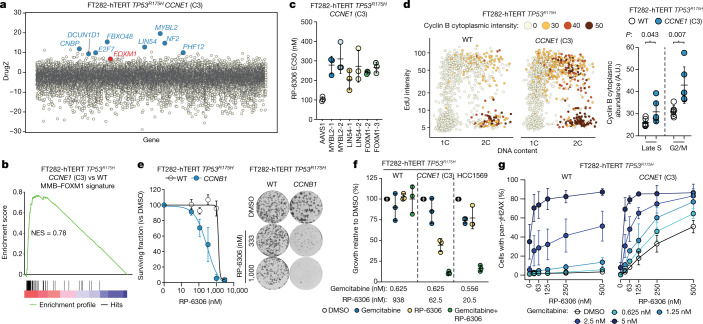
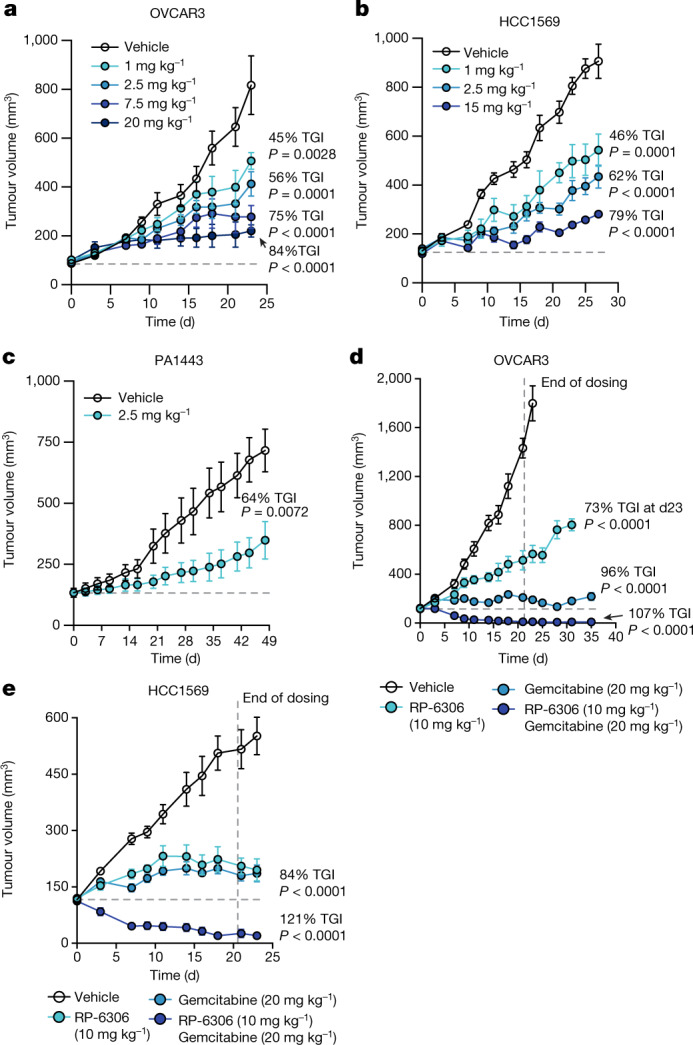
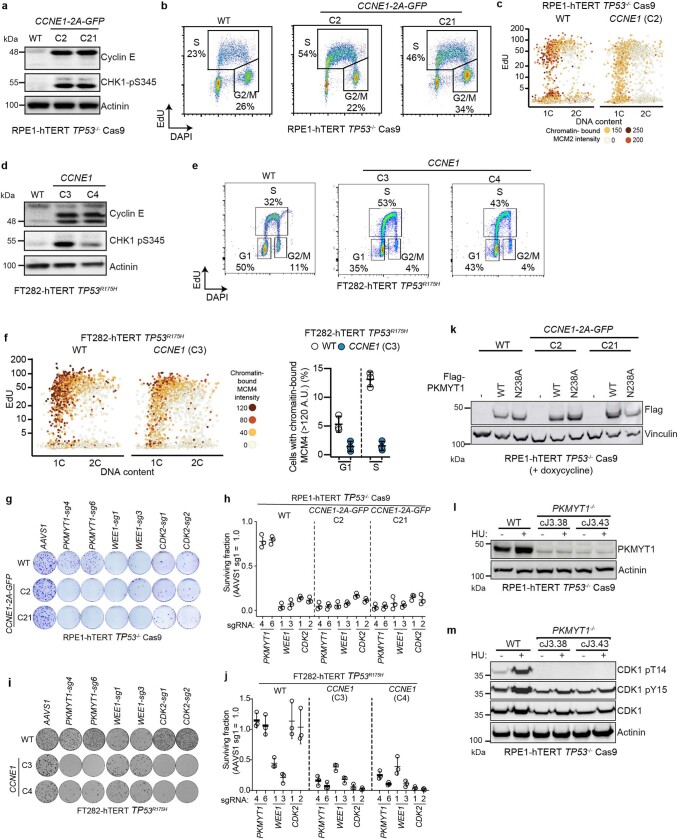
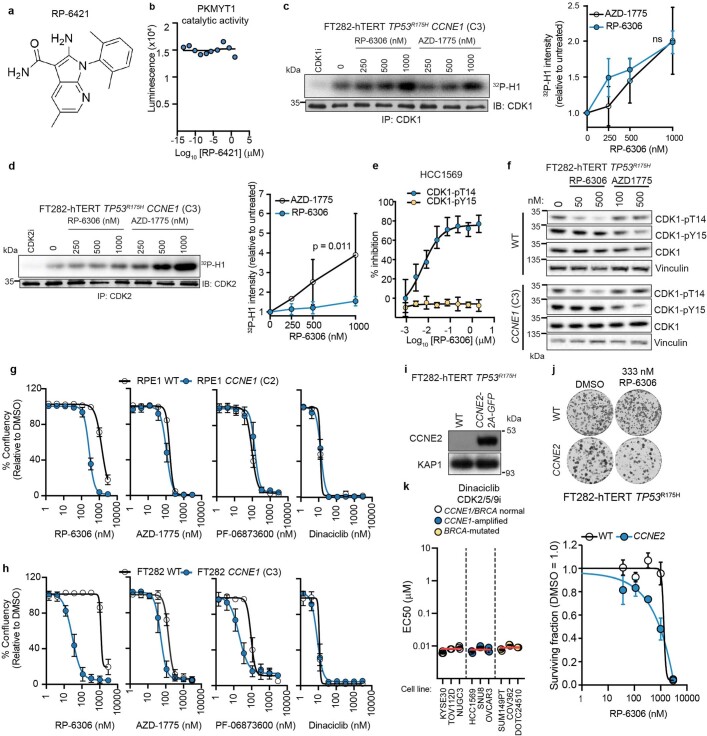
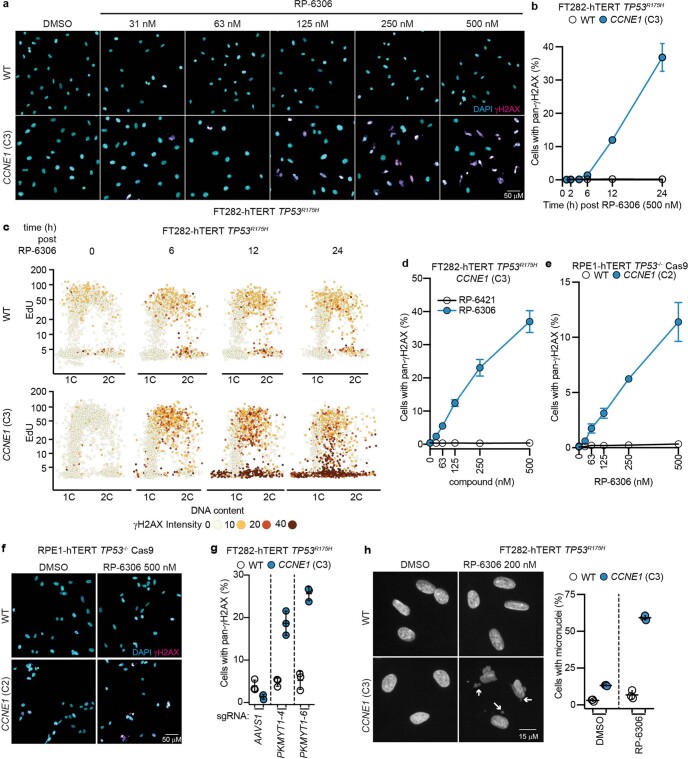
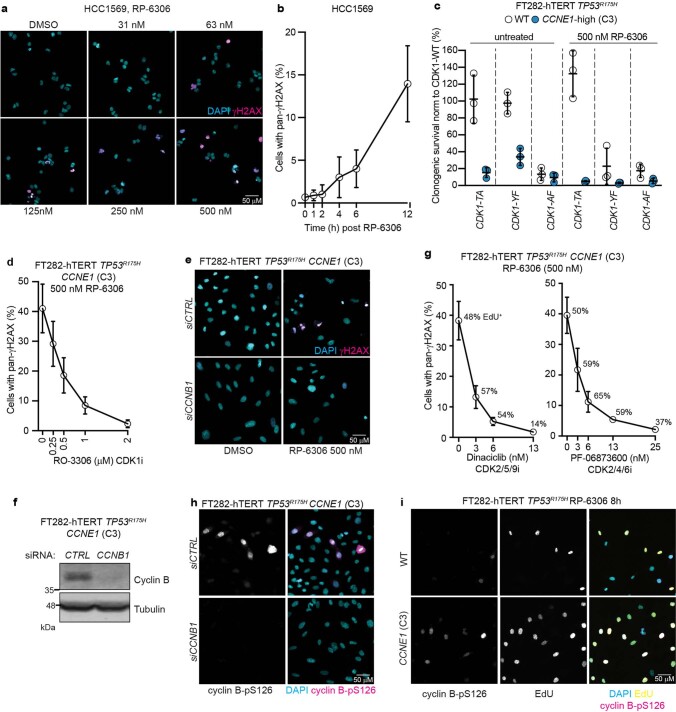
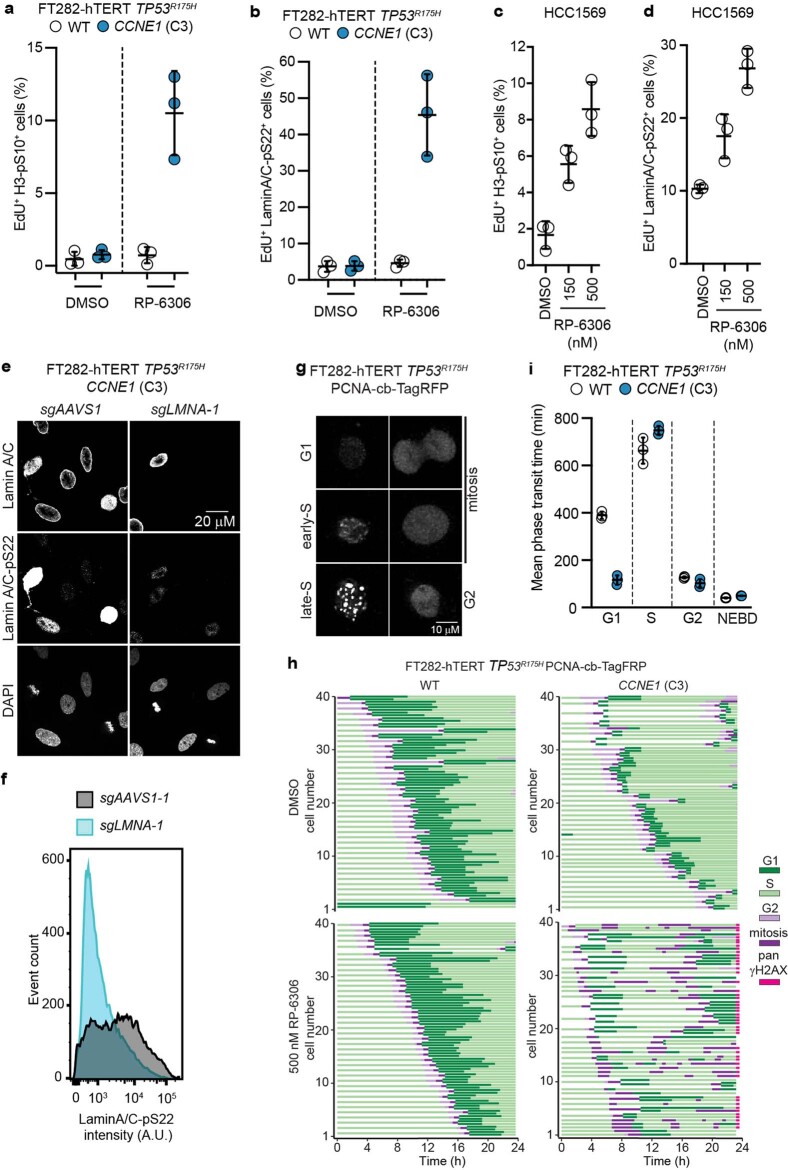
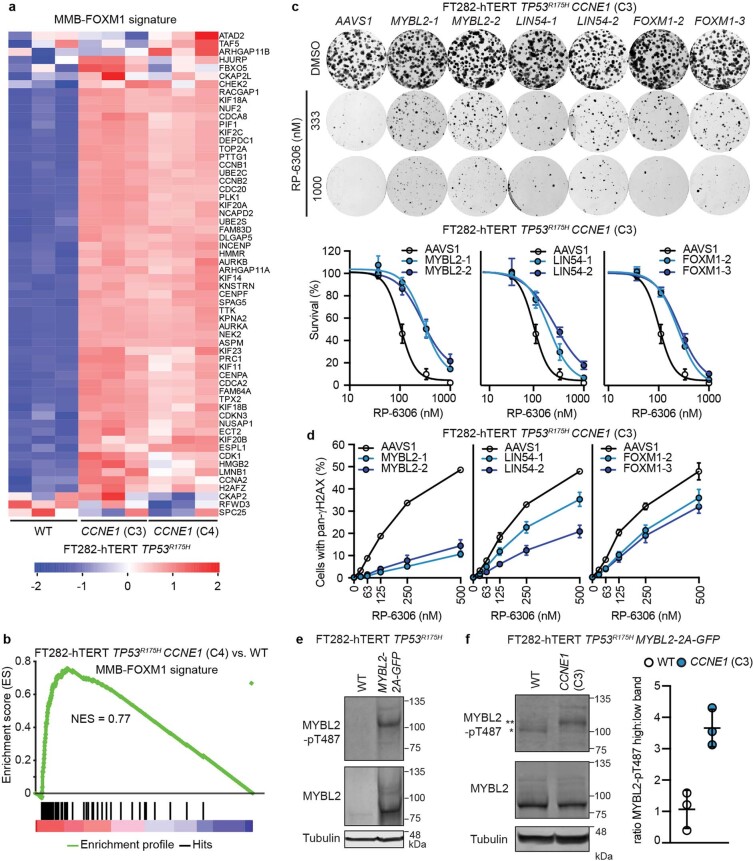
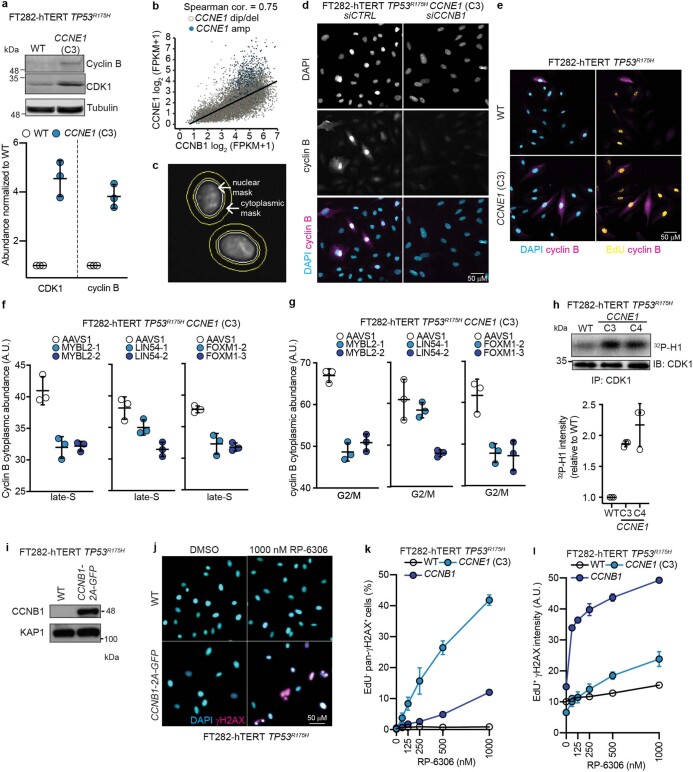
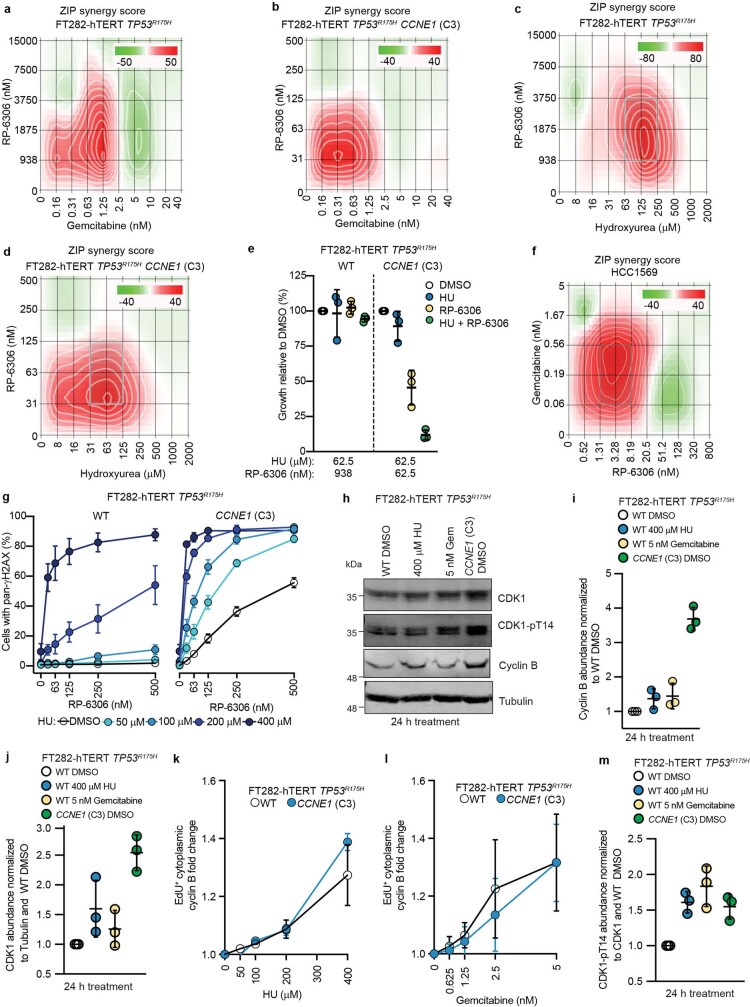
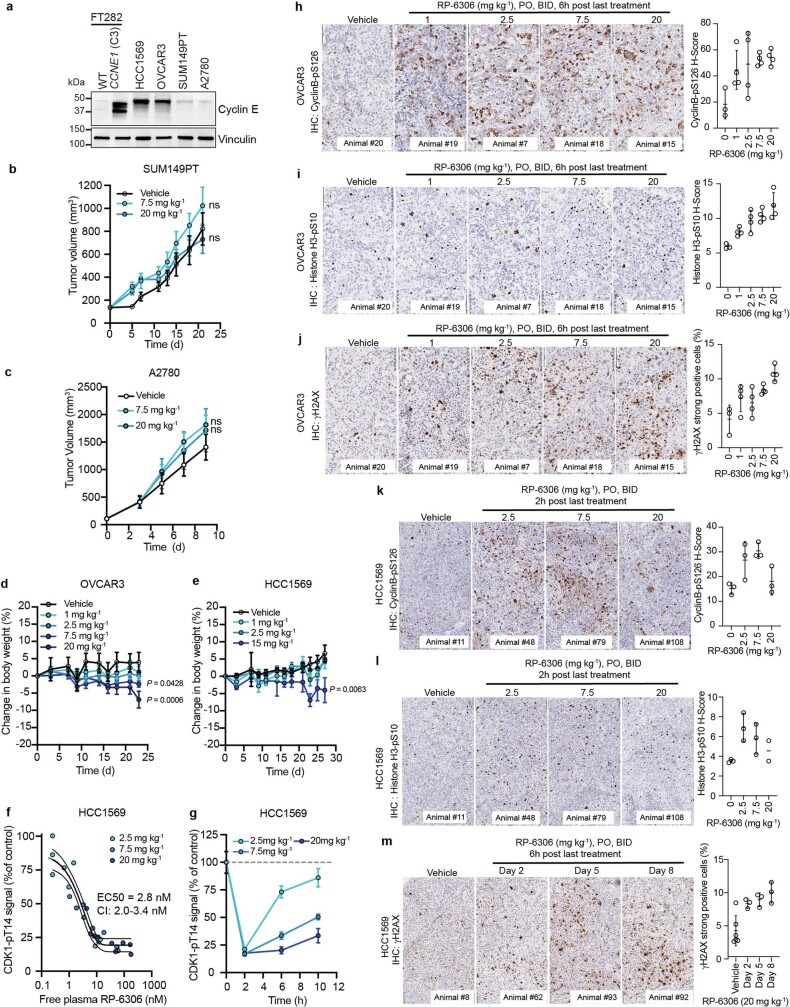
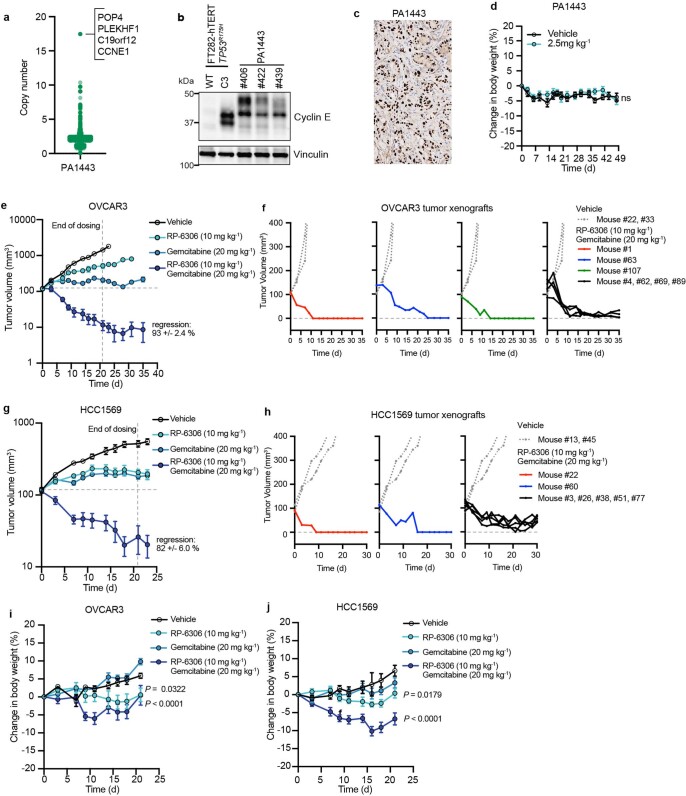
Amplification of the CCNE1 locus on chromosome 19q12 is prevalent in multiple tumour types, particularly in high-grade serous ovarian cancer, uterine tumours and gastro-oesophageal cancers, where high cyclin E levels are associated with genome instability, whole-genome doubling and resistance to cytotoxic and targeted therapies1-4. To uncover therapeutic targets for tumours with CCNE1 amplification, we undertook genome-scale CRISPR-Cas9-based synthetic lethality screens in cellular models of CCNE1 amplification. Here we report that increasing CCNE1 dosage engenders a vulnerability to the inhibition of the PKMYT1 kinase, a negative regulator of CDK1. To inhibit PKMYT1, we developed RP-6306, an orally bioavailable and selective inhibitor that shows single-agent activity and durable tumour regressions when combined with gemcitabine in models of CCNE1 amplification. RP-6306 treatment causes unscheduled activation of CDK1 selectively in CCNE1-overexpressing cells, promoting early mitosis in cells undergoing DNA synthesis. CCNE1 overexpression disrupts CDK1 homeostasis at least in part through an early activation of the MMB-FOXM1 mitotic transcriptional program. We conclude that PKMYT1 inhibition is a promising therapeutic strategy for CCNE1-amplified cancers.


Conflict of interest statement

D.D. is a shareholder, advisor and received research funding from Repare Therapeutics. D.G., J.T.F.Y., J.F., A.A.-Q., C.B., N.M.D., R.P., A.R., R.S., J.S., A.V., P.S.B., A.B.F., J.B., J.D., E.D., S.F., T.G.d.R., M.-E.L., B.L., V.B., Y.M., O.N., S.Y.Y., S.J.M., M.Z. and C.G.M. are, and G.M., H.A., C.F.-D. and A.S. were, employees of Repare Therapeutics. J.S., B.L., E.D. and R.P. have filed a patent application claiming the discovery of PKMYT1 inhibitors (WO/2021/195781) and D.D., J.T.F.Y., J.S., B.L., E.D., R.P., A.V. and J.F. have filed a patent application claiming methods of use of PKMYT1 inhibitors (WO/2021/195782). N.C., H.M., R.K.S. and J.T. declare no competing interest.

Figures

Fig. 1
Fig. 1. PKMYT1 is synthetic lethal in combination with CCNE1 overexpression.
a, Results of a CRISPR-based synthetic lethal screen in RPE1-hTERT TP53−/− Cas9 CCNE1-2A-GFP (C2) cells with CCA and ΔBF scores plotted. b, Dot plot of the synthetic lethal hits from three screens. The size of the dots is proportional to the ΔBF score and blue indicates a hit using CCA (Jenks ranks > 2). c, Volcano plot of gene dependencies in cancer cell lines from the DepMap project grouped according to their CCNE1 amplification status. d, Clonogenic survival assays of the indicated RPE1-hTERT TP53−/− Cas9 cell lines transduced with lentivirus expressing sgRNA targeting LacZ (LacZ-sg1) or PKMYT1 (PKMYT1-sg4) or doxycycline-inducible sgRNA-resistant Flag alone (−), Flag–PKMYT1 or Flag-PKMYT1N238A. Top, representative images of plates stained with crystal violet. Bottom, quantification of clonogenic survival assays. Data are mean ± s.d. (n = 3). Source data
Fig. 2
Fig. 2. RP-6306 is a selective PKMYT1 inhibitor with activity in CCNE1-amplified cells.
a, Chemical structure of the PKMYT1 inhibitor RP-6306. b, Dose–response of PKMYT1 catalytic activity to RP-6306 as measured with the ADP-Glo kinase assay. Data are mean ± s.d. (n = 3). c, Target engagement of RP-6306 on PKMYT1 (left) and WEE1 (right) in a NanoBRET assay reported in milliBRET units (mBU). Data are mean ± s.d. (n = 3). d, Clonogenic survival of the indicated FT282-hTERT TP53R175H derivatives treated with RP-6306. Left, representative images of plates stained with crystal violet. Right, quantification of clonogenic survival assays. Data are mean ± s.d. (n = 3). e, f, EC50 determination for growth inhibition for the parental and CCNE1-high cells in the RPE1-hTERT TP53−/− Cas9 (RPE1) and FT282-hTERT TP53R175H (FT282) backgrounds (e) and indicated cancer cell lines (f) treated with the indicated compounds. Growth was monitored with an Incucyte live-cell imager for up to six population doublings. Data are mean ± s.d. (n = 3). Additional data are presented in Extended Data Fig. 2g, h. In f, cell lines are also grouped according to their CCNE1 or BRCA status and the red bar indicates the mean of each grouping. Source data
Fig. 3
Fig. 3. PKMYT1 inhibition causes unscheduled CDK1 activation and mitotic entry in CCNE1-high cells.
a, QIBC analysis of γH2AX nuclear intensity, EdU incorporation and DNA content (measured with DAPI) in FT282-hTERT TP53R175H cell lines. Representative QIBC (right) and quantification (left) of cells with pan-γH2AX. b, Representative micrograph showing EdU staining, γH2AX localization and nuclear morphology of FT282 CCNE1-high cells. Representative of n = 3 experiments. c, QIBC quantification of HCC1569 cells with pan-γH2AX as a function of RP-6306 dose. d, Quantification of FT282-hTERT TP53R175H CCNE1-high cells transfected with siRNAs targeting cyclin B1 (siCCNB1) or non-targeting siRNA (siCTRL) with pan-γH2AX as a function of RP-6306 dose. e, QIBC quantification of FT282-hTERT TP53R175H cells of the indicated genotype positive for EdU and cyclin B (CCNB1) pS126 as a function of RP-6306 dose. f, g, RP-6306 induces chromosome pulverization. Representative micrographs of metaphase spreads of FT282 parental (WT) and CCNE1-high cells left untreated or following treatment with either RP-6306 (500 nM) for 24 h (f, left) and quantification of FT282 cells (f, right) and HCC1569 cells (g) with pulverized chromosomes with at least 40 metaphases counted per replicate. h, i, Quantification of the first observed G2 phase (h) and the number of nuclear envelope breakdowns (NEBDs) before the first observed cell division (i) using time-lapse imaging of FT282-hTERT TP53R175H PCNA–chromobody–TagRFP (WT) and CCNE1-high (CCNE1) cells treated with DMSO or RP-6306 (500 nM) for 23 h. QIBC validation is shown in Extended Data Figs. 3a, 4a, e, f, h, i. Data in a, ci are mean ± s.d. (n = 3). Source data
Fig. 4
Fig. 4. Replication stress and FOXM1–MMB activity underlie vulnerability to PKMYT1 inhibition.
a, RP-6306 resistance screen for dose required to kill 80% of cells (LD80) performed in FT282-hTERT TP53R175H CCNE1 (C3 and C4) with DrugZ scores for C3 plotted. Genes with DrugZ > 9 in both C3 and C4 screens (blue) and FOXM1 (red) are shown for reference. b, Gene set enrichment analysis (GSEA) of differential gene expression in FT282 parental (WT) versus CCNE1-high (C3) cells for genes co-regulated by MMB–FOXM1. c, EC50 values for RP-6306 in CCNE1-high FT282-hTERT TP53R175H cells nucleofected with Cas9 ribonucleoproteins assembled with the indicated sgRNAs. Growth was monitored by clonogenic survival assay. d, QIBC analysis of cyclin B cytoplasmic intensity, EdU incorporation and DNA content (measured with DAPI). Representative QIBC plots (left) and cytoplasmic cyclin B intensity (right) quantification in late S or G2/M. P values determined by two-tailed t-test. e, Clonogenic survival of FT282-hTERT TP53R175H CCNB1-2A-GFP and wild-type parental cells treated with RP-6306. Quantification (left) and representative images of plates stained with crystal violet (right). f, Growth inhibition relative to DMSO control of parental (WT) and CCNE1-high FT282-hTERT TP53R175H cells and HCC1569 cells after the indicated treatments. Growth was monitored with an Incucyte live-cell imager for up to six population doublings. g, QIBC quantification of cells with pan-γH2AX in response to the indicated RP-6306–gemcitabine combinations. Data in cg are mean ± s.d. (n = 3). Source data
Fig. 5
Fig. 5. RP-6306 shows single-agent anti-tumour activity and profound tumour regressions in combination with gemcitabine.
a, b, Growth of OVCAR3 (a) and HCC1569 (b) xenografts in CB-17 SCID and SCID-beige mice treated with either RP-6306 or vehicle. RP-6306 was administered orally twice daily at the indicated doses for the duration of the experiment. Results are expressed as mean tumour volume ± s.e.m. (OVCAR3 n = 8 (vehicle), 7 (1 mg kg−1), 8 (2.5 mg kg−1), 7 (7.5 mg kg−1), 8 (20 mg kg−1); HCC1569 n = 8 (vehicle),7 (1 mg kg−1), 8 (2.5 mg kg−1), 6 (15 mg kg−1)). Percentage tumour growth inhibition (% TGI) and P values relative to vehicle as determined by one-way ANOVA are shown. c, Tumour growth of a CCNE1-amplified pancreatic cancer (PA1443) patient-derived xenograft implanted in BALB/c nude mice treated either with RP-6306 or vehicle. RP-6306 was administered orally twice daily at 2.5 mg kg−1 for the duration of the experiment. Results are expressed as mean tumour volume ± s.e.m. (n = 8) with % TGI and P value relative to vehicle as determined by unpaired one-sided t-test. d, e, Tumour growth of OVCAR3 (d) and HCC1569 (e) xenografts in mice treated with either RP-6306, gemcitabine or both. Gemcitabine was administered once weekly intraperitoneally starting at day 0 and RP-6306 was given oral twice daily for 21 days after which all treatments were stopped, and tumour size was monitored for the remainder of the experiment. Results are expressed as tumour volume mean ± s.e.m. (OVCAR3 n = 7 (vehicle), 6 (10 mg kg−1 RP-6306), 7 (20 mg kg−1 gemcitabine), 7 (10 mg kg−1 RP-6306 + 20 mg kg−1 gemcitabine); HCC1569 n = 7 (vehicle), 7 (10 mg kg−1 RP-6306), 7 (20 mg kg−1 gemcitabine), 7 (10 mg kg−1 RP-6306 + 20 mg kg−1 gemcitabine)). % TGI and P values relative to vehicle as determined by one-way ANOVA are shown. Source data
Extended Data Fig. 1
Extended Data Fig. 1. Characterization of CCNE1-high isogenic cell lines and validation of PKMYT1 synthetic lethality.
a,d, Whole cell lysates of RPE1-hTERT TP53-/- Cas9 CCNE1-2A-GFP (a) and FT282-hTERT TP53R175H (d) CCNE1-high and parental (WT) cells were immunoblotted with cyclin E, CHK1-pS345 and actinin specific antibodies. b, FACS analysis of RPE1-hTERT TP53-/- Cas9 CCNE1-high and parental (WT) cells for EdU incorporation and DNA content (DAPI). Percentage of each population gated for EdU+ (S) and EdU- 2C (G2/M) are indicated. c. QIBC analysis of RPE1-hTERT TP53-/- Cas9 CCNE1-high and parental cells for chromatin-bound MCM2 nuclear intensity, EdU incorporation and DNA content (DAPI). e, FACS analysis FT282-hTERT TP53R175H CCNE1-high and parental (WT) cells for EdU incorporation and DNA content (DAPI). Percentage of each population gated for EdU- 1C (G1), EdU+ (S) and EdU- 2C (G2/M) are indicated. f, Left, QIBC analysis of FT282-hTERT TP53R175H CCNE1-high and parental cells for chromatin-bound MCM4 nuclear intensity, EdU incorporation and DNA content (DAPI). Right, quantitation of EdU- 1C (G1) and EdU+ (S) nuclei with chromatin-bound MCM4 (A.U. > 120). Data are shown as mean ± s.d. (n = 3). g–j, Clonogenic survival assays of (g,h) the indicated RPE1-hTERTTP53-/- Cas9 cell lines transduced with lentivirus expressing the indicated sgRNAs and (i,j) the indicated FT282-hTERT TP53R175H cell lines nucleofected with Cas9 ribonucleoproteins assembled with the indicated sgRNAs. Shown in (g,i) are representative plates with colonies stained with crystal violet. Quantitation is shown in (h, j). Data are shown as mean ± s.d. (n = 3). k, Whole cell lysates of RPE1-hTERT TP53-/- Cas9 CCNE1-high and parental cells expressing doxycycline-inducible sgRNA-resistant Flag alone (-), Flag-PKMYT1 or Flag-PKMYT1N238A were immunoblotted with Flag and actinin antibodies. l, m, Whole cell lysates of RPE1-hTERT TP53−/− Cas9 parental and two independent PKMYT1-/- clones either untreated or treated for 24 h with 3 mM hydroxyurea (HU) were immunoblotted for PKMYT1 (l) and either total CDK1, CDK1-pT14 or CDK-pY15 (m). Actinin was used as loading control. For gel source data, see Supplementary Fig. 1. Source data
Extended Data Fig. 2
Extended Data Fig. 2. Development of RP-6306 and comparison of PKMYT1i, WEEi and CDK2i.
a, Chemical structure of RP-6421, an analog of RP-6306 b, Dose-response of RP-6421 on PKMYT1 catalytic activity as measured with ADP-Glo kinase assay. c, d, Cell culture of FT282-hTERTTP53R175H CCNE1-high cells were treated with the indicated doses of RP-6306 and AZD-1775 for 24 h. Left, cellular extracts were prepared and immunoprecipitated (IP) with agarose-coupled CDK1 (c) or CDK2 (d) antibodies. Immunoprecipitates were subjected to in vitro kinase assays using [γ32P]-ATP and recombinant histone H1 as a substrate. Reactions were resolved by SDS-PAGE and gels were imaged using a phosphor screen. A sample of each immunoprecipitate was immunoblotted (IB) with CDK1 or CDK2 antibodies. CDK1i (RO-3306) or CDK2i (PF-06873600) was added to indicated in vitro reactions. Right, quantitation 32P-H1 band intensity. Data are shown as mean ± s.d. (n = 3) and P value was determined by one-sided sum-of-squares f-test. e, HCC1569 cells were treated with the indicated doses of RP-6306 for 2 h and subjected to the AlphaLISA assay using CDK1-pT14, CDK1-pY15 and total CDK1 antibodies. Data are shown as mean ± s.d. (n = 3). f, FT282-hTERT TP53R175H parental and CCNE1-high cells were treated with the indicated doses of RP-6306 and AZD-1775 for 4 h. Whole cell lysates were prepared and immunoblotted with antibodies against CDK1-pT14, CDK1-pY15, CDK1 and vinculin as a loading contol. Representative of two immunoblots. g,h,k, EC50 determination for growth inhibition for the parental and CCNE1-high cells in the (g) RPE1-hTERT TP53 −/− Cas9 (RPE1) (h) FT282 TP53R175H (FT282) and (k) indicated cancer cell lines treated with the indicated compounds. Growth was monitored with an Incucyte for up to 6 population doublings. Data are shown as mean ± s.d. (n = 3). In (k) cell lines are also grouped according to their CCNE1 or BRCA status and the red bar indicates the mean of each grouping. i, Whole cell lysates of FT282-hTERT TP53R175H parental and CCNE2-2A-GFP expressing cells were immunoblotted with cyclin E2 and KAP1 specific antibodies. Representative of two immunoblots. j, Clonogenic survival of FT282-hTERT TP53R175H CCNE2-2A-GFP (CCNE2) and WT parental cells treated with RP-6306. Shown on top are representative images of plates stained with crystal violet and bottom is the quantitation. Data are shown as mean ± s.d. (n = 3). For gel source data, see Supplementary Fig. 1. Source data
Extended Data Fig. 3
Extended Data Fig. 3. RP-6306 induces DNA damage specifically in CCNE1-high cells.
a, Representative QIBC micrographs of FT282-hTERT TP53R175H (WT) and CCNE1-high (CCNE1) cells treated either with DMSO or increasing doses of RP-6306. The DAPI (cyan) and γH2AX (magenta) channels are merged. b, c, QIBC analysis of γH2AX nuclear intensity, EdU incorporation and DNA content (DAPI) with the quantitation of cells with pan-γH2AX as a function of time after addition of RP-6306 (500 nM) shown in (b) and representative QIBC plots shown in (c). Data are shown as mean ± s.d. (n = 3). d, QIBC quantitation of FT282-hTERT TP53R175H CCNE1-high cells with pan-γH2AX as a function of RP-6306 and RP-6421 dose. Data are shown as mean ± s.d. (n = 3). e, f, QIBC analysis of γH2AX nuclear intensity of RPE1-hTERT TP53-/- Cas9 parental (WT) and CCNE1-2A-GFP (CCNE1) cells. Quantitation of cells with pan-γH2AX as a function of RP-6306 dose is shown in (e) and representative micrographs of cells treated with DMSO or 500 nM RP-6306 with the DAPI (cyan) and γH2AX (magenta) channels merged shown in (f). Data are shown as mean ± s.d. (n = 3). g, QIBC Quantitation of cells with pan-γH2AX after transduction with lentivirus expressing the indicated sgRNAs. h, RP-6306 induces micronucleation in FT282 CCNE1-high cells. Left, representative micrographs of cells with micronuclei (white arrows) in FT282 parental and CCNE1-high cells following treatment with either DMSO or RP-6306 (200 nM) for 72 h. Right, quantitation of cells with micronuclei. Data are shown as mean ± s.d. (n = 3). Source data
Extended Data Fig. 4
Extended Data Fig. 4. RP-6306 activates cyclin B-CDK1.
a, Representative QIBC micrographs of HCC1569 cells treated with increasing doses of RP-6306. The DAPI (cyan) and γH2AX (magenta) channels are merged. b, QIBC quantitation of pan-γH2AX staining as a function of time after addition of RP-6306 (500 nM) in HCC1569 cells. Data are shown as mean ± s.d. (n = 3). c, Clonogenic survival assays of the indicated FT282-hTERT TP53R175H Cas9 cell lines transduced with lentivirus expressing CDK1-T14A-GFP, CDK1-Y15F-GFP or CDK1-T14A/Y15F-GFP relative to WT CDK1-GFP. Data are shown as mean ± s.d. (n = 3). d, QIBC quantitation of pan-γH2AX staining in FT282-hTERT TP53R175H CCNE1 cells treated with RP-6306 (500 nM) as a function of CDK1 inhibitor RO-3306 dose. Data are shown as mean ± s.d. (n = 3). e, f, FT282-hTERT TP53R175H CCNE1 cells transfected with either non-targeting siRNA (siCTRL) or siRNA targeting cyclin B (siCCNB1) were treated with RP-6306 (500 nM). Representative QIBC micrographs with DAPI (cyan) and γH2AX (magenta) channels merged are shown in (e). Immunoblot analysis of cyclin B levels in lysates prepared from DMSO-treated cells is shown in (f). Tubulin was used as a loading control and are representative of three immunoblots g, QIBC quantitation of pan-γH2AX staining in FT282-hTERT TP53R175H CCNE1 treated with RP-6306 (500 nM) as a function of the dose of dinaciclib or (left) PF-06873600 (right). Data are shown as mean ± s.d. (n = 3). h, Representative QIBC micrographs of FT282-hTERT TP53R175H (WT) and CCNE1-high (CCNE1) cells transfected with the indicated siRNA and stained with DAPI (cyan) and cyclin B-pS126 antibody (magenta). The channels are merged and image represents one replicate. i, Representative QIBC micrographs of FT282-hTERT TP53R175H (WT) and CCNE1-high (CCNE1) cells treated with RP-6306 (500 nM) and stained with DAPI (cyan), EdU (yellow) and a cyclin B-pS126 antibody, (magenta). The channels are merged and image is representative of three replicates. For gel source data, see Supplementary Fig. 1. Source data
Extended Data Fig. 5
Extended Data Fig. 5. RP-6306 causes unscheduled mitosis in CCNE1-high cells.
a,b, Quantitation of double-positive staining for EdU and either histone H3-pS10 (a) or Lamin A/C-pS22 (b) by FACS following vehicle (DMSO) or RP-6306 treatment (500 nM) for 24 h. Data are shown as mean ± s.d. (n = 3). The gating strategy is shown in Supplementary Figure 2. c,d, Quantitation of double-positive staining for EdU and either histone H3-pS10 (c) or Lamin A/C-pS22 (d) by FACS in HCC1569 cells following vehicle (DMSO) or the indicated dose of RP-6306 for 24 h. Data are shown as mean ± s.d. (n = 3). The gating strategy is shown in Extended Data Fig. 6b. e,f, Validation of the lamin A/C-pS22 antibody. (e) Representative micrographs of FT282-hTERT TP53R175H CCNE1 cells transduced with lentivirus expressing sgRNAs targeting either AAVS1 (sgAAVS1) or LMNA (sgLMNA-1) stained with DAPI and the indicated antibodies. (f) Flow cytometry histograms of the same cells showing loss of Lamin A/C-pS22 signal in the sgLMNA-1 condition. g–i, Time-lapse imaging of FT282-hTERT TP53R175H PCNA-chromobody-TagRFP (WT) and CCNE1-high (CCNE1) cells treated with DMSO or RP-6306 (500 nM) for 23 h. (g) Pattern of PCNA localization used to identify cell cycle stages. (h) Cell cycle profile of individual cells (each bar represents one cell). 30 cells were analysed at random for each condition. (i) Quantitation of cell cycle phase transit time of indicated samples treated with DMSO for 23 h. Data are shown as mean ± s.d. (n = 3). Source data
Extended Data Fig. 6
Extended Data Fig. 6. MMB-FOXM1 is hyperactivated in CCNE1-high cells.
a,b, heat map (a) and gene set enrichment analysis (GSEA) (b) of differential gene expression in FT282 parental (WT) vs CCNE1-high (C3 and C4 for heat map, C4 for GSEA) cells for a gene set comprising genes co-regulated by MMB-FOXM1. Development of the co-regulated MMB-FOXM1 gene list is available in Methods and the list of genes is available in Extended Data Table 3. c, Clonogenic survival of CCNE1-high FT282-hTERT TP53R175H cells nucleofected with Cas9 ribonucleoproteins assembled with the indicated sgRNAs. Shown on top are representative images of plates stained with crystal violet and below is the quantitation. Data are shown as mean ± s.d. (n = 3). d, QIBC quantitation of cells with pan-γH2AX as a function of RP-6306 dose of CCNE1-high FT282-hTERT TP53R175H cells nucleofected with Cas9 ribonucleoproteins assembled with the indicated sgRNAs. Data are shown as mean ± s.d. (n = 3). e,f, Whole cell lysates of FT282-hTERT TP53R175H parental and MYBL2-2A-GFP expressing (e) and FT282-hTERT TP53R175H MYBL2-2A-GFP WT and CCNE1-high cells (f, left) were immunoblotted with MYBL2, MYBL2-pT487 and Tubulin specific antibodies. (f, left) * and ** denote the lower and upper phosphorylated MYBL2 bands respectively. (f, right) Quantitation of upper to lower band intensity. Data are shown as mean ± s.d. (n = 3). (e) Representative of two immunoblots. For gel source data, see Supplementary Fig. 1. Source data
Extended Data Fig. 7
Extended Data Fig. 7. Increased Cyclin B and CDK1 abundance and activity render cell sensitive to RP-6306.
a, Whole cell lysates of FT282-hTERT TP53R175H WT and CCNE1-high (C3) cells were immunoblotted with antibodies against cyclin B, CDK1 and Tubulin. Top is representative immunoblot images and bottom are quantitation. Data are shown as mean ± s.d. (n = 3). b, Correlation of CCNE1 and CCNB1 mRNA expression in TCGA pan-cancer tissues (n = 10,304). c, Approach for cytoplasmic cyclin B quantitation by QIBC. The nuclear mask edge was expanded by 2 and 12 pixels to create a doughnut mask used to estimate cytoplasmic signal intensity. d, Representative micrographs of FT282-hTERT TP53R175H CCNE1-high cells transfected with the indicated siRNAs and stained with DAPI (cyan) and cyclin B antibodies (magenta). The channels are merged in the bottom panels. e, Representative QIBC micrographs of FT282-hTERT TP53R175H parental (WT) and CCNE1-high cells stained with cyclin B antibodies (magenta) and either DAPI (cyan) or EdU (yellow) channels merged. f,g, QIBC analysis of cyclin B cytoplasmic intensity, EdU incorporation and DNA content (DAPI) of CCNE1-high FT282-hTERT TP53R175H cells nucleofected with Cas9 ribonucleoproteins assembled with the indicated sgRNAs. The quantitation of cells with cytoplasmic cyclin B in late S (f) or G2/M (g) are shown. Data are shown as mean ± s.d. (n = 3) h, CCNE1-high cells have increased CDK1 activity. Top, cellular extracts of the indicated cell lines were prepared and immunoprecipitated with agarose-coupled CDK1 antibodies. Immunoprecipitates (IP) were subjected to in vitro kinases assays using [γ-32P]-ATP and recombinant histone H1 as a substrate. Reactions were resolved by SDS-PAGE and gels were imaged using a phosphor screen. A sample of each immunoprecipate was immunoblotted (IB) with a CDK1 antibody as loading control. Bottom, quantitation 32P-H1 band intensity. Data are shown as mean ± s.d. (n = 3). i, Whole cell lysates of FT282-hTERT TP53R175H parental and CCNB1-2A-GFP expressing cells were immunoblotted with cyclin B and KAP1 specific antibodies. j, Representative QIBC micrographs of FT282-hTERT TP53R175H (WT) and CCNB1-2A-GFP (CCNB1) cells treated either with DMSO or 1000 nM RP-6306. The DAPI (cyan) and γH2AX (magenta) channels are merged. k,l, QIBC quantitation of FT282-hTERT TP53R175H WT, CCNB1-2A-GFP (CCNB1) and CCNE1-high (CCNE1) with pan-γH2AX+ EdU- cells (k) and γH2AX intensity in EdU+ cells (l) as a function of RP-6306 dose. Data are shown as mean ± s.d. (n = 3). For gel source data, see Supplementary Fig. 1. Source data
Extended Data Fig. 8
Extended Data Fig. 8. HU and gemcitabine synergize with RP-6306.
a-d,f, ZIP synergy scores at various dose combinations of RP-6306 and gemcitabine (a,b,f) or hydroxyurea (HU) (c,d) in FT282-hTERT TP53R175H parental (WT) (a,c), CCNE1-high (b,d) and HCC1569 (f) cells. Score ≥10 (red color) represents synergy, ≤-10 (green) represents antagonism. Values were obtained by analyzing mean data from 3 independent biological replicates with SynergyFinder. Growth was monitored with an Incucyte for up to 6 population doublings. e, Growth inhibition relative to DMSO control of FT282-hTERT TP53R175H parental (WT) and CCNE1-high cells after treatment with the indicated dose of hydroxyurea (HU), RP-6306 or the combination of both. Growth was monitored with an Incucyte for up to 6 population doublings. Data are shown as mean ± s.d. (n = 3). g, QIBC quantitation of FT282-hTERT TP53R175H parental (WT) and CCNE1-high cells with pan-γH2AX in response to the indicated RP-6306/HU combinations. Data are shown as mean ± s.d. (n = 3). h–j, m, Replication stress activates phosphorylation of CDK1-T14. (h) Whole cell lysates of the indicated cells and conditions were immunoblotted with CDK1, CDK1-pT14, cyclin B and Tubulin specific antibodies. Quantitation of cyclin B (i), CDK1 (j) and CDK1-pT14 (m). Data are shown as mean ± s.d. (n = 3). k, l, QIBC quantitation of the fold-change of cytoplasmic cyclin B intensity in EdU+ cells following treatment with either HU (k) or gemcitabine (l) at the indicated doses for 48 h. Data are shown as mean ± s.d. (n = 3). For gel source data, see Supplementary Fig. 1. Source data
Extended Data Fig. 9
Extended Data Fig. 9. Characterization of CCNE1-normal and CCNE1-amplifed CDX models.
a, Whole cell lysates of the indicated cell lines were immunoblotted with antibodies against cyclin E and vinculin. Representative of two immunoblots. b–e, RP-6306 was administered orally BID at the indicated doses for the duration of the experiment. b, c, Tumor growth of SUM149PT (b) and A27080 (c) xenografts in NOD-SCID mice treated with either RP-6306 or vehicle BID for the duration of the experiment. Results are expressed as mean tumor volume ± s.e.m. (n = 8). P values relative to vehicle were determined by a one-way ANOVA. n.s. = non-significant value d, e Changes in body weight in tumor-bearing OVCAR3 (d) and HCC1569 (e) CB-17 SCID and SCID-beige mice treated with either RP-6306 or vehicle. Results are expressed as mean % body weight change ± s.e.m. (OVCAR3 n = 8 (vehicle), 7 (1 mg kg−1), 8 (2.5 mg kg−1), 7 (7.5 mg kg−1), 8 (20 mg kg−1); HCC1569 n = 8 (vehicle),7 (1 mg kg−1), 8 (2.5 mg kg−1), 6 (15 mg kg−1)). P values relative to vehicle were determined by a one-way ANOVA. f, g Mice bearing HCC1569 tumors were treated with RP-6306 at the indicated doses BID for 1.5 days and tumor tissue and whole blood sampled at 2, 6 and 10 h post last dose. f, Data represent the free (unbound to plasma protein) blood concentration of RP-6306 for mouse relative to tumor CDK1-pT14 signal inhibition quantified by ELISA relative to vehicle-treated control tumors (N = 3/group/time point). The tumor EC50 was determined by a non-linear least square’s regression to a normalized dose-response model with 95% confidence intervals. g, Kinetics of CDK1-pThr14 inhibition with time. Data presented as the mean ± s.e.m. (n = 3). h–m, OVCAR3 (h-j) and HCC1569 (k-m) tumor-bearing mice were administered the indicated dose of RP-6306 orally BID for 8 days and sacrificed at 6 h post last treatment (h-j) or administered the indicated dose of RP-6306 orally BID 1.5 days and sacrificed at 2 h post last treatment (k,l) and tumor tissue prepared for FFPE. HCC1569 tumors (m) were treated with 20 mg kg−1 RP-6306 BID for 2, 5 or 8 days and tumor tissue harvested 6 h post last treatment. Tumor tissues were stained with cyclin B-pS126 (h,k), histone H3-pS10 (i,l) or γH2AX (j,m) antibodies and the H-score (h,i,k,l) or percentage of strong positive γH2AX cells present in the tumor area (j,m) was quantified by HALO software. Results are expressed as mean ± s.e.m. (h-j: n = 3,4,4,4; k: n = 3,3,3,3; l: n = 3,3,3,2; m: n = 6,3,3,3). Source data
Extended Data Fig. 10
Extended Data Fig. 10. Characterization of the PDX PA1443 and RP-6306/gemcitabine in combination drive tumor regression in CCNE1-amplified CDX models.
a, Distribution of the gene-level copy number in the CCNE1-amplified pancreatic cancer (PA1443) patient-derived xenograft (PDX). Highlighted is the amplicon containing CCNE1. b, Whole cell lysates from FT282-hTERT TP53R175H parental (WT) and CCNE1-high (C3) cell lines and PA1443 PDX tumor tissue were immunoblotted with antibodies to cyclin E and vinculin. Representative of two immunoblots. c, Tumor tissues of PA1443 PDX implanted in BALB/c nude mice were prepared for FFPE and stained with a cyclin E1 antibody. d, Changes in body weight in tumor-bearing PA1443 PDX implanted in BALB/c nude mice treated either with RP-6306 or vehicle. RP-6306 was administered orally BID at 2.5 mg kg−1 for the duration of the experiment. Results are expressed as mean % body weight ± s.e.m. (n = 8). P value relative to vehicle was determined with a one-way ANOVA test. Only P values < 0.05 are indicated. ns, not significant (P value > 0.05). e, g, Same data as presented in Fig. 5d, e with tumour growth values plotted in log scale for OVCAR3 (e) and HCC1569 (g). The percent regression of the RP-6306 10 mg kg−1 and Gemcitabine 20 mg kg−1 combination arm is indicated. Results are expressed as mean tumor volume ± s.e.m. (OVCAR3 n = 7 (vehicle), 6 (10 mg kg−1 RP-6306), 7 (20 mg kg−1 gemcitabine), 7 (10 mg kg−1 RP-6306 + 20 mg kg−1 gemcitabine); HCC1569 n = 7 (vehicle), 7 (10 mg kg−1 RP-6306), 7 (20 mg kg−1 gemcitabine), 7 (10 mg kg−1 RP-6306 + 20 mg kg−1 gemcitabine)). Please refer to Fig. 5 for TGI and P values. f, h, Growth traces for individual OVCAR3 (f) and HCC1569 (h) tumors from the experiments shown in Fig. 5d, e from mice treated with the gemcitabine/RP-6306 combination. For comparison, tumor growth data for two mice treated with vehicle are shown. i, j, Changes in body weight in tumor-bearing OVCAR3 (i) and HCC1569 (j) CB-17 SCID and SCID-beige mice treated with either RP-6306, gemcitabine or both. Gemcitabine was delivered once weekly intraperitoneally and RP-6306 was given orally BID for 21 d after which all treatments were stopped, and body weight monitored for the remainder of the experiment. Results are expressed as mean ± s.e.m. (OVCAR3 n = 7 (vehicle), 6 (10 mg kg−1 RP-6306), 7 (20 mg kg−1 gemcitabine), 7 (10 mg kg−1 RP-6306 + 20 mg kg−1 gemcitabine); HCC1569 n = 7 (vehicle), 7 (10 mg kg−1 RP-6306), 7 (20 mg kg−1 gemcitabine), 7 (10 mg kg−1 RP-6306 + 20 mg kg−1 gemcitabine)) . Also indicated are P values relative to vehicle were determined with a one-way ANOVA test. Only P values < 0.05 are indicated. For gel source data, see Supplementary Fig. 1. Source data

References

    1. Watkins TBK, et al. Pervasive chromosomal instability and karyotype order in tumour evolution. Nature. 2020;587:126–132. doi: 10.1038/s41586-020-2698-6. - DOI - PMC - PubMed
    1. Patch AM, et al. Whole-genome characterization of chemoresistant ovarian cancer. Nature. 2015;521:489–494. doi: 10.1038/nature14410. - DOI - PubMed
    1. Zack TI, et al. Pan-cancer patterns of somatic copy number alteration. Nat. Genet. 2013;45:1134–1140. doi: 10.1038/ng.2760. - DOI - PMC - PubMed
    1. Yuan J, et al. Integrated analysis of genetic ancestry and genomic alterations across cancers. Cancer Cell. 2018;34:549–560.e549. doi: 10.1016/j.ccell.2018.08.019. - DOI - PMC - PubMed
    1. Etemadmoghadam D, et al. Integrated genome-wide DNA copy number and expression analysis identifies distinct mechanisms of primary chemoresistance in ovarian carcinomas. Clin. Cancer Res. 2009;15:1417–1427. doi: 10.1158/1078-0432.CCR-08-1564. - DOI - PMC - PubMed