. 2022 Apr;604(7907):714-722.
doi: 10.1038/s41586-022-04640-1. Epub 2022 Apr 20.

Somatic genomic changes in single Alzheimer's disease neurons

Affiliations

Somatic genomic changes in single Alzheimer's disease neurons

Michael B Miller et al. Nature. 2022 Apr.

Abstract

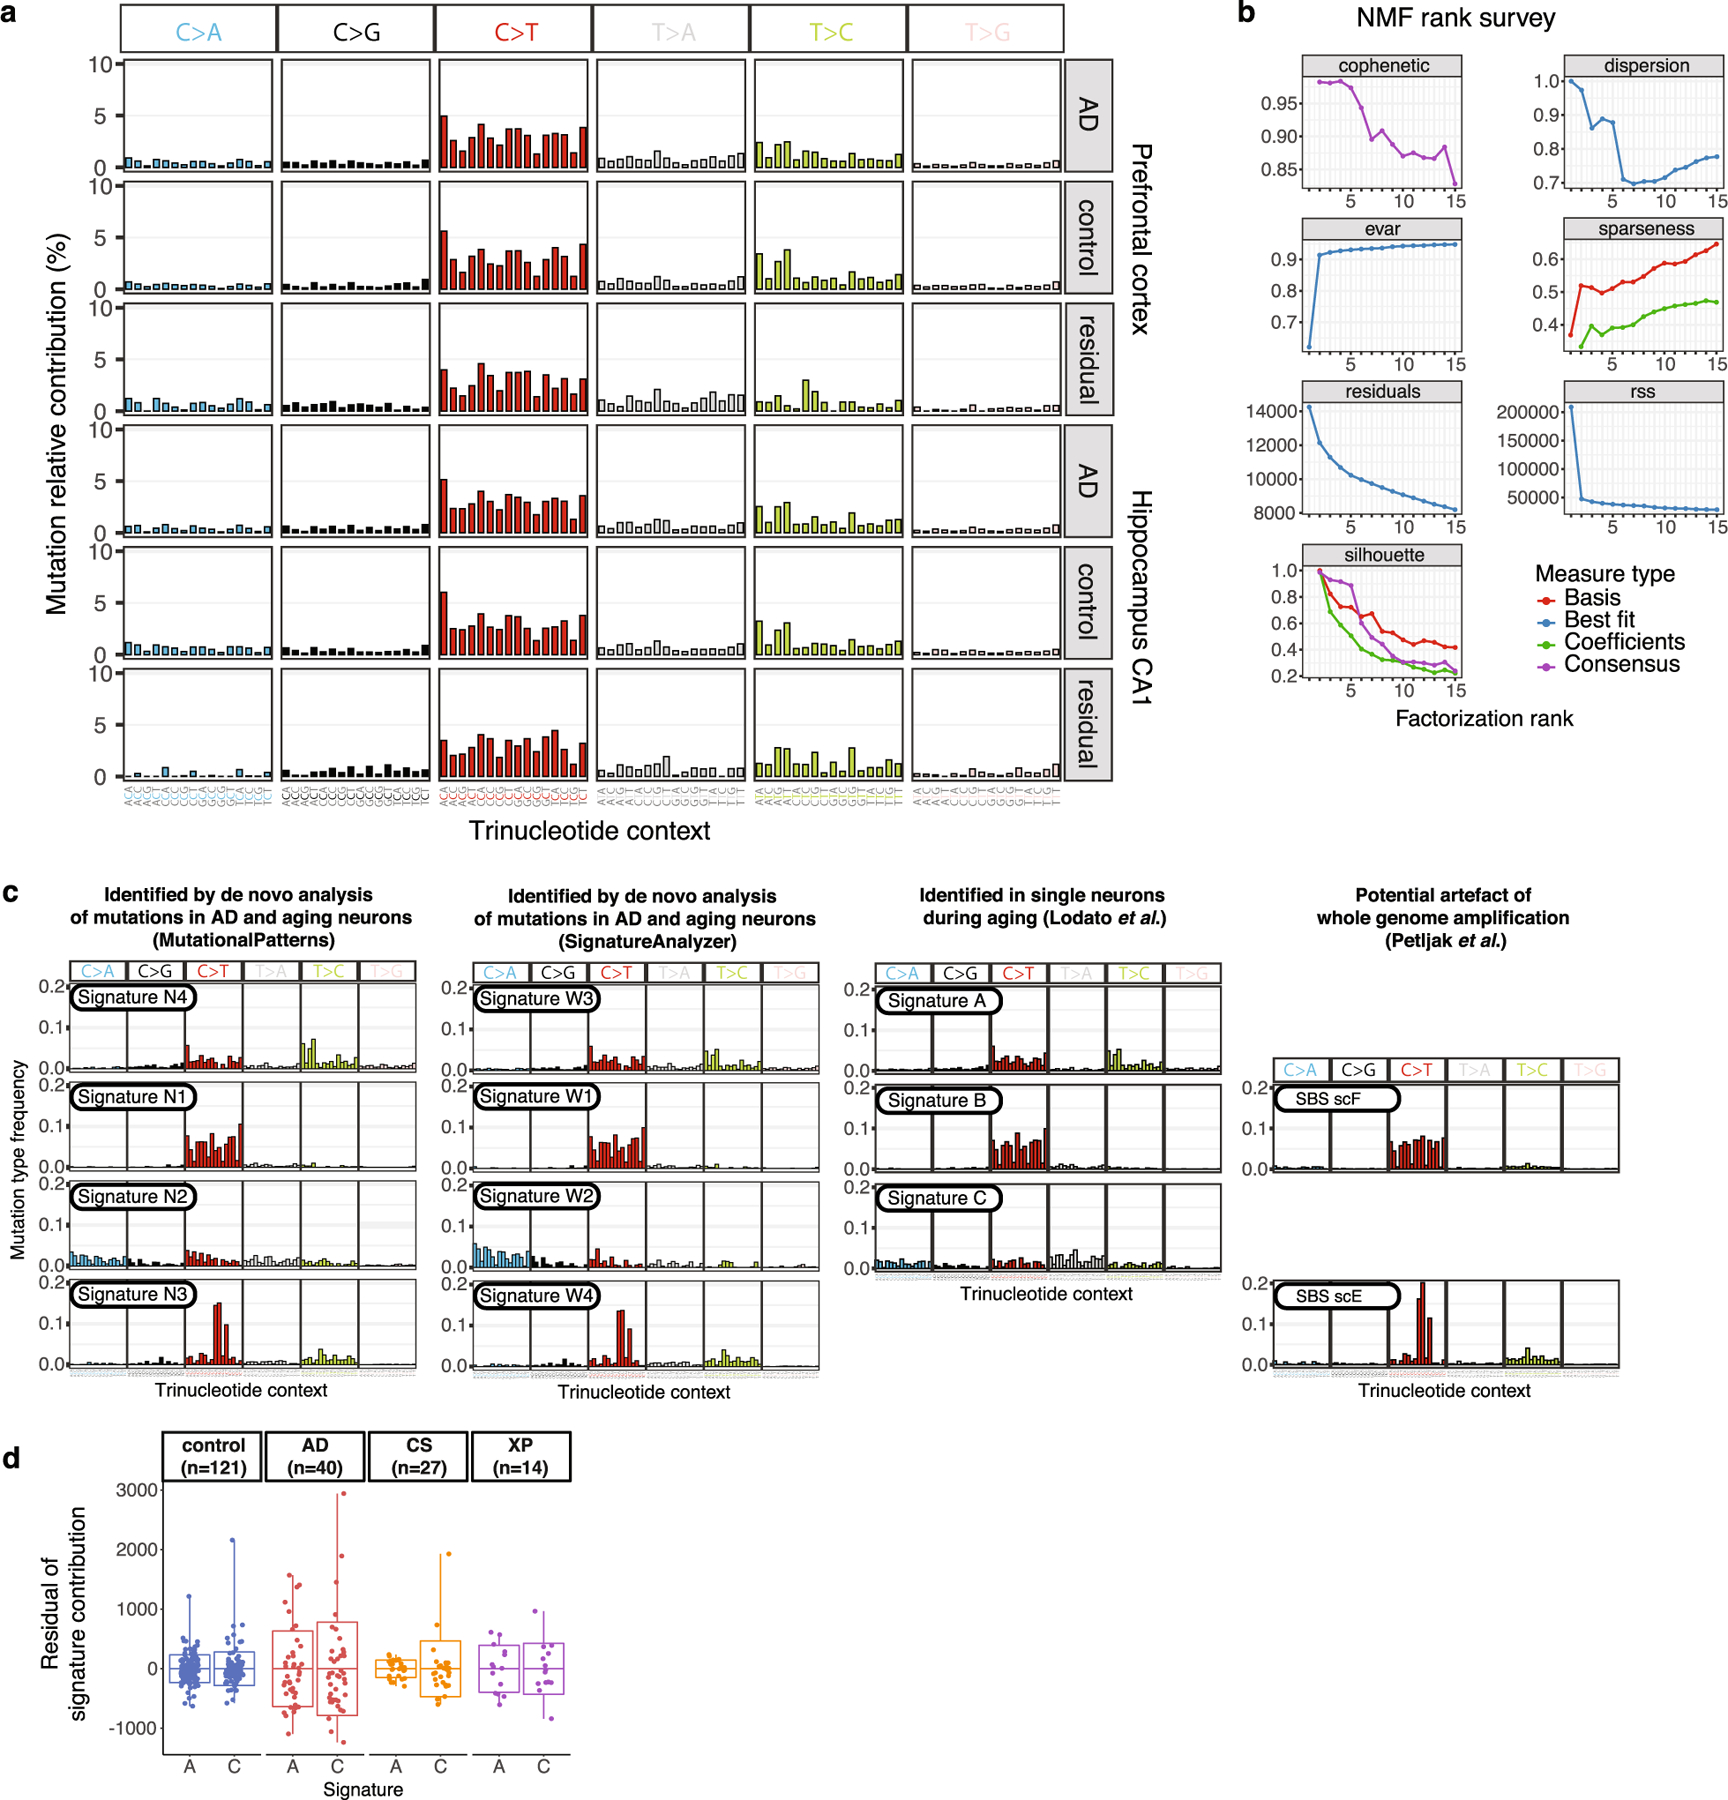
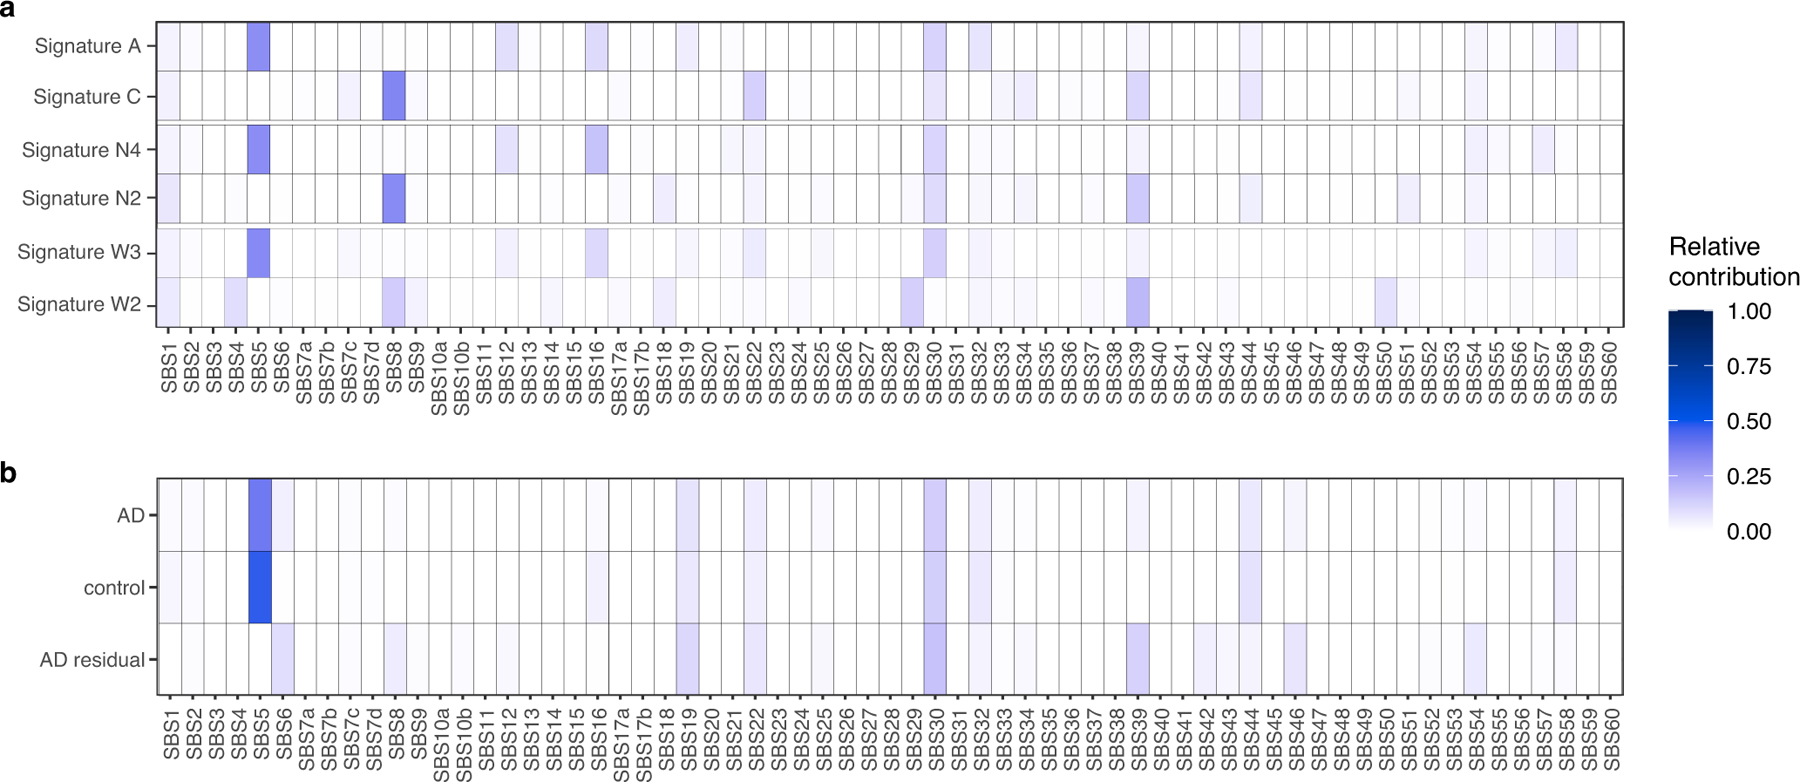
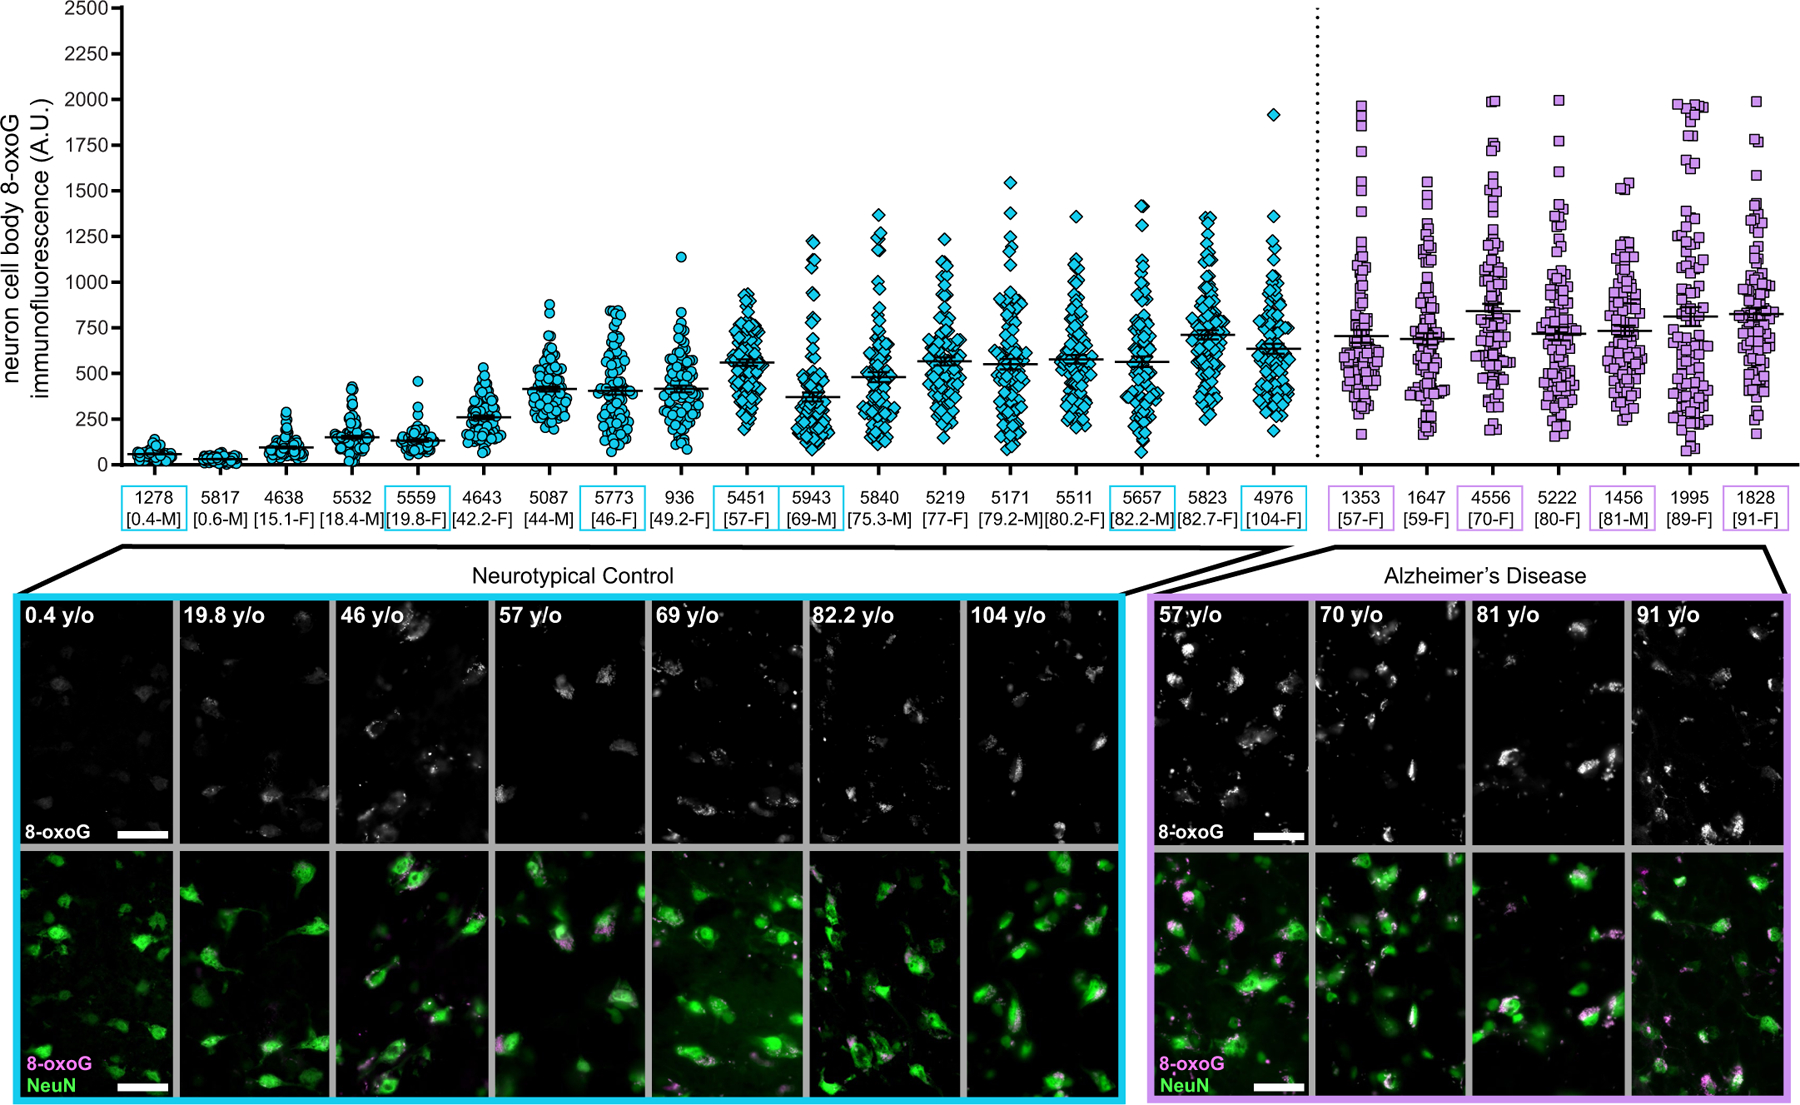
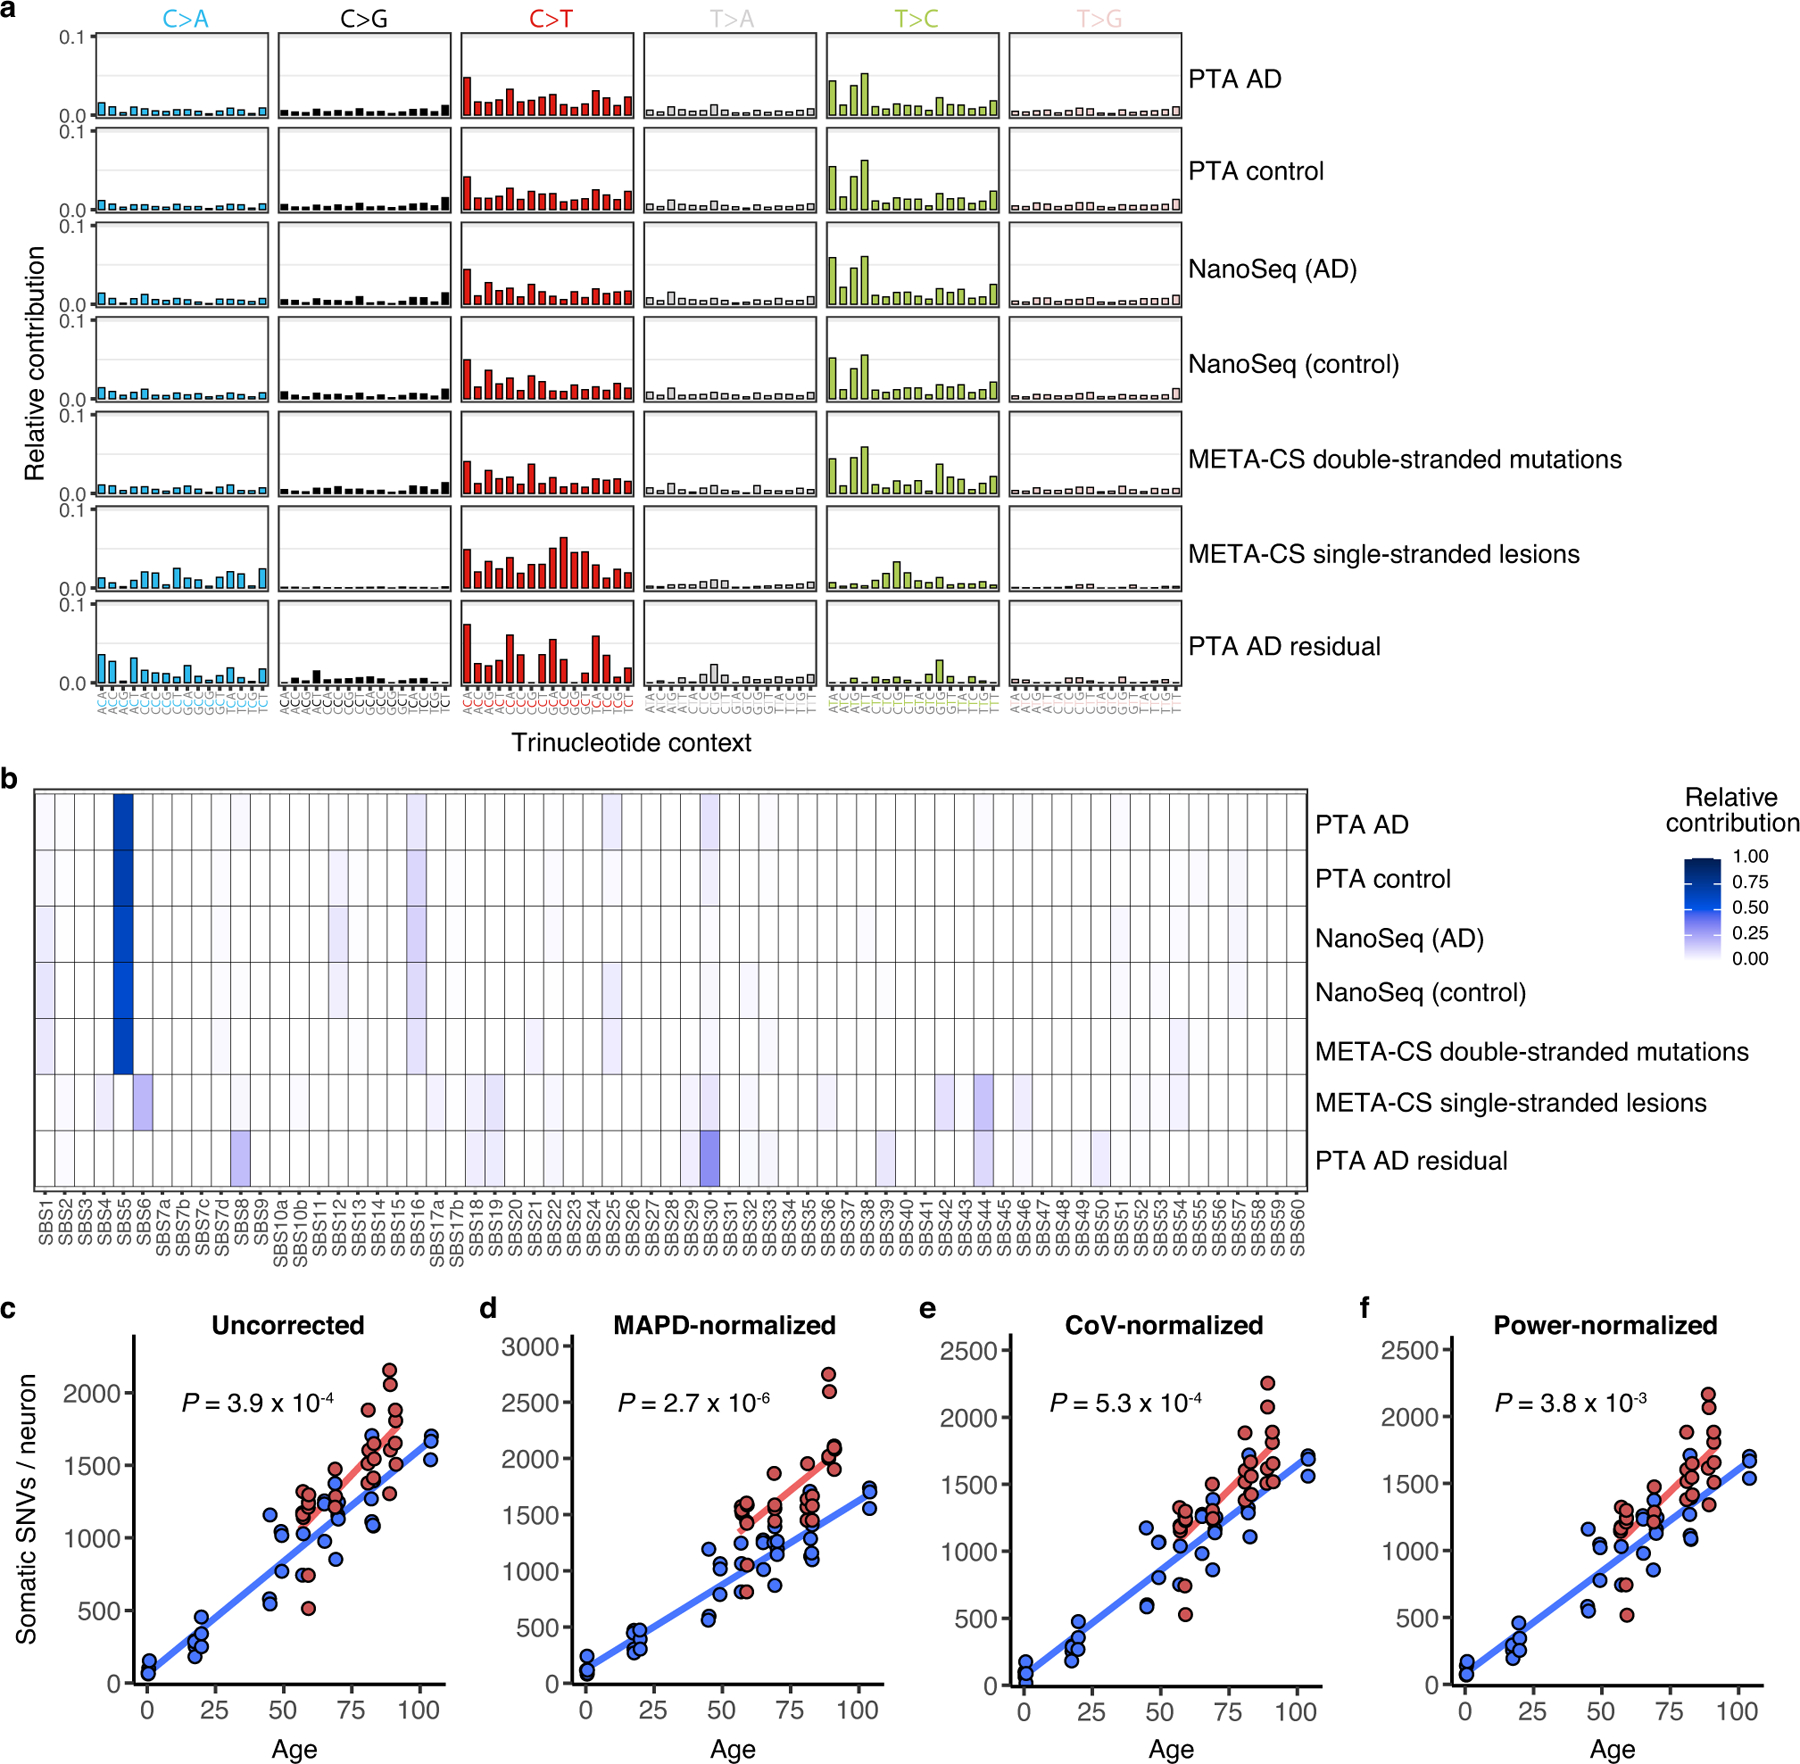
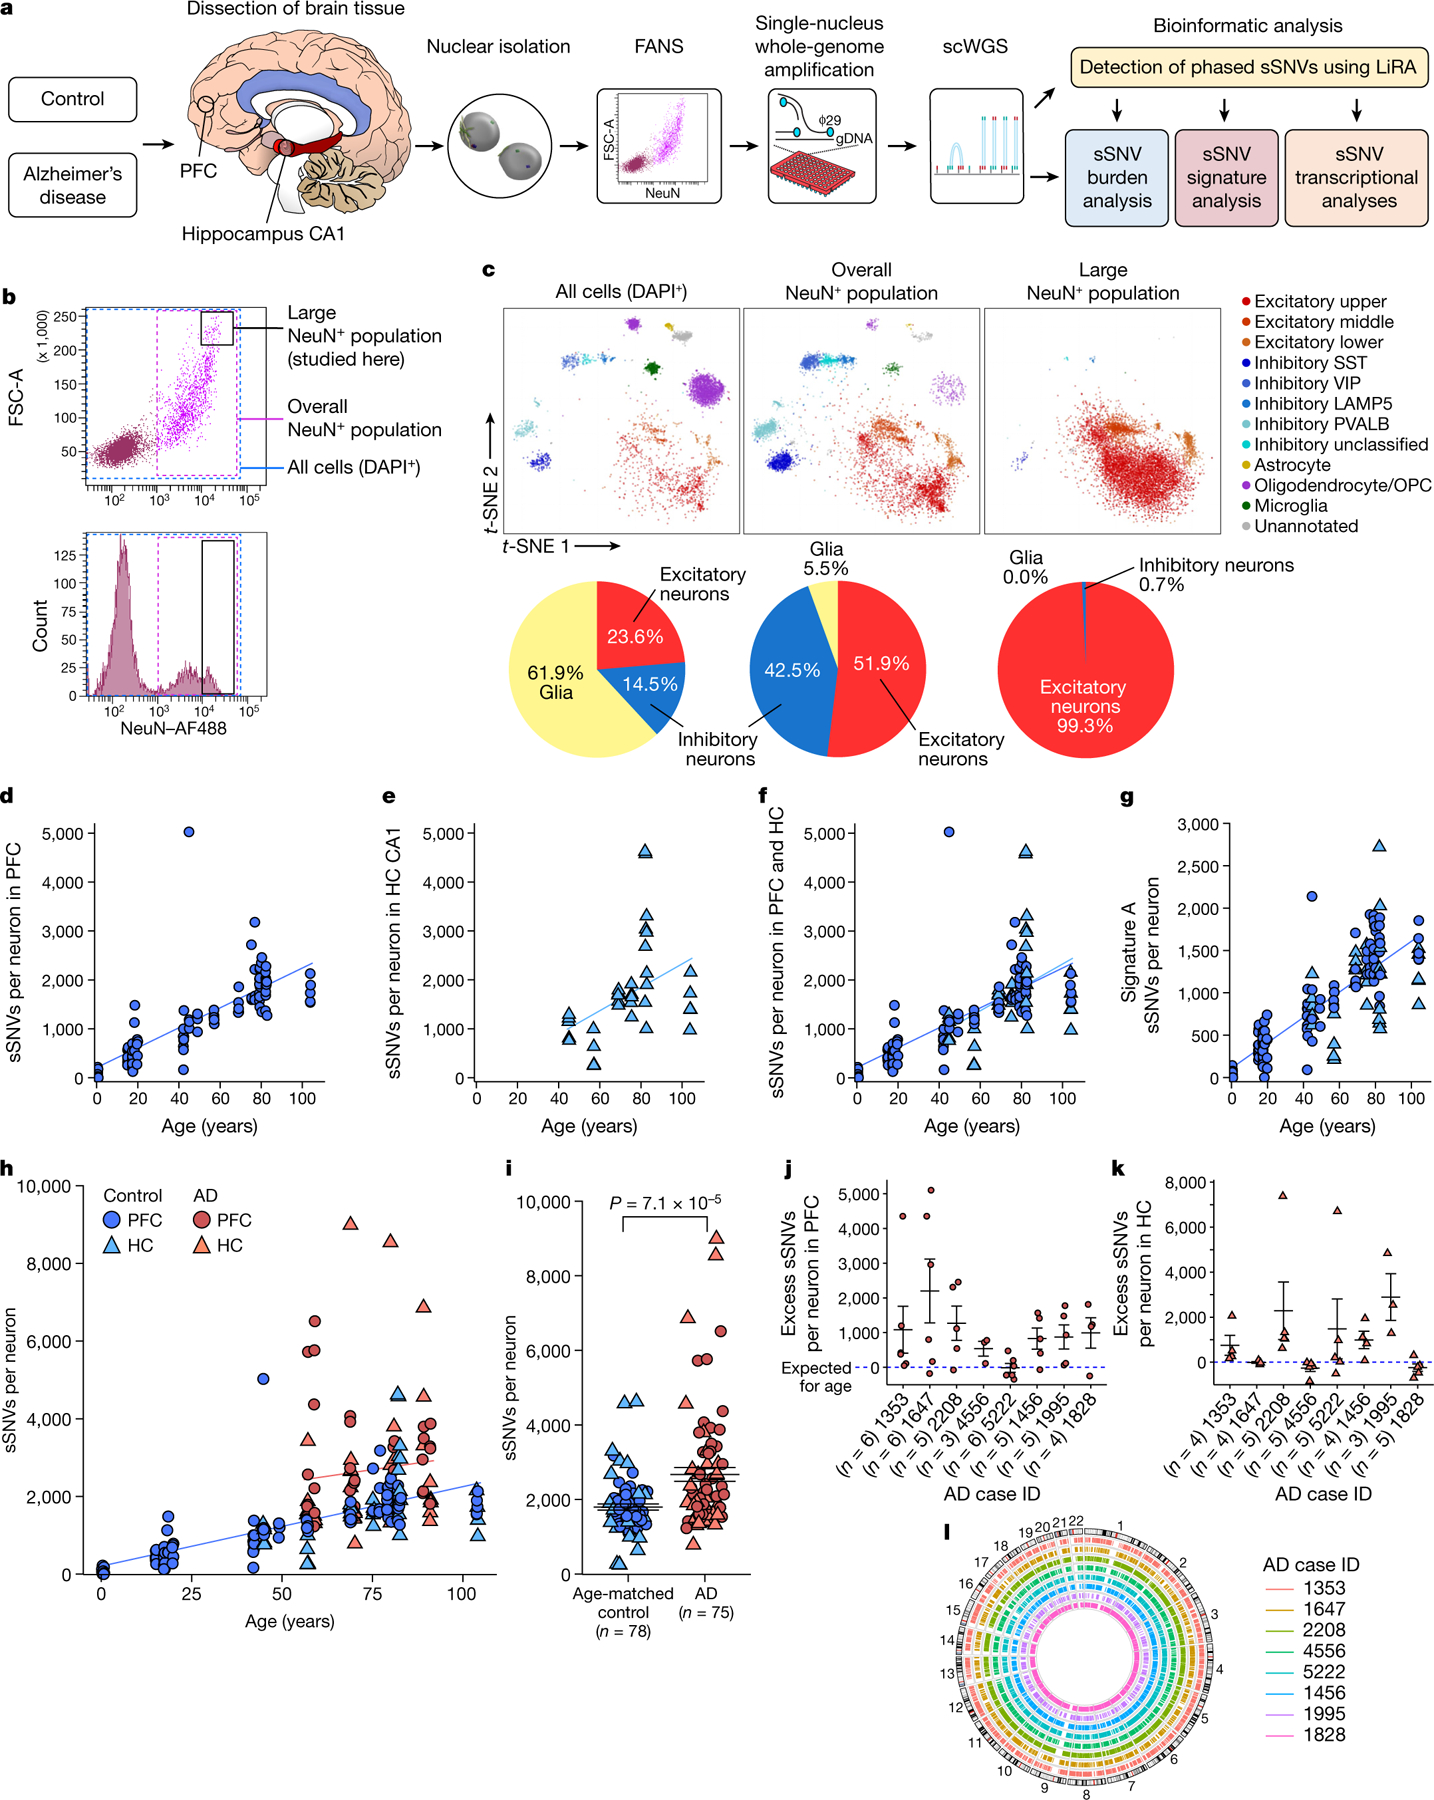
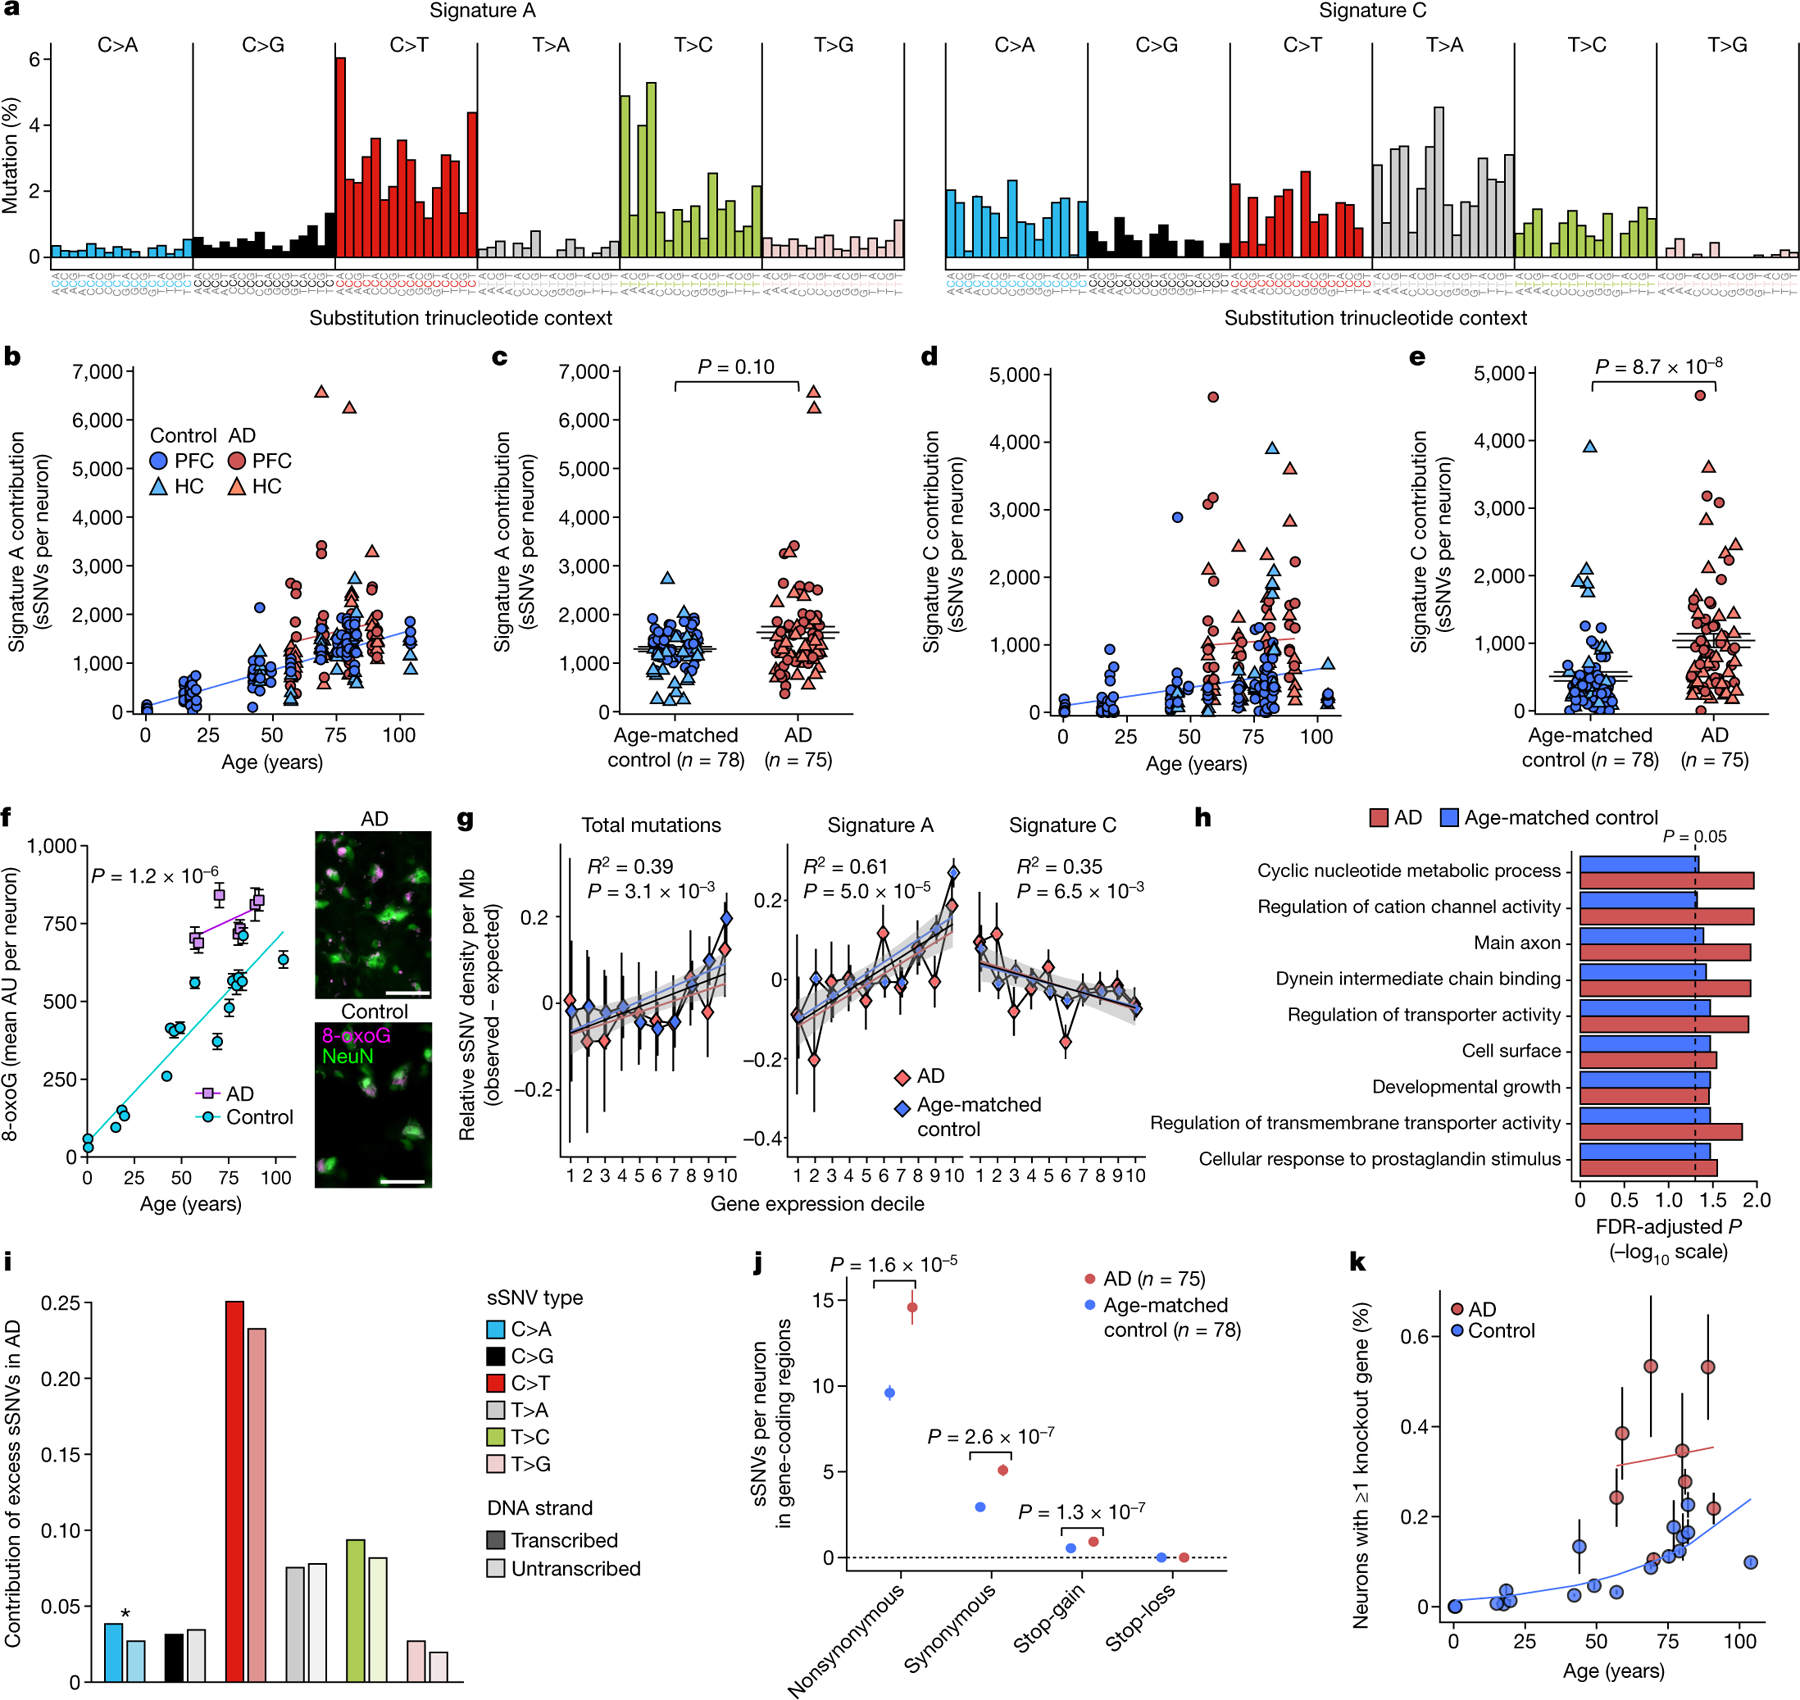
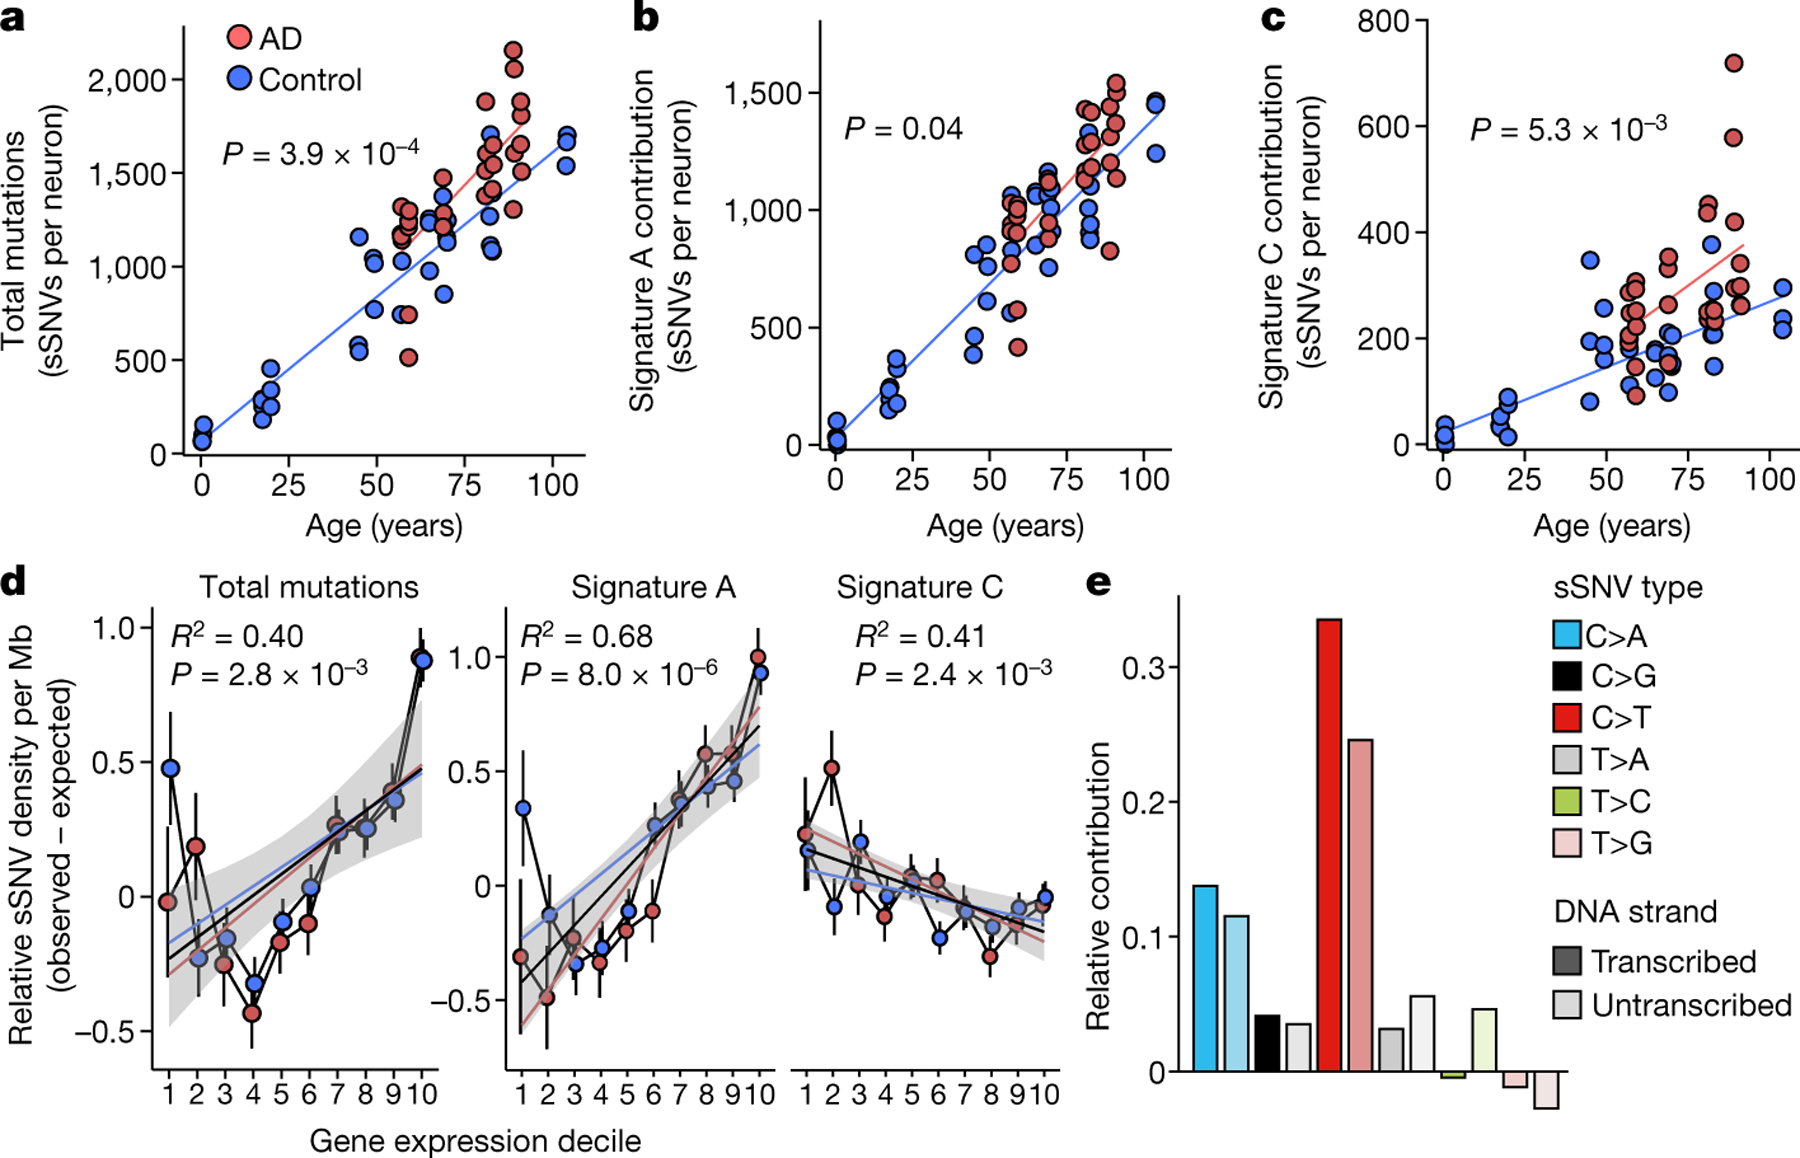
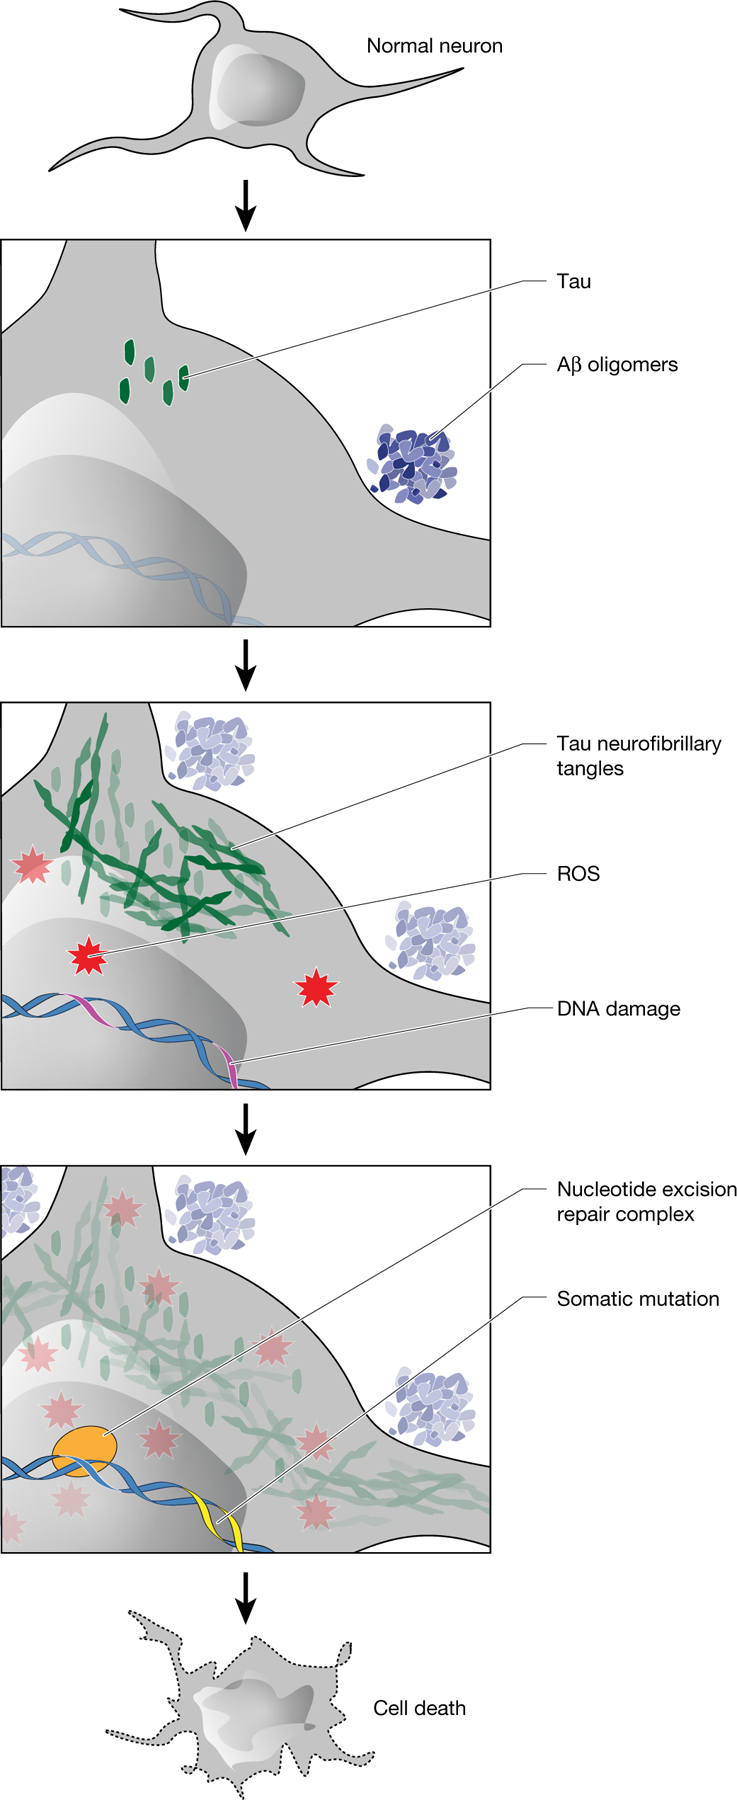
Dementia in Alzheimer's disease progresses alongside neurodegeneration1-4, but the specific events that cause neuronal dysfunction and death remain poorly understood. During normal ageing, neurons progressively accumulate somatic mutations5 at rates similar to those of dividing cells6,7 which suggests that genetic factors, environmental exposures or disease states might influence this accumulation5. Here we analysed single-cell whole-genome sequencing data from 319 neurons from the prefrontal cortex and hippocampus of individuals with Alzheimer's disease and neurotypical control individuals. We found that somatic DNA alterations increase in individuals with Alzheimer's disease, with distinct molecular patterns. Normal neurons accumulate mutations primarily in an age-related pattern (signature A), which closely resembles 'clock-like' mutational signatures that have been previously described in healthy and cancerous cells6-10. In neurons affected by Alzheimer's disease, additional DNA alterations are driven by distinct processes (signature C) that highlight C>A and other specific nucleotide changes. These changes potentially implicate nucleotide oxidation4,11, which we show is increased in Alzheimer's-disease-affected neurons in situ. Expressed genes exhibit signature-specific damage, and mutations show a transcriptional strand bias, which suggests that transcription-coupled nucleotide excision repair has a role in the generation of mutations. The alterations in Alzheimer's disease affect coding exons and are predicted to create dysfunctional genetic knockout cells and proteostatic stress. Our results suggest that known pathogenic mechanisms in Alzheimer's disease may lead to genomic damage to neurons that can progressively impair function. The aberrant accumulation of DNA alterations in neurodegeneration provides insight into the cascade of molecular and cellular events that occurs in the development of Alzheimer's disease.


Conflict of interest statement

Competing interests C.A.W. is a paid consultant (cash, no equity) to Third Rock Ventures and Flagship Pioneering (cash, no equity) and is on the Clinical Advisory Board (cash and equity) of Maze Therapeutics. No research support is received. These companies did not fund and had no role in the conception or performance of this research project. The remaining authors declare no competing interests.

Figures

Extended Data Fig. 1 |
Extended Data Fig. 1 |. Filtering of LiRA-called sSNVs to minimize single-cell artefacts from MDA amplification.
a, Total pre-filtering LiRA-called sSNV per genome for control and AD single neurons. Single neuronal nuclei from prefrontal cortex (PFC) and hippocampal CA1 (HC) underwent scWGS (45X targeted average coverage). Genome-wide counts of sSNV were determined using linked-read analysis (LiRA). Per genome sSNV counts for all control and AD neurons are shown here, prior to signature-based filtering. b, Total pre-filtering LiRA-called sSNV per genome plotted against raw LiRA-called sSNVs, an intermediate metric in the LiRA calling pipeline prior to power ratio adjustment for genome coverage and false positive rate. c, Single neuron sSNV counts in relation to coverage evenness of genome sequencing. Total pre-filtering LiRA-called sSNV counts from single neuronal nuclei are shown in relation to median absolute pairwise difference (MAPD) scores for the coverage evenness of each cell. At very high MAPD scores (>2.0), sSNV counts increase with MAPD, raising concern for artefactual sSNV calls in these cells owing to uneven genome coverage. d, e, Using NMF mutational signature analysis, the sSNV contribution was determined for two signatures potentially representing single-cell amplification artefacts: SBS scE and SBS scF. For signature, the mutation type frequency for each trinucleotide context is shown above the sSNV plot. SBS scF is composed of C>T changes, while SBS scE is characterized by a particular subset of C>T, GC>GT. Signature SBS scE showed elevation in cells with MAPD >2.0. Signature SBS scF shows a relationship between uneven amplification (high MAPD) and SBS scF, perhaps owing to allele dropout causing single strand lesions to be read as somatic mutations. A subset of AD neurons showed LiRA-called pre-filtering sSNV counts >20,000/neuron and substantial component of potential artefact signature SBS scE. These neurons may represent an agonal ‘ultramutated’ state, but were not included in subsequent analyses owing to the abundance of potential artefact signature SBS scE (see g). f, Schematic for potential generation of artefactual sSNV in scWGS owing to uneven coverage. The scWGS LiRA platform calls sSNVs that are linked by sequencing reads to heterozygous germline single nucleotide polymorphisms (SNPs) (left). A single-stranded lesion of DNA damage, such as oxidation or alkylation, is paired with an unmodified base on the opposite genomic strand, such that LiRA would not call a sSNV under conditions of sufficiently even sequencing coverage (middle). However, if severe non-uniformity in strand-specific amplification (strand dropout) occurred, the single-stranded DNA lesion (or a polymerase error on one strand) could be erroneously called as an sSNV (right). For this reason, severely uneven single-cell genome amplification could produce artefactual LiRA sSNV calls. g, Analysis pipeline for minimization of potential artefacts of single-cell genome amplification and sequencing. Using our observations and advances reported in Petljak et al., we developed a computational pipeline to generate a set of higher-confidence filtered sSNV calls. This pipeline uses SNP-phased SNVs called by linked-read analysis (LiRA), and applies 3 additional specific steps to the initial variant call set: 1) Removal of single neurons which display widely uneven genome amplification, as indicated by MAPD score >2.0, above which the number of sSNVs increases (see c), raising concern for false positive variant calls due to uneven genome coverage; 2) Removal of single neurons whose mutational profile is dominated by the potential artefact mutational signature SBS scE (see d); and 3) Removal from each neuron the contribution of variants from the potentially artefactual signatures SBS scE and SBS scF. These steps produce counts of higher-confidence filtered sSNVs from single neurons. Although mutational signatures SBS scE and SBS scF have been previously reported as a potential artefact of single-cell genome amplification, the signal does potentially carry biological information. However, in this study we exclude these variants so as to minimize the influence of potential artefactual sSNV calls, to focus our analysis on the higher-confidence filtered sSNVs.
Extended Data Fig. 2 |
Extended Data Fig. 2 |. Single-cell variant calling identifies high-confidence sSNVs.
To assess the quality of the sSNVs identified from single-cell MDA-amplified WGS data, we compared their variant allele fractions in control and AD neurons to those of phaseable high-confidence heterozygous germline SNVs from the same neurons, shown for each base change type. The distributions between somatic and germline SNVs are comparable, indicating the validity of the somatic mutation calling method, as has been previously reported for the LiRA calling method,.
Extended Data Fig. 3 |
Extended Data Fig. 3 |. sSNVs in neurotypical control and AD neurons, normalized by evenness of genome amplification or LiRA caller power ratio.
To assess the sSNV, as determined by the variant calling approach used in this study, we plotted sSNV counts from MDA-amplified single neurons against age, including using sSNV counts that were normalized for two distinct measures of evenness of genome coverage, median absolute pairwise difference (MAPD) and coefficient of variation (CoV). We also normalized by the power ratio used in LiRA phasing-based sSNV detection (see Methods). ad, sSNVs per genome for neurotypical control neurons, with mixed-effects modelling trend lines for ageing. We observed a significant age-dependent increase of sSNV burden in each analysis, with the slope for human pyramidal neurons ranging from 16.4 sSNV/yr to 21.1 sSNV/yr, depending on the method of adjustment for genome coverage evenness. For analysis of PFC region cells alone, we observed a similar range of slopes by this analysis: 16.8 sSNV/yr to 21.3 sSNV/yr. eh, sSNVs in AD compared to neurotypical control neurons. Unadjusted for evenness (e, reproduced from Fig. 1h, AD neurons show a mean of 2672 (range 783-8990) sSNVs, an excess of 971 over controls (P = 6.5 × 10⁻⁵, linear mixed model). f, Normalized for MAPD, AD neurons show a mean of 1582 (range 33-8366) sSNVs, an excess of 480 over controls (P = 0.01, linear mixed model). g, Normalized for CoV, AD neurons show a mean of 2264 (range 68-8861) sSNVs, an excess of 831 over controls (P = 6.7 × 10⁻⁵, linear mixed model). h, Normalized for power ratio, AD neurons show a mean of 2015 (range 162-7892) sSNVs, an excess of 511 over controls (P = 7.2 × 10⁻³, linear mixed model). In each analysis, AD neurons showed a significantly greater number of sSNV compared to control neurons. Although some normalizations may result in reduced detection of biological differences in AD specimens, we observed that sSNV differences are retained even after normalization, supporting a sSNV difference between AD and control neurons.
Extended Data Fig. 4 |
Extended Data Fig. 4 |. Distribution of sSNVs in relation to gene position comparing AD and age-matched control neurons.
a, sSNVs per neuron across different categories of genomic regions, based on position relative to gene structure. b, Proportional distribution of sSNVs in AD and control cases across different categories of genomic regions. Upstream and downstream were defined as <1 kb genomic regions from the transcription start and end sites, respectively. Each proportion is normalized by the expected proportion after controlling for trinucleotide context of phaseable regions. c, Proportional distribution of sSNVs relative to gene transcript length. The proportions for control or AD sSNVs were normalized by the expected proportion after controlling for trinucleotide context of phaseable regions. For each set, mean ± SEM is shown. For b, c, P value is shown for the observation showing statistically significant difference between AD and control (two-tailed t-test). AD neurons show a trend of excess over controls in sSNVs in upstream positions (not surviving Bonferroni correction). Data in this figure were obtained by MDA amplification of single genomes of neurons.
Extended Data Fig. 5 |
Extended Data Fig. 5 |. Somatic mutation trinucleotide context profiles and signature derivation in MDA-amplified single-neuron genomes.
a, Trinucleotide context somatic mutation profiles in AD and control neurons. Mutations called by LiRA are shown by base substitution change (bar colour), separated for each of the 16 possible trinucleotide contexts for each substitution (96 total trinucleotide contexts). For each brain region profiled, the aggregate is shown for AD cases, neurotypical controls, and the difference (residual of cases mutations minus control mutations). b, Signature metrics for de novo mutational signature derivation from neurons in this study. Using the frequency of sSNV mutations in their trinucleotide context for all control and AD neurons, we fitted mutational signatures with a NMF-based framework. We identified four signatures, N1-N4, that maximize the cophenetic of the decomposition. c, sSNV mutational signatures evaluated in this study. We performed de novo mutational signature generation using NMF (MutationalPatterns and SignatureAnalyzer) on the set of scWGS data from single neurons from AD and neurotypical controls, which each produced 4 highly similar signatures by best fit. Previously published analysis of single neurons (Lodato et al.) during ageing produced 3 signatures: A, B, and C. A recently published study of cultured cells (Petljak et al.) identified signatures thought to represent artefacts of scWGS, including SBS scE and SBS scF. d, Variation between neurons of mutational signature contributions. We performed linear regression for signature contribution with respect to age and disease status. The residual signature contribution of each neuron for signature A and signature C is shown here, for each disease group. Also shown are the mean (bar) ± standard deviation (boxes), with the range (whisker lines). In addition to the neurotypical control and AD neurons reported in this manuscript, we also performed this analysis on previously reported single human neuron data for two NER-deficiency diseases: Cockayne syndrome (CS) and xeroderma pigmentosum (XP). Because only PFC was studied for CS and XP, only the control and AD neurons from PFC were used for this analysis. For each disease group, signature C showed a greater standard deviation than signature A; standard deviation ratios between signatures C and A are as follows: 1.2 (control), 1.2 (AD), 3.2 (CS), and 1.1 (XP). Data were obtained from MDA amplification of single neuron genomes. Boxplots show mean ± SD, with whiskers denoting minima and maxima.
Extended Data Fig. 6 |
Extended Data Fig. 6 |. COSMIC mutational signature contributions to single-neuron signatures and disease-related mutational patterns.
a, The set of trinucleotide contexts in single neuron signatures derived in the prior study (signatures A and C), along with single neuron signatures derived de novo from single AD and control neurons (signatures N4 and N2 derived using MutationalPatterns, and signatures W3 and W2 derived using SignatureAnalyzer) were analysed for contributions by COSMIC v3 single base substitution mutational signatures by NMF. The matching prior and de novo signatures show highly similar COSMIC signature contributions. b, The set of mutation trinucleotide contexts present in AD and control neuron genomes amplified by MDA, as well as the matrix of mutations obtained by subtracting control from AD (AD residual), were analysed for contributions by COSMIC signatures. Multiple COSMIC signatures identified here, many of which also contribute to signature C, are associated with transcription-coupled nucleotide excision repair at particular damaged nucleotides with specific resultant base changes, including: SBS8 (guanine damage, C>A mutations), SBS22 (adenine damage, T>A mutations), SBS12 (adenine damage, T>C mutations), and SBS19 (guanine damage, C>T mutations). Other signatures have been associated with deficiencies of separate DNA repair processes: SBS6 (mismatch repair) and SBS30 (base excision repair). SBS5, associated with ageing, contributes significantly to the control and AD samples, but not to the AD residual mutations.
Extended Data Fig. 7 |
Extended Data Fig. 7 |. Immunofluorescent detection of nucleotide oxidation in neurons.
Immunofluorescence was performed on post-mortem human brain prefrontal cortex. NeuN (AF488) was used to label neurons and 8-oxoG (AF555) used to label oxidized guanine nucleotides. a, For each case sample, in a full microscopic field of up to 100 NeuN+ neurons, 8-oxoG signal was quantified per neuron. Here, each data point represents the 8-oxoG signal from one neuron, with mean and SEM shown in black for each case. Figure 2f shows mean 8-oxoG values of each case in relation to age and disease status. b, Representative microscopy images (turquoise or purple boxes) are shown for neurotypical control and AD samples from a. n = 100 total neurons examined (50 neurons each from two independent staining experiment batches per case). NeuN+ neurons are shown in green and 8-oxoG in greyscale or magenta. Scale bars represent 60 μm.
Extended Data Fig. 8 |
Extended Data Fig. 8 |. Features of somatic mutations in single neurons assessed by PTA.
a, Trinucleotide somatic mutation spectra of cells or bulk samples studied by various methods were compared. For PTA-amplified single neurons, the aggregate of mutations is shown for AD cases, age-matched neurotypical controls, and the residual (net increase of case mutations over control mutations). Mutational spectra from other methods include NanoSeq-studied bulk samples from AD or controls and META-CS single neuron data for double-stranded mutations or single-stranded DNA lesions. Mutations are shown by base substitution change (bar colour). Of note, single-stranded DNA lesions show a distinct profile from mutations detected by PTA, NanoSeq, and META-CS. b, The spectra of mutations detected in PTA-amplified neurons (AD, control, and AD residual) and from other published methods were analysed for contributions by COSMIC cancer signatures. Elements of COSMIC signatures identified in the AD residual mutation set, including SBS8, also contribute to signature C. Of note, single-stranded DNA lesions show a distinct profile from mutations detected by PTA, NanoSeq, and META-CS. cf, sSNV detected using PTA in AD and neurotypical control neurons, normalized by evenness of genome amplification or LiRA caller power ratio. c, Total sSNVs per genome plotted against age (uncorrected, reproduced here from Fig. 3a for comparison). AD neurons show a mean of 1419 (range 514–2157) sSNVs, an excess of 196 over controls (P = 3.9 × 10⁻⁴, linear mixed model). d, MAPD-normalized sSNVs per genome, from which AD neurons show a mean of 1703 (range 814-2748) sSNVs, an excess of 453 over controls (P = 2.7 × 10⁻⁶, linear mixed model). e, CoV-normalized sSNVs per genome, from which AD neurons show a mean of 1440 (range 527-2255) sSNVs, an excess of 189 over controls (P = 5.3 × 10⁻⁴, linear mixed model). f, Power-normalized sSNVs per genome, from which AD neurons show a mean of 1423 (range 517–2166) sSNVs, an excess of 198 over controls (P = 3.8 × 10⁻³, linear mixed model). In each analysis, AD neurons showed a significantly greater number of sSNV compared to control neurons.
Fig. 1 |
Fig. 1 |. Somatic mutations in single neurons in control individuals and individuals with AD.
a, Experimental outline for scWGS. From human brain, large neurons were isolated and their genomes were amplified, sequenced, and analysed for sSNV. FANS, fluorescence-activated nuclear sorting. b, FANS using AF488-conjugated anti-NeuN antibodies to label candidate neurons for separation from glia and other cell types. Boxes show the full population of DAPI+ diploid cellular nuclei (blue dashed box); the overall population of NeuN+ nuclei (pink dashed box); and the large NeuN+ subset (black box; the subject of this study). c, Single-nucleus transcriptomic profiling of each population. Individual cells are plotted according to t-distributed stochastic neighbour embedding (t-SNE) coordinates, and clusters of 50 cells or more are annotated and labelled by colour, with a pie chart of the relative abundance of excitatory neurons, inhibitory neurons and glia in each population. OPC, oligodendrocyte precursor cell. dl, sSNVs identified using MDA genome amplification. df, sSNVs in neurotypical control neurons. Data points represent single neurons; trend lines show linear mixed models (PFC: P = 3.3 × 10⁻⁷, R2 = 0.63; hippocampus (HC): P = 0.16, R2 = 0.18). g, Contribution of ageing signature A to sSNVs (P = 1.67 × 10⁻¹⁰, R2 = 0.68, linear mixed model). h, sSNVs as a function of age in neurotypical control individuals and individuals with AD (linear mixed model trend lines: blue, control: P = 6.8 × 10⁻⁷, R2 = 0.51; red, AD: P = 0.46, R2 = 0.01). AD contributes a significant excess of sSNVs in neurons relative to normal ageing (P = 6.5 × 10⁻⁵, linear mixed model). i, AD neurons show increased sSNVs compared with age-matched (over 50 years old) control neurons (874 sSNVs per neuron, P = 7.1 × 10⁻⁵, two-tailed Wilcoxon test). j, k, Excess sSNVs attributable to AD in the PFC (j) and the hippocampus (k). The dashed blue line shows sSNVs attributable to age (zero excess). For ik, black bars show mean ± s.e.m. l, Circos plot showing the wide distribution of sSNVs across the genome in AD neurons.
Fig. 2 |
Fig. 2 |. Somatic mutational signatures and patterns in AD neurons by MDA.
a, Somatic mutational signatures identified by NMF. b, c, Signature A contribution by age (b; AD excess 418, P = 3.1 × 10⁻⁴, linear mixed model) and in individuals with AD versus age-matched control individuals (c; 27% increase in AD, P = 0.10, two-tailed Wilcoxon test). d, e, Signature C contribution by age (d; AD excess 549, P = 1.4 × 10⁻³, linear mixed model) and in individuals with AD versus control individuals (e; 104% increase in AD, P = 8.7 × 10⁻⁸, two-tailed Wilcoxon test). f, Oxidative damage in AD neurons, using 8-oxoG immunofluorescence. Data points represent mean absorbance units (AU) ± s.e.m. of n = 100 neurons per case in PFC (full data in Extended Data Fig. 7). Trend lines show linear mixed-effects regression (AD versus control: P = 1.2 × 10⁻⁶). Inset shows representative immunofluorescence images; neurons (NeuN; green) and oxidized guanine (8-oxoG; magenta). Scale bars, 60 μm. g, Genomic sSNV density as a function of gene expression in the brain. Diamonds represent mean relative sSNV density in single neurons (black vertical lines show s.d., n = 1,000 permutations). Overall trend line is shown in black (R2 and P value, Pearson correlation); 95% confidence interval (CI) in grey; and AD and control trend lines in colours. h, GO analysis of genes mutated in single neurons. i, sSNVs by DNA strand template status. sSNVs in transcribed regions exhibit a strand bias in the excess mutations in AD neurons, which is most pronounced in C>A variants (*P = 0.017, two-tailed Poisson test). j, Coding mutation subtypes, in which increased nonsynonymous mutations in AD (P = 1.6 × 10⁻⁵, two-tailed t-test) increase the propensity for presentation of neoantigen peptides. k, sSNVs that result in gene knockout cells. Model for the abundance of neurons with gene inactivation, affecting function. Circles represent mean for each individual, (n > 3 neurons each, see Source Data), with 95% CI. c, e, j, Data are mean ± s.e.m.
Fig. 3 |
Fig. 3 |. Profile of somatic mutations in single AD neurons by PTA.
Single-neuronal nuclei were isolated from control and AD prefrontal cortex and subjected to PTA whole-genome amplification for scWGS. a, sSNVs as a function of age in neurotypical control individuals (blue) and individuals with AD (red). Blue and red lines show linear mixed model trend lines for each group (control: P = 2.0 × 10⁻¹⁶, R2 = 0.90; AD: P = 6.57 × 10⁻⁷, R2 = 0.59). By PTA, AD contributes a significant excess of sSNVs (196 per genome) in neurons compared to the normal ageing trend line (P = 3.9 × 10⁻⁴, linear mixed model). b, c, PTA-called sSNVs by mutational signature in each individual neuron. sSNV contributions are shown as a function of age for signature A (b; AD versus control P = 0.04, linear mixed model) and signature C (c; AD versus control P = 5.3 × 10⁻³, linear mixed model). d, Transcriptional influence on somatic mutation in neurons profiled by PTA. Genes with higher expression levels show increased overall and signature A density and decreased signature C density. Data points represent mean sSNV density relative to expected density based on the mutation trinucleotide context, with black vertical lines showing s.e.m. Controls represent age-matched (over 50 years old) neurotypical neurons. Overall trend line is shown in black; 95% CI in grey; and separate AD and control trend lines in colours. R2 and P values are shown for Pearson correlation. e, sSNVs by DNA strand template status. sSNVs in transcribed regions exhibit a strand bias in the excess mutations in AD neurons. For each nucleotide change, the proportional contributions of the transcribed and the untranscribed strand are shown. The strand bias ratio data in PTA-amplified neuron data showed a similar trend to that seen in MDA-amplified neurons.
Fig. 4 |
Fig. 4 |. Model of the role of somatic mutations in AD pathogenesis.
Amyloid-β(Aβ) oligomers initiate a cascade of events, including the conversion of tau to neurofibrillary tangles and the accumulation of ROS. After DNA damage by ROS or other mutagens, somatic mutations develop with characteristic features of signature C. NER affects the strand and gene distribution of somatic mutations, and rare base misincorporation during repair may also have a role in the progression from DNA damage to mutation. These somatic mutations stand to increase cellular vulnerabilitybymechanismsincludinggeneinactivationandneoantigenpresentation.

References

    1. Selkoe DJ & Hardy J The amyloid hypothesis of Alzheimer’s disease at 25 years. EMBO Mol. Med 8, 595–608 (2016). - PMC - PubMed
    1. Hyman BT et al. National Institute on Aging–Alzheimer’s Association guidelines for the neuropathologic assessment of Alzheimer’s disease. Alzheimers Dement 8, 1–13 (2012). - PMC - PubMed
    1. Braak H & Braak E Staging of Alzheimer’s disease-related neurofibrillary changes. Neurobiol. Aging 16, 271–278 (1995). - PubMed
    1. Gabbita SP, Lovell MA & Markesbery WR Increased nuclear DNA oxidation in the brain in Alzheimer’s disease. J. Neurochem 71, 2034–2040 (1998). - PubMed
    1. Lodato MA et al. Aging and neurodegeneration are associated with increased mutations in single human neurons. Science 359, 555–559 (2018). - PMC - PubMed

LinkOut - more resources