Review
. 2022 Jun;23(6):361-375.
doi: 10.1038/s41583-022-00583-8. Epub 2022 Apr 20.

Causal mapping of human brain function

Affiliations
Review

Causal mapping of human brain function

Shan H Siddiqi et al. Nat Rev Neurosci. 2022 Jun.

Abstract

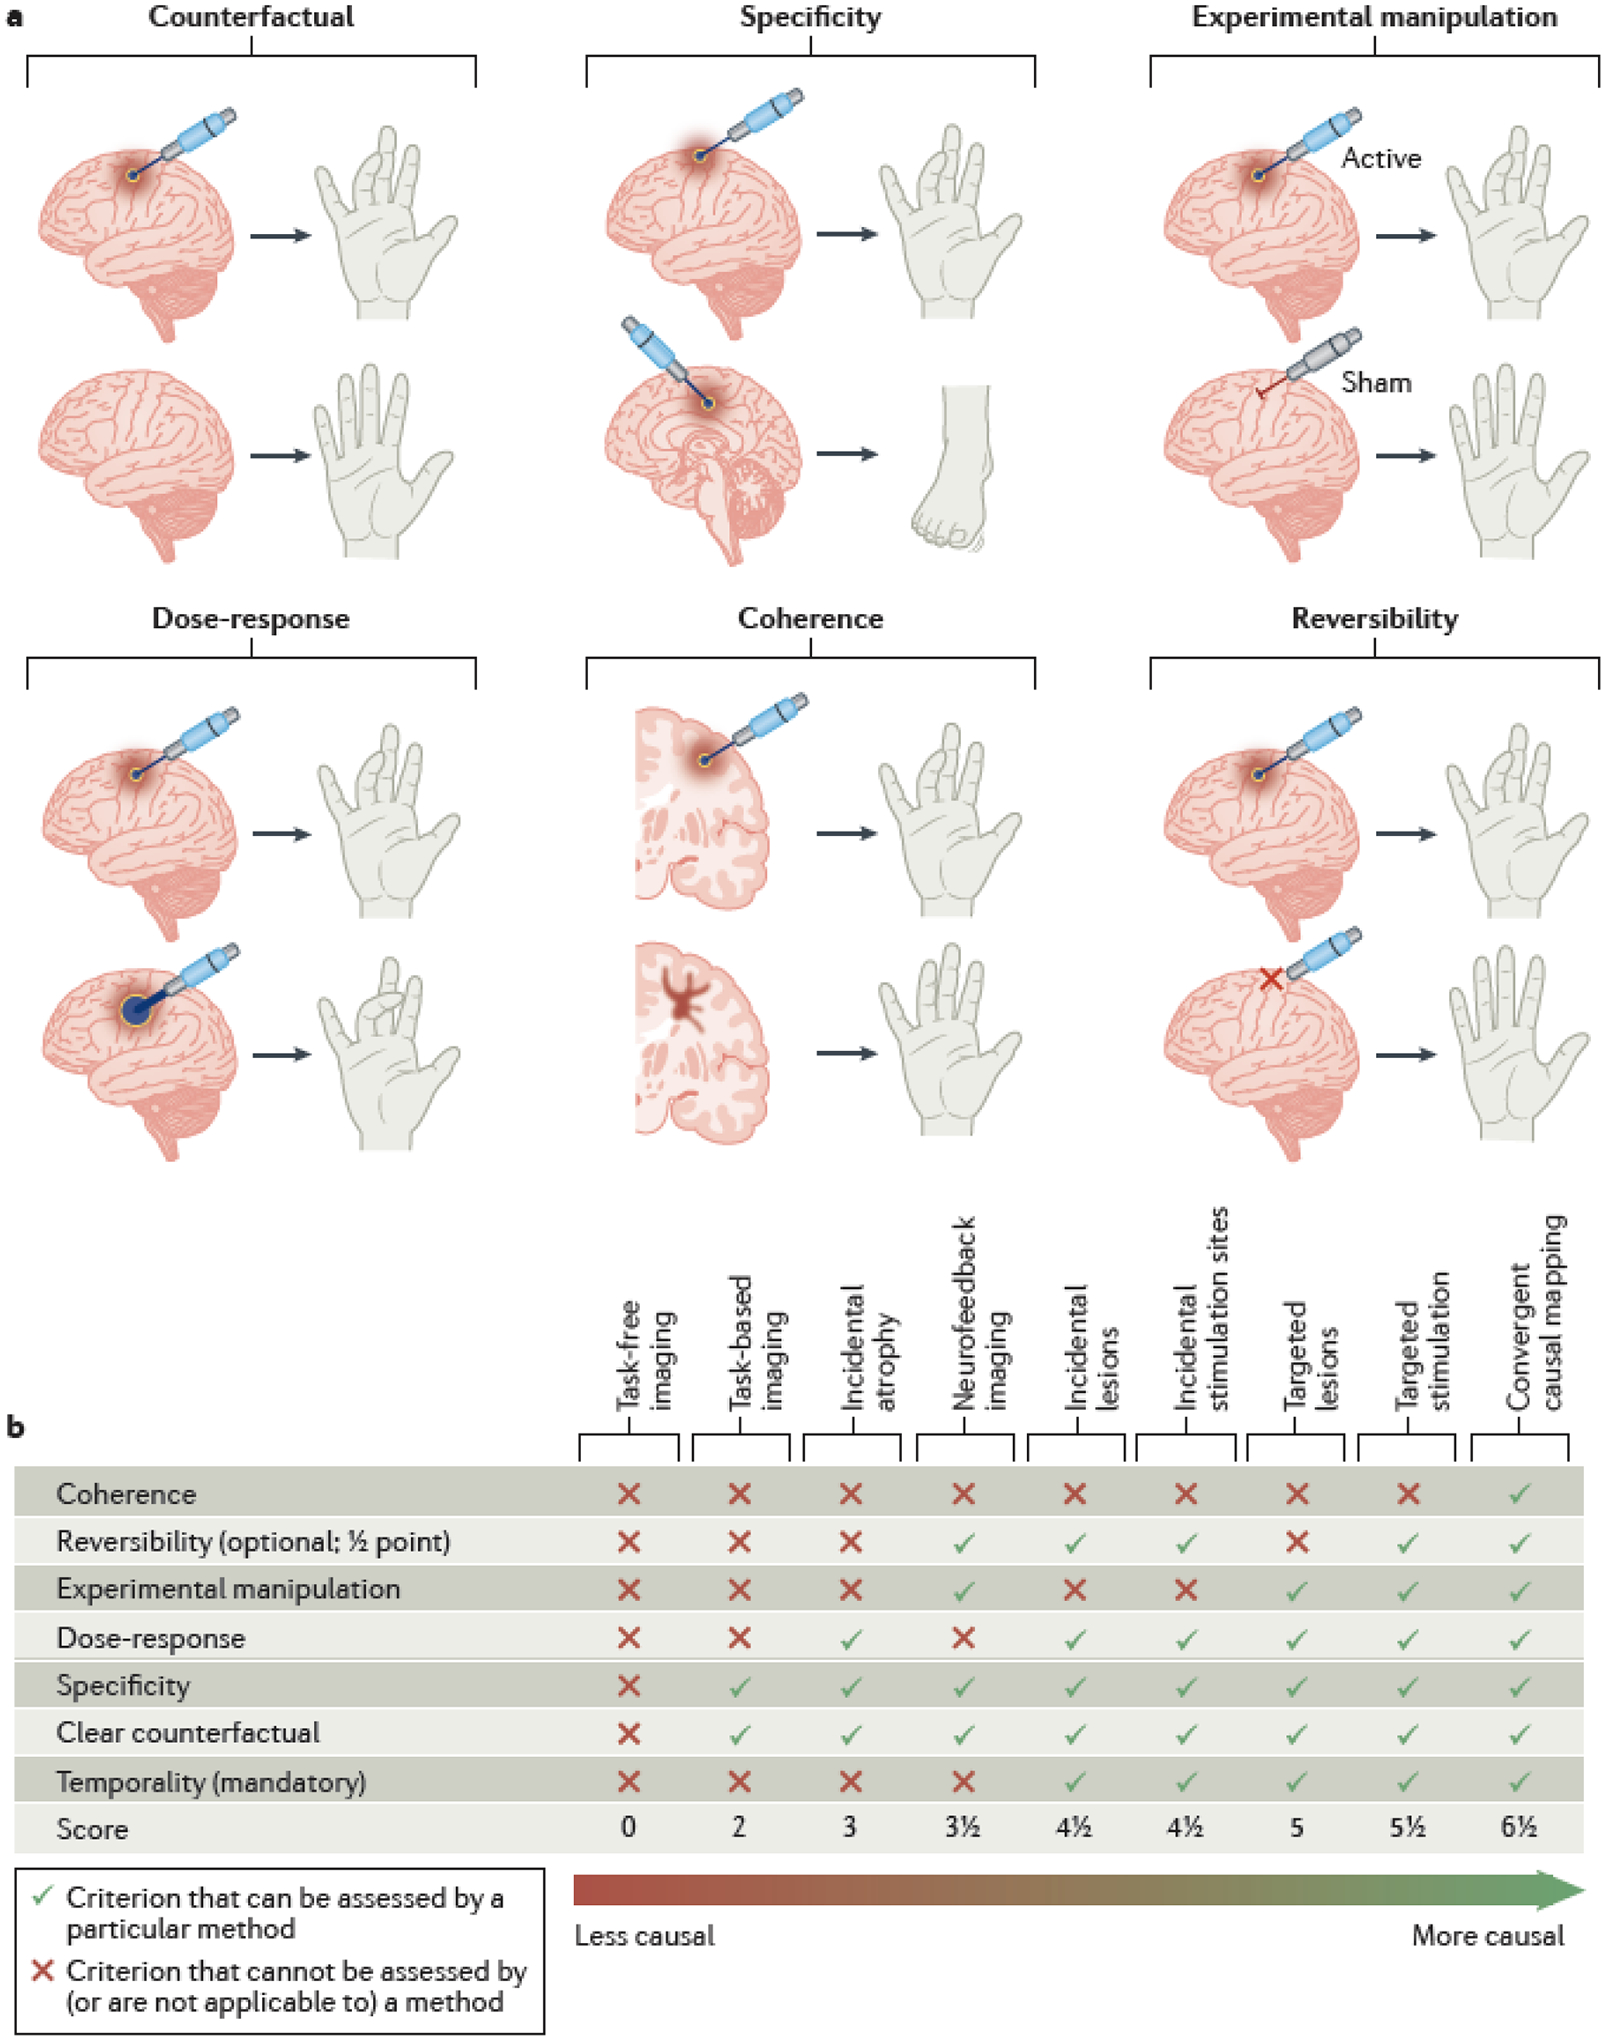
Mapping human brain function is a long-standing goal of neuroscience that promises to inform the development of new treatments for brain disorders. Early maps of human brain function were based on locations of brain damage or brain stimulation that caused a functional change. Over time, this approach was largely replaced by technologies such as functional neuroimaging, which identify brain regions in which activity is correlated with behaviours or symptoms. Despite their advantages, these technologies reveal correlations, not causation. This creates challenges for interpreting the data generated from these tools and using them to develop treatments for brain disorders. A return to causal mapping of human brain function based on brain lesions and brain stimulation is underway. New approaches can combine these causal sources of information with modern neuroimaging and electrophysiology techniques to gain new insights into the functions of specific brain areas. In this Review, we provide a definition of causality for translational research, propose a continuum along which to assess the relative strength of causal information from human brain mapping studies and discuss recent advances in causal brain mapping and their relevance for developing treatments.


Figures

Fig. 1 |
Fig. 1 |. Evolution of brain mapping literature since 1950.
In the late 20th century, the growth of neuroimaging literature coincided with a decline in brain lesion and brain stimulation literature. The data plotted on the figure were obtained by conducting a Google Ngram search using the terms ‘neuroimaging,’ ‘brain stimulation,’ and ‘brain lesion’, with the data binned to show between 1950–2019 and the smoothing set to 5.
Fig. 2 |
Fig. 2 |. Appraising causality in human brain mapping studies
a | Six criteria for appraising causality in human brain mapping studies, adapted from the Bradford-Hill criteria. Intracranial electrical stimulation is used to illustrate each of these criteria. A counterfactual can be estimated by modeling a hypothetical situation in which brain activity was not modulated or was modulated differently. Specificity can be demonstrated when slightly different interventions induce measurably different outcomes. For instance, stimulating different parts of the motor cortex leads to target-specific effects on motor function. An experimental manipulation can be used to selectively modulate activity in a specific brain region compared to a control intervention (in this case a sham). A dose-response relationship is evident when higher-intensity stimulation induces a higher intensity outcome, in this case a more intense muscle contraction. Coherence can be demonstrated if different approaches converge on similar results. For instance, if stimulating a location induces a finger movement, then a lesion at the same location should induce finger weakness. Reversibility can be illustrated by reversal of the behavior when the modification of brain function is discontinued. b | Our proposed causality continuum in human brain mapping. An example of how different brain mapping techniques may be appraised using criteria adapted from the Bradford-Hill criteria, ordered from least causal to most causal along a causality continuum. Targeted brain lesions and brain stimulation satisfy more causality criteria than other brain mapping techniques (described in Box 1 and Box 2).
Fig. 3 |
Fig. 3 |. Heteogeneous lesions causing the same symptom can complicate causal inference.
a | If lesions causing the same symptom (but not other lesions) intersect a common brain region (area of overlap for lesions 1–3; outlined in red), one can infer a causal role of this region in symptom generation. If other lesions causing the same symptom fail to intersect this brain region (lesions 4–6), this causal inference becomes weaker. b | If lesion locations causing the same symptom (but not any other lesions) are connected to a common hub region (lesions 1–6), then the connectivity with this hub region defines a brain network (orange) that encompasses all lesion locations causing the symptom. One can then infer a causal role of this brain network in symptom generation. Note that the hub region is not necessarily causally linked to the symptom, but rather defines a network that is causally linked to the symptom.
Fig. 4 |
Fig. 4 |. Coherence between LNM and iES studies.
a | Lesion network mapping (LNM) revealed that lesions causing decreased will to perform actions are connected to the anterior cingulate (warm colors). Intracranial electrical stimulation (iES) sites overlapping with this network (green circle) can induce a will to persevere, unlike other nearby iES sites (white). b | LNM revealed that lesions causing disordered face perception are connected to the right posterior fusiform gyrus (FG, warm colors). iES to the right posterior FG (green circle), but not the right anterior FG or the left FG (white circles), causes distorted face perception.
Fig. 5 |
Fig. 5 |. Coherence between TMS, DBS, and brain lesions.
A common brain circuit was connected to brain lesions that cause depression, TMS sites that relieve depression, and DBS sites that modify depression. a | For 461 incidental brain lesions (top left), whole-brain connectivity was estimated using a normative connectome database (top right). This connectivity map was compared with depression severity, yielding a map of the whole-brain circuit connected to lesions that increase depression severity (bottom). b | The same procedure was conducted for 151 incidentally-variable TMS sites, yielding a map of the whole-brain circuit connected to TMS sites that improve depression. The color scale was inverted for this map because TMS sites that improve depression were expected to be anti-correlated to lesion locations associated with lower depression severity. c | The same procedure was also conducted for 101 DBS sites, yielding a map of the whole-brain circuit connected to DBS sites that modify depression. These three maps were significantly more similar than expected by chance. Adapted with permission from REF. 95.

References

    1. Fox MD & Raichle ME Spontaneous fluctuations in brain activity observed with functional magnetic resonance imaging. Nature reviews neuroscience 8, 700–711 (2007). - PubMed
    1. Raichle ME A brief history of human brain mapping. Trends in neurosciences 32, 118–126 (2009). - PubMed
    1. Genon S, Reid A, Langner R, Amunts K & Eickhoff SB How to Characterize the Function of a Brain Region. Trends in Cognitive Sciences 22, 350–364, doi:10.1016/j.tics.2018.01.010 (2018). - DOI - PMC - PubMed
    1. Gusnard DA & Raichle ME Searching for a baseline: functional imaging and the resting human brain. Nature reviews neuroscience 2, 685–694 (2001). - PubMed
    1. Glasser MF et al. A multi-modal parcellation of human cerebral cortex. Nature 536, 171–178, doi:10.1038/nature18933 (2016). - DOI - PMC - PubMed

Publication types