

Monitoring Autophagy at Cellular and Molecular Level in Crassostrea gigas During an Experimental Ostreid Herpesvirus 1 (OsHV-1) Infection
- PMID: 35444958
- PMCID: PMC9014014
- DOI: 10.3389/fcimb.2022.858311
Monitoring Autophagy at Cellular and Molecular Level in Crassostrea gigas During an Experimental Ostreid Herpesvirus 1 (OsHV-1) Infection
Abstract
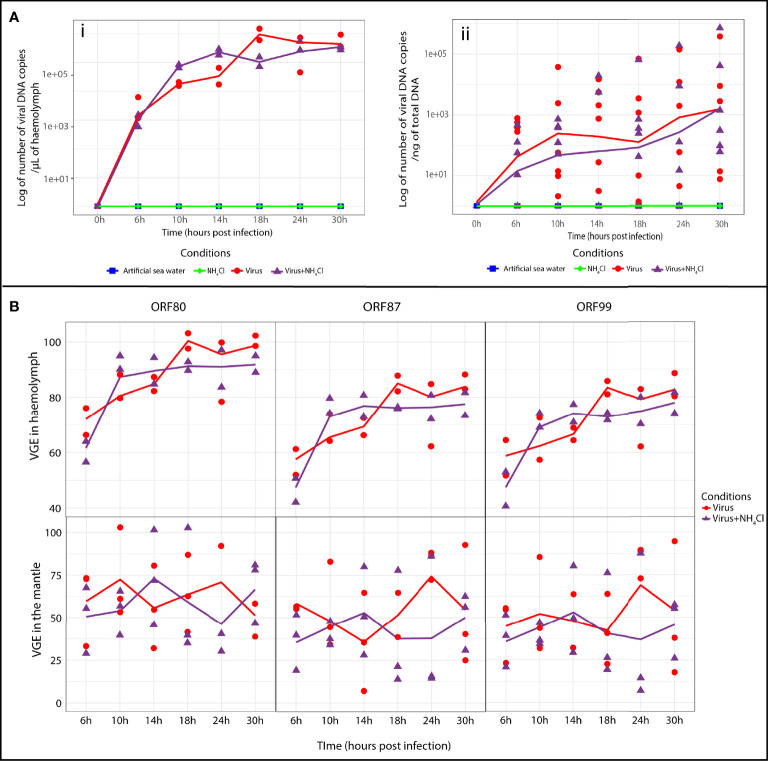
Mortality outbreaks of young Pacific oysters, Crassostrea gigas, have seriously affected the oyster-farming economy in several countries around the world. Although the causes of these mortality outbreaks appear complex, a viral agent has been identified as the main factor: a herpesvirus called ostreid herpesvirus 1 (OsHV-1). Autophagy is an important degradation pathway involved in the response to several pathologies including viral diseases. In C. gigas, recent studies indicate that this pathway is conserved and functional in at least haemocytes and the mantle. Furthermore, an experimental infection in combination with compounds known to inhibit or induce autophagy in mammals revealed that autophagy is involved in the response to OsHV-1 infection. In light of these results, the aim of this study was to determine the role of autophagy in the response of the Pacific oyster to infection by virus OsHV-1. For this purpose, an experimental infection in combination with a modulator of autophagy was performed on Pacific oysters known to have intermediate susceptibility to OsHV-1 infection. In haemolymph and the mantle, the autophagy response was monitored by flow cytometry, western blotting, and real-time PCR. At the same time, viral infection was evaluated by quantifying viral DNA and RNA amounts by real-time PCR. Although the results showed activation of autophagy in haemolymph and the mantle 14 hours post infection (after viral replication was initiated), they were also indicative of different regulatory mechanisms of autophagy in the two tissues, thus supporting an important function of autophagy in the response to virus OsHV-1.
Keywords: Pacific oyster (Crassostrea gigas); autophagy; herpesvirus; innate immunity; invertebrate.
Copyright © 2022 Picot, Faury, Pelletier, Arzul, Chollet, Dégremont, Renault and Morga.
Conflict of interest statement
The authors declare that the research was conducted in the absence of any commercial or financial relationships that could be construed as a potential conflict of interest.
Figures


Similar articles
-
Haemocytes collected from experimentally infected Pacific oysters, Crassostrea gigas: Detection of ostreid herpesvirus 1 DNA, RNA, and proteins in relation with inhibition of apoptosis.PLoS One. 2017 May 18;12(5):e0177448. doi: 10.1371/journal.pone.0177448. eCollection 2017. PLoS One. 2017. PMID: 28542284 Free PMC article.
-
Autophagy plays an important role in protecting Pacific oysters from OsHV-1 and Vibrio aestuarianus infections.Autophagy. 2015;11(3):516-26. doi: 10.1080/15548627.2015.1017188. Autophagy. 2015. PMID: 25714877 Free PMC article.
-
Comparative Proteomics of Ostreid Herpesvirus 1 and Pacific Oyster Interactions With Two Families Exhibiting Contrasted Susceptibility to Viral Infection.Front Immunol. 2021 Jan 18;11:621994. doi: 10.3389/fimmu.2020.621994. eCollection 2020. Front Immunol. 2021. PMID: 33537036 Free PMC article.
-
Propidium monoazide PCR, a method to determine OsHV-1 undamaged capsids and to estimate virus Lethal Dose 50.Virus Res. 2024 Feb;340:199307. doi: 10.1016/j.virusres.2023.199307. Epub 2024 Jan 4. Virus Res. 2024. PMID: 38160910 Free PMC article. Review.
-
The Pacific Oyster Mortality Syndrome, a Polymicrobial and Multifactorial Disease: State of Knowledge and Future Directions.Front Immunol. 2021 Feb 18;12:630343. doi: 10.3389/fimmu.2021.630343. eCollection 2021. Front Immunol. 2021. PMID: 33679773 Free PMC article. Review.
Cited by
-
LRSAM1 mediated the degradation of intracellular Vibrio through the ubiquitination-autophagy-lysosome pathway in oyster.Cell Commun Signal. 2025 Feb 25;23(1):110. doi: 10.1186/s12964-025-02111-4. Cell Commun Signal. 2025. PMID: 40001133 Free PMC article.
-
Inactivated ostreid herpesvirus-1 induces an innate immune response in the Pacific oyster, Crassostrea gigas, hemocytes.Front Immunol. 2023 Apr 28;14:1161145. doi: 10.3389/fimmu.2023.1161145. eCollection 2023. Front Immunol. 2023. PMID: 37187746 Free PMC article.
-
Diversity and functional specialization of oyster immune cells uncovered by integrative single-cell level investigations.Elife. 2025 May 9;13:RP102622. doi: 10.7554/eLife.102622. Elife. 2025. PMID: 40343849 Free PMC article.
-
Impact of Global Warming on the Severity of Viral Diseases: A Potentially Alarming Threat to Sustainable Aquaculture Worldwide.Microorganisms. 2023 Apr 17;11(4):1049. doi: 10.3390/microorganisms11041049. Microorganisms. 2023. PMID: 37110472 Free PMC article.
-
Seasonality in Synergism with Multi-Pathogen Presence Leads to Mass Mortalities of the Highly Endangered Pinna nobilis in Greek Coastlines: A Pathophysiological Approach.Microorganisms. 2023 Apr 25;11(5):1117. doi: 10.3390/microorganisms11051117. Microorganisms. 2023. PMID: 37317091 Free PMC article.
References
-
- Azéma P., Lamy J.-B., Boudry P., Renault T., Travers M.-A., Dégremont L. (2017). Genetic Parameters of Resistance to Vibrio Aestuarianus, and Oshv-1 Infections in the Pacific Oyster, Crassostrea Gigas, at Three Different Life Stages. Genet. Sel. Evol. 49, 1–16. doi: 10.1186/s12711-017-0297-2 - DOI - PMC - PubMed
-
- Berthelin C., Kellner K., Mathieu M. (2000). Storage Metabolism in the Pacific Oyster (Crassostrea Gigas) in Relation to Summer Mortalities and Reproductive Cycle (West Coast of France). Comp. Biochem. Physiol. Part B: Biochem. Mol. Biol. 125, 359–369. doi: 10.1016/S0305-0491(99)00187-X - DOI - PubMed
Publication types
MeSH terms
Substances
Supplementary concepts
LinkOut - more resources
Full Text Sources
Medical