. 2022 Jun 6;221(6):e202110151.
doi: 10.1083/jcb.202110151. Epub 2022 Apr 21.

Secretory autophagy maintains proteostasis upon lysosome inhibition

Affiliations

Secretory autophagy maintains proteostasis upon lysosome inhibition

Tina A Solvik et al. J Cell Biol. .

Abstract

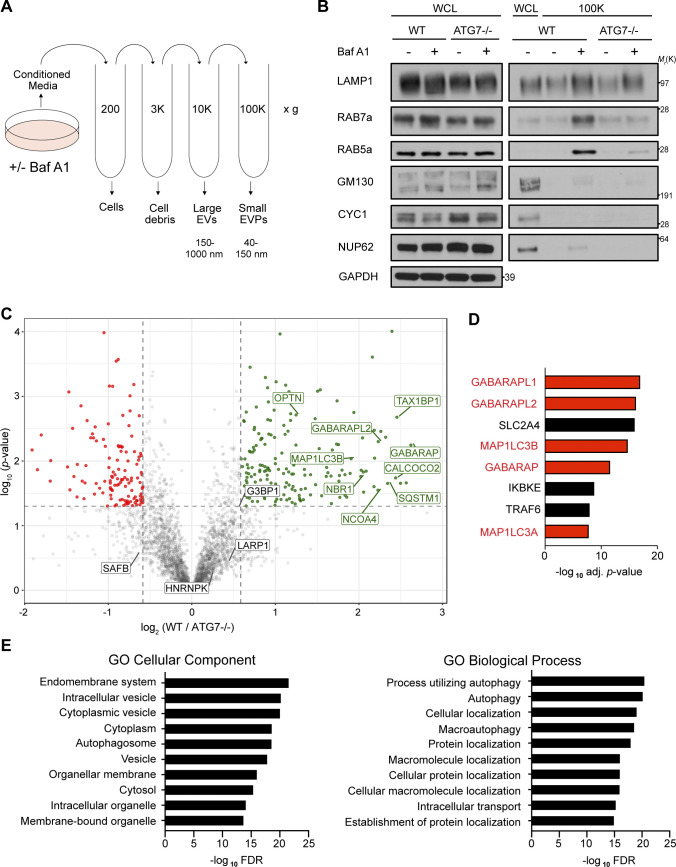
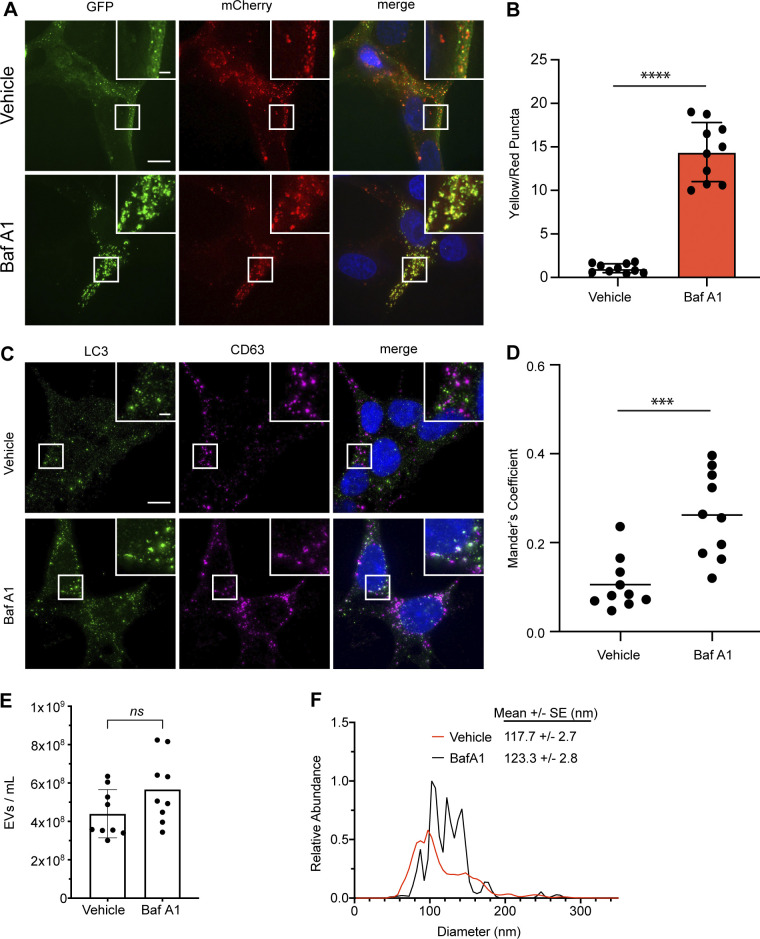
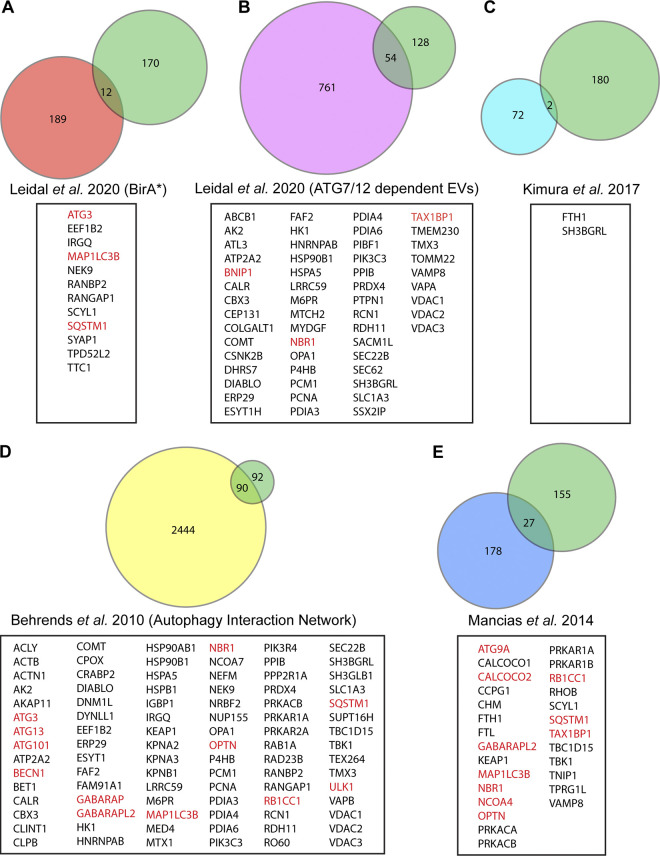
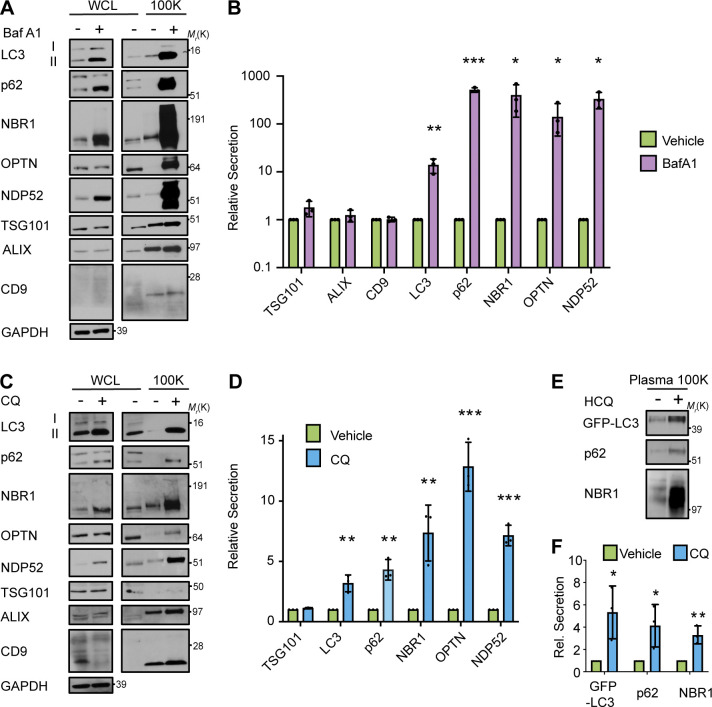
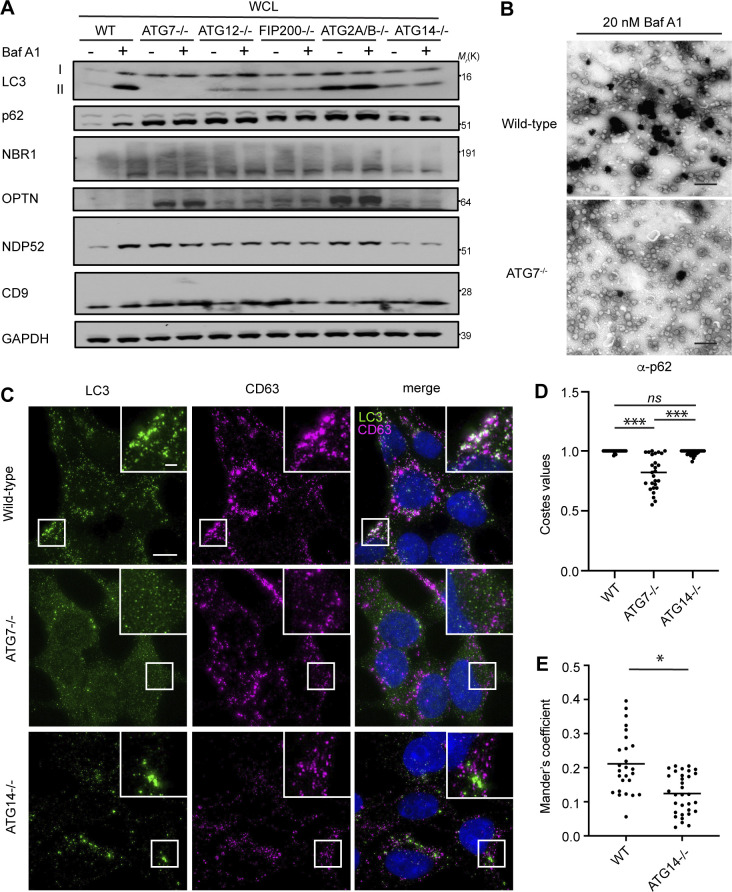
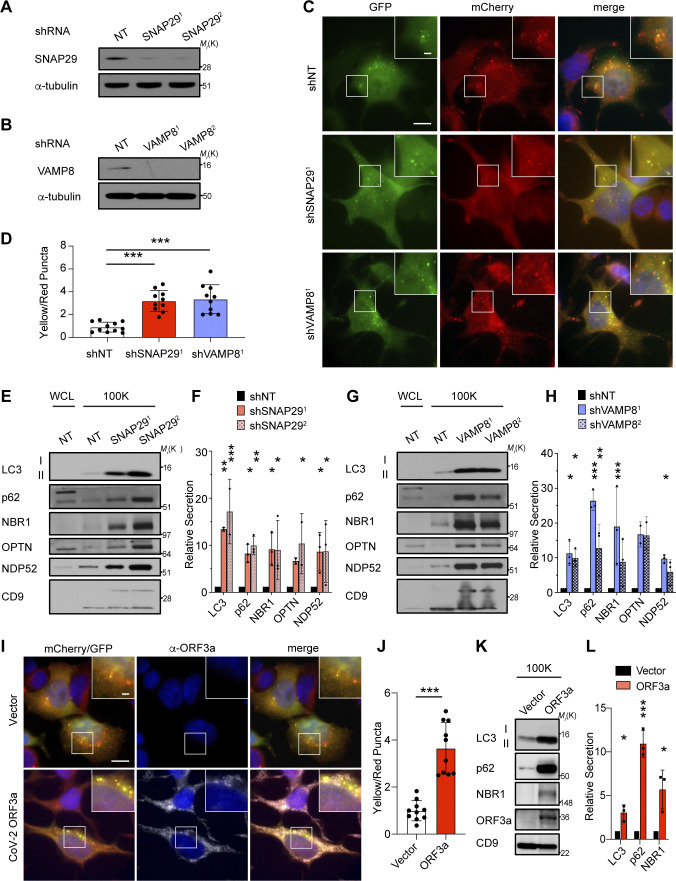
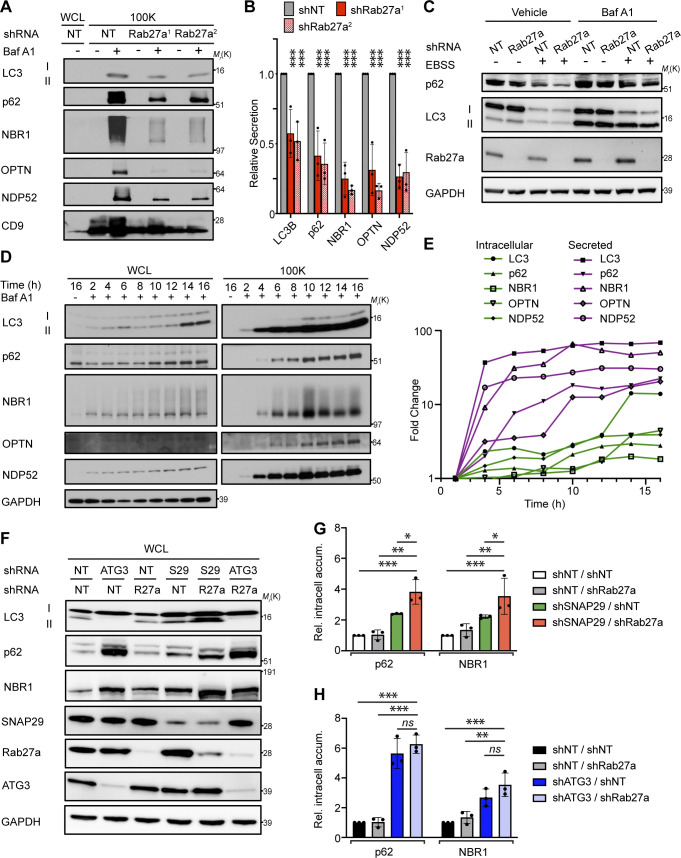
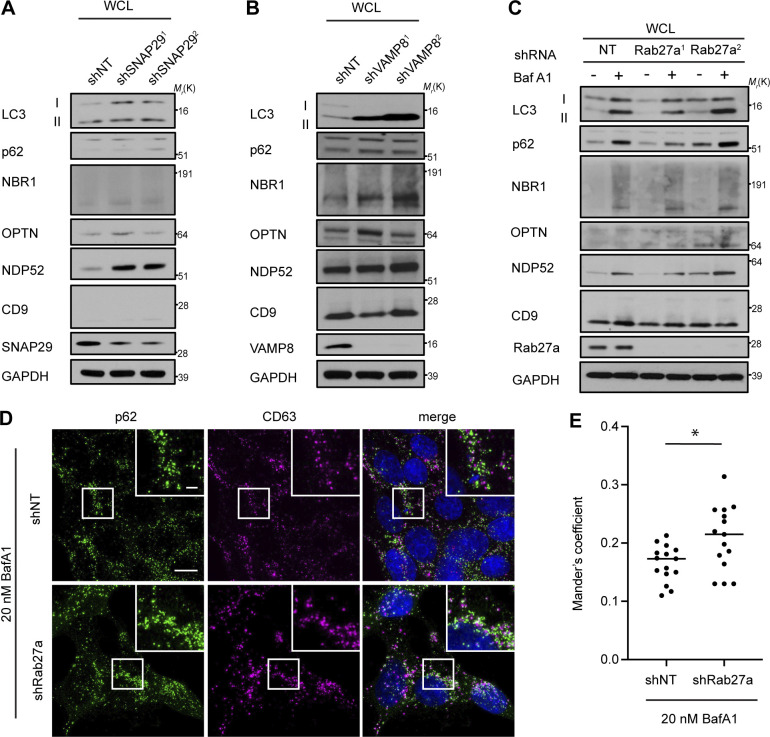
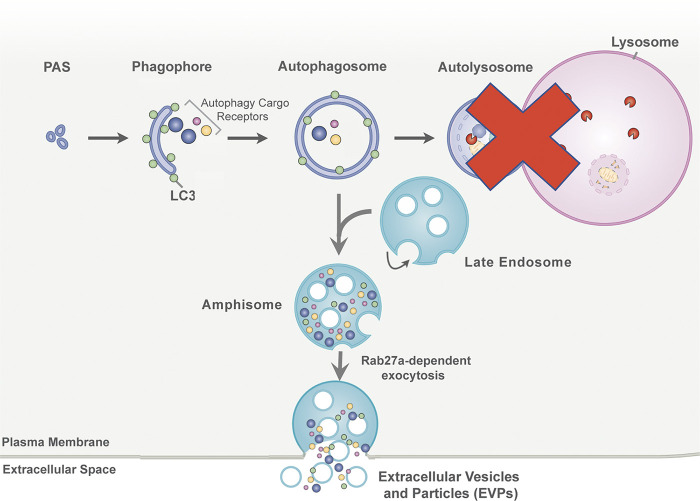
The endolysosome system plays central roles in both autophagic degradation and secretory pathways, including the release of extracellular vesicles and particles (EVPs). Although previous work reveals important interconnections between autophagy and EVP-mediated secretion, our understanding of these secretory events during endolysosome inhibition remains incomplete. Here, we delineate a secretory autophagy pathway upregulated in response to endolysosomal inhibition, which mediates EVP-associated release of autophagic cargo receptors, including p62/SQSTM1. This secretion is highly regulated and dependent on multiple ATGs required for autophagosome formation, as well as the small GTPase Rab27a. Furthermore, disrupting autophagosome maturation, either via genetic inhibition of autophagosome-to-autolysosome fusion or expression of SARS-CoV-2 ORF3a, is sufficient to induce EVP secretion of autophagy cargo receptors. Finally, ATG-dependent EVP secretion buffers against the intracellular accumulation of autophagy cargo receptors when classical autophagic degradation is impaired. Thus, we propose secretory autophagy via EVPs functions as an alternate route to clear sequestered material and maintain proteostasis during endolysosomal dysfunction or impaired autophagosome maturation.


Figures

Figure 1.
Figure 1.
BafA1-induced disruption of lysosome acidification promotes ATG-dependent secretion of autophagy cargo receptors via EVPs. (A) Schematic for the differential centrifugation protocol used to isolate small EVP-enriched fractions from cells treated with BafA1 or vehicle. (B) Cell lysate (WCL; left) and 100,000 g EVP fractions (100K; right) from WT and ATG7−/− serum starved HEK293T cells treated with 20 nM BafA1 or vehicle were collected, normalized and blotted to detect the indicated proteins (n = 3). (C) A volcano plot of the proteins identified in 100K EVP-enriched fractions from BafA1 treated WT and ATG7−/− HEK293T cells quantified by TMT MS. TMT-labeled proteins are plotted according to their −log10 P values as determined by two-tailed t test and log2 fold enrichment (WT/ATG7−/−; n = 3). Gray dots: proteins not enriched in EVPs from BafA1 treated WT or ATG7−/− cells identified with P > 0.05 and/or log2 fold change between −0.5 and 0.5. Green dots: proteins significantly enriched in EVPs from BafA1 treated WT cells relative to treated ATG7−/− cells. Red dots: proteins significantly enriched in EVPs from BafA1 treated ATG7−/− cells relative to treated WT cells. (D) A ranked list of the proteins with the greatest connectivity to the 182 proteins enriched in EVPs from BafA1 treated WT cells relative to treated ATG7−/− cells. Statistical significance was calculated in Enrichr by a one-way Fisher’s exact test. LC3 family members are highlighted in red. PPI, protein–protein interaction. (E) GO enrichment analysis of the 182 proteins enriched in EVPs from BafA1 treated WT cells relative to treated ATG7−/− cells with the top terms for cellular component (left) and biological processes (right) plotted according to −log10 FDR. Source data are available for this figure: SourceData F1.
Figure S1.
Figure S1.
BafA1 treatment inhibits autophagic flux and modulates EV secretion. (A) Representative images of WT HEK293T cells stably expressing the mCherry-EGFP-LC3 reporter were treated with 20 nM BafA1 or vehicle in serum-free media (BafA1) for 16 h. Scale bar, 10 μm; inset scale bar, 2 μm. (B) Quantification of the ratio of double-positive (mCherry+/GFP+) to mCherry-only (mCherry+/GFP−) LC3 puncta per cell. Statistical significance was calculated by unpaired two-tailed t test (mean ± SEM; vehicle, n = 10; BafA1, n = 10; ****, P < 0.001). (C) Representative images of WT HEK293T cells treated with 20 nM BafA1 or vehicle in serum-free media (BafA1) for 16 h and immunostained for endogenous LC3 and CD63. Scale bar, 10 μm; inset scale bar, 2 μm. (D) A scatter plot of Mander’s coefficients for the co-occurrence of LC3 with CD63 in the immunostained cells in C. Statistical significance was calculated by unpaired two-tailed t-test (mean ± SEM; Vehicle, n = 10; BafA1, n = 10; ***, P < 0.005). (E) Nanoparticle tracking analysis of conditioned media from equal numbers of WT cells treated with vehicle in serum-free media or 20 nM BafA1 (mean ± SEM; n = 3). Statistical significance calculated by unpaired two-tailed t test. (F) EV size distribution from indicated cell treatments in E (mean ± SEM; n = 3).
Figure 2.
Figure 2.
The ATG-dependent EVP secretome from BafA1 treated cells overlaps with previous proteomic analyses of the autophagy pathway. Venn diagrams showing: (A) The overlap of ATG-dependent EVP secretion candidates from BafA1 treated cells with the class I and class II BirA*-LC3B labeled secretome in Leidal et al. (2020). (B) The overlap of ATG-dependent EVP secretion candidates from BafA1 treated cells with the ATG7 and ATG12-dependent EV secretome in Leidal et al. (2020). (C) The overlap of ATG-dependent EVP secretion candidates from BafA1 treated cells with the ATG5-dependent bone-marrow–derived macrophage secretome in Kimura et al. (2017). (D) The overlap of ATG-dependent EVP secretion candidates from BafA1 treated cells with the autophagy interaction network defined in Behrends et al. (2010). (E) The overlap of ATG-dependent EVP secretion candidates from BafA1 treated cells with the autophagosome enriched proteome in Mancias et al. (2014). Core autophagy machinery and autophagy cargo receptors are highlighted in red.
Figure 3.
Figure 3.
Lysosomal inhibition broadly promotes secretion of autophagy cargo receptors via EVPs. (A) Cell lysate (WCL; left) and 100,000 g EVP fractions (100K; right) from serum-starved HEK293T cells treated with vehicle or 20 nM BafA1 for 16 h were collected and blotted for the indicated proteins (n = 3). (B) Quantification of the proteins in EVP fractions from BafA1 treated cells relative to controls in A. (mean ± SEM; n = 3; *, P < 0.05; **, P < 0.01; ***, P < 0.005). Statistical significance calculated by unpaired, two-tailed t test. (C) WCL (left) and 100K fractions (right) from serum starved HEK293T cells treated with vehicle or 25 µM CQ for 16 h were collected and blotted for the indicated proteins (n = 3). (D) Quantification of the proteins in EVP fractions from CQ treated cells relative to controls in C (mean ± SEM; n = 3; **, P < 0.01; ***, P < 0.005). Statistical significance calculated unpaired, two-tailed t test. (E) Plasma EVPs from mice treated with vehicle or 60 mg/kg hydroxychloroquine (HCQ) for three consecutive days were collected and blotted for the levels of GFP-LC3, p62, and NBR1. (F) Quantification of the indicated proteins in plasma EV fractions from mice treated with vehicle or CQ from E (mean ± SEM; n = 3; *, P < 0.05; **, P < 0.01). Statistics were calculated by unpaired, two-tailed t-test. Source data are available for this figure: SourceData F3.
Figure S2.
Figure S2.
Lysosomal inhibition has a negligible impact on cell death. (A) Quantification of cell death in WT cells prior to treatment (0 h) or treated with vehicle in serum-free media, or 20 nM BafA1 in serum-free media for 8 h using trypan blue staining (mean ± SEM; n = 3). (B) Quantification of cell death in WT cells prior to treatment (0 h) or treated with vehicle in serum-free media, or 25 µM CQ in serum-free media (BafA1) for 8 h using trypan blue staining (mean ± SEM; n = 3).
Figure S3.
Figure S3.
LC3 and autophagy cargo receptors are secreted in EVPs from diverse cell-types in response to lysosome inhibition. (A) 100,000 g EVP fractions (100K) from WT mouse R221A and human MDA-MB-231 breast cancer cell lines treated with vehicle or 20 nM BafA1 in serum-free media for 18 h were collected and blotted for indicated proteins (n = 3). (B) 100,000 g EVP fractions (100K) from WT mouse Neuro2a and human SH-SY5Y neuronal cell lines treated with vehicle or 20 nM BafA1 in serum free media for 18 h were collected and blotted for indicated proteins (n = 3). Source data are available for this figure: SourceData FS3.
Figure 4.
Figure 4.
Autophagy cargo receptors are secreted as EVP-associated proteins in response to lysosome inhibition. (A) Cell lysate (WCL) and fractionated conditioned media (CM) were collected from serum-starved HEK293Ts treated with vehicle or 20 nM BafA1 for 16 h. CM subjected to serial differential ultracentrifugation to recover large EVs (10,000 g; 10K), small EVPs (100,000 g; 100K), and precipitated free soluble protein (TCA). Equal protein from WCL and fractionated CM were probed for the indicated targets (n = 3). (B) Quantification of LC3 and autophagy cargo receptors in the indicated fractions of CM from serum-starved BafA1 treated cells relative to WCL (mean ± SEM; n = 3; ***, P < 0.005). Statistical significance between CM fractions was calculated by nonparametric one-way ANOVA with Dunnett’s post hoc test. (C) Small EVPs from CM separated via linear sucrose density gradient ultracentrifugation, fractionated, and blotted to detect LC3, autophagy cargo receptors, and CD9 (n = 3). (D) Percent of total secreted LC3, cargo receptors, and CD9 detected in gradient fractions (mean ± SEM; n = 4). (E) Representative blots of indicated proteins from untreated EVPs or EVPs incubated with 100 μg/ml trypsin and/or 1% Triton X-100 (TX-100) for 30 min at 4°C (n = 3). (F) Percent protease protection for indicated proteins in EVPs incubated with 100 μg/ml trypsin and/or 1% TX-100 (mean ± SEM; n = 3; *, P < 0.05; **, P < 0.01; ****, P < 0.001). Statistics calculated by nonparametric one-way ANOVA with Dunnett’s post hoc test. (G) Representative TEM of small EVPs collected from vehicle or 20 nM BafA1 treated cells immunostained with anti-p62 primary antibody and detected using ultrasmall gold-conjugated secondary antibody with silver enhancement (scale bar, 500 nm). Source data are available for this figure: SourceData F4.
Figure 5.
Figure 5.
Autophagy cargo receptor secretion during lysosome inhibition requires autophagosome formation. (A) Cell lysate (WCL; left) and 100,000 g EV fractions (100K; right) from serum-starved WT and ATG-deficient HEK293T cells treated with vehicle or 20 nM BafA1 for 16 h were blotted to detect LC3, autophagy cargo receptors, and CD9 (n = 4). (B) Quantification of the indicated proteins in EVP fractions from BafA1 treated cells relative to treated WT controls. Statistics were calculated by nonparametric one-way ANOVA coupled with Dunnett’s post hoc test (mean ± SEM; n = 4; ***, P < 0.005). (C) Representative fluorescence micrographs from serum-starved WT, ATG7−/−, and ATG14−/− cells treated with 20 nM BafA1 and immunostained for endogenous p62 (green), CD63 (magenta), and LC3. Immunofluorescence micrographs of endogenous LC3 and CD63 from these exact cell samples and corresponding co-occurrence data can be found in Fig. S4, C–E. Scale bar, 10 μm; inset scale bar, 2 μm. (D) Scatter plot of Mander’s coefficients for the co-occurrence of p62 and CD63 in C. Statistics were calculated by nonparametric one-way ANOVA with Dunnett’s post hoc test (mean ± SEM; WT n = 26; ATG7−/− n = 26, ATG14−/−, n = 32; ***, P < 0.005). (E) Representative images from TEM of late endosomes from vehicle or 20 nM BafA1 treated cells that were immunostained with anti-p62 primary antibody and detected using ultrasmall gold-conjugated secondary antibody with silver enhancement (scale bar, 500 nm). Source data are available for this figure: SourceData F5.
Figure S4.
Figure S4.
Autophagosome formation is required for autophagy cargo receptor secretion in response to lysosome inhibition. (A) WCL from serum-starved HEK293Ts of the indicated genotypes treated with or without 20 nM BafA1 and corresponding to secretion experiments in Fig. 5, A and B, were collected and immunoblotted for LC3, autophagy cargo receptors, CD9, and GAPDH. (B) Representative images from transmission EM of small EVPs collected from 20 nM BafA1 treated WT and ATG7−/− cells that were immunostained with primary antibody against p62/SQSTM1 and detected with ultrasmall gold-conjugated secondary antibody with silver enhancement (scale bar, 500 nm). (C) Representative fluorescence micrographs from serum-starved WT, ATG7−/−, and ATG14−/− cells treated with 20 nM BafA1 and immunostained for endogenous LC3 (green), CD63 (magenta), and p62. Immunofluorescence micrographs of endogenous p62 and CD63 from these exact cell samples and corresponding co-occurrence data can be found in Fig. 5, C and D. Scale bar, 10 μm; inset scale bar, 2 μm. (D) A scatter plot of the P values obtained from Costes significance tests to assess whether the overlap of LC3 and CD63 staining observed in C exceeds thresholds of random co-occurrence. Statistical significance was calculated by nonparametric two-way ANOVA with Tukey’s post hoc test (mean ± SEM; WT, n = 26; ATG7−/−, n = 26; ATG14−/−, n = 32; ***, P < 0.005). (E) A scatter plot of Mander’s coefficients for the co-occurrence of LC3 with CD63 in BafA1 treated WT and ATG14−/− cells in C. Statistical significance was calculated by an unpaired two-tailed t test (mean ± SEM; WT, n = 26; ATG14−/−, n = 32; *, P < 0.05). Source data are available for this figure: SourceData FS4.
Figure 6.
Figure 6.
Genetic inhibition of autophagosome–lysosome fusion promotes the secretion autophagy cargo receptors via EVPs. (A) Lysate from cells stably expressing control shRNA or SNAP29 shRNA (SNAP291; SNAP292) was blotted for SNAP29 and α-tubulin. (B) Lysate from cells expressing control shRNA or VAMP8 shRNA (VAMP81; VAMP82) blotted for VAMP8 and α-tubulin. (C) Representative images of cells stably expressing the mCherry-EGFP-LC3 reporter and control shRNA (shNT), SNAP29 shRNA (shSNAP291), or VAMP8 shRNA (shVAMP81). Scale bar, 10 μm; inset scale bar, 2 μm. (D) Quantification of the ratio of double-positive (mCherry+;EGFP+) yellow puncta to mCherry only (mCherry+;EGFP−) red puncta in cells stably co-expressing the mCherry-EGFP-LC3 reporter and the indicated shRNAs from C. (mean ± SEM; shNT, n = 10; shSNAP291, n = 10, shVAMP81, n = 10; ***, P < 0.005). Statistics were calculated by nonparametric one-way ANOVA with Dunnett’s post hoc test. (E) Cell lysate (WCL; left) and 100,000 g EVP fractions (100K; right) from serum-starved cells expressing control shRNA (NT) or SNAP29 shRNA (shSNAP291; shSNAP292) was blotted for the indicated proteins. (F) Quantification of the proteins in EVPs from cells expressing SNAP29 shRNA relative to control shRNA (shNT) in E. Statistics were calculated by nonparametric one-way ANOVA with Dunnett’s post hoc test (mean ± SEM; n = 3; *, P < 0.05; **, P < 0.01; ***, P < 0.005). (G) WCL (left) and 100K fractions (right) from serum starved cells expressing control shRNA (NT) or VAMP8 shRNA (shVAMP81; shVAMP82) was blotted for the indicated proteins. (H) Quantification of the proteins in EVPs from cells expressing VAMP8 shRNA relative to control shRNA (shNT) in G. Statistics were calculated by nonparametric one-way ANOVA with Dunnett’s post hoc test (mean ± SEM; n = 3; *, P < 0.05; **, P < 0.01; ***, P < 0.005). (I) Representative images of cells that stably co-express the mCherry-EGFP-LC3 reporter and SARS-CoV-2 ORF3a (2xStrepTag) or vector controls stained with anti-StrepTag antibody. Scale bar, 10 μm; inset scale bar, 2 μm. (J) Quantification of the ratio of double-positive (mCherry+;EGFP+) yellow puncta to mCherry only (mCherry+;EGFP−) red puncta in cells stably co-expressing the mCherry-EGFP-LC3 reporter and ORF3a or vector in I. Statistical significance was calculated by unpaired two-tailed t-test (mean ± SEM; vector, n = 10; ORF3a, n = 10; ***, P < 0.005). (K) 100K fractions from serum starved cells expressing ORF3a (2xStrepTag) or vector were collected and blotted for the indicated proteins. (L) Quantification of LC3, p62, and NBR1 in EVPs from cells stably expressing ORF3a or vector in K. Statistics were calculated by unpaired two-tailed t test (mean ± SEM; n = 3; *, P < 0.05; ***, P < 0.005). Source data are available for this figure: SourceData F6.
Figure 7.
Figure 7.
Rab27a is required for EVP secretion of autophagy cargo receptors in response to lysosome inhibition and impaired autophagosome maturation. (A) WCL (left) and 100,000 g EVP fractions (100K; right) from serum-starved cells expressing control shRNA (NT) or Rab27a shRNA (shRab27a1; shRab27a2) were collected and blotted for indicated proteins. (B) Quantification of indicated proteins in EVPs from cells expressing SNAP29 shRNA relative to control shRNA (shNT) in A. Statistics were calculated by nonparametric one-way ANOVA with Dunnett’s post hoc test (mean ± SEM; n = 3; ***, P < 0.005). (C) Cells expressing control shRNA (NT) or Rab27a shRNA were EBSS starved for 12 h, lysed, and blotted for the indicated proteins. BafA1 = 50 nM, BafA1 added 1 h before lysis (n = 3). (D) WCL (left) and 100K fractions (right) from serum starved cells treated with 20 nM BafA1 were collected at the indicated times after treatment and blotted for LC3, autophagy cargo receptors, and GAPDH. (E) Quantification of the fold change in intracellular levels (green lines) and EVP-mediated secretion (secreted; shapes with magenta lines) for the indicated proteins relative to levels at 2 h after treatment with BafA1 in D. (F) WCL from cells stably expressing the indicated combinations of control shRNA (NT) and shRNAs targeting ATG3, Rab27a (R27a), and SNAP29 (S29) collected 8 h after starvation and blotted for indicated proteins. (G) Quantification of p62 and NBR1 in WCL from starved cells co-expressing control shRNA and Rab27a shRNA (shNT/shRab27a), SNAP29 shRNA and control shRNA (shSNAP29/shNT), or SNAP29 shRNA and Rab27a shRNA (shSNAP29/shRab27a) relative to shRNA controls (shNT/shNT) in F. Statistics were calculated by nonparametric one-way ANOVA coupled with Dunnett’s post hoc test (mean ± SEM; n = 3; *, P < 0.05; **, P < 0.01; ***, P < 0.005). (H) Quantification of p62 and NBR1 in WCL from starved cells co-expressing control shRNA and Rab27a shRNA (shNT/shRab27a), ATG3 shRNA and control shRNA (shATG3/shNT) or ATG3 shRNA and Rab27a shRNA (shATG3/shRab27a) relative to shRNA controls (shNT/shNT) in F. Statistics were calculated by nonparametric one-way ANOVA coupled with Dunnett’s post hoc test (mean ± SEM; n = 3; **, P < 0.01; ***, P < 0.005). Source data are available for this figure: SourceData F7.
Figure S5.
Figure S5.
Rab27a is required for autophagy cargo receptor secretion in response to lysosome inhibition. (A) WCL from serum-starved HEK293 Ts that stably express shRNAs targeting SNAP29 (shSNAP291; shSNAP292) or control shRNA (shNT) and corresponding to secretion experiments in Fig. 6, E and F, were immunoblotted for the indicated proteins. (B) WCL from serum-starved HEK293Ts that stably express shRNAs targeting VAMP8 (shVAMP81; shVAMP82) or control shRNA (shNT) and corresponding to secretion experiments in Fig. 6, E and F were immunoblotted for the indicated proteins. (C) WCL from serum-starved HEK293Ts that stably express shRNAs targeting Rab27a (Rab27a1; Rab27a2) or control shRNA (NT) and corresponding to secretion experiments in Fig. 6, E and F, were immunoblotted for the indicated proteins. (D) Representative fluorescence micrographs from cells expressing control shRNA (shNT) or shRNA targeting Rab27a (shRab27a) treated with 20 nM BafA1 and immunostained for endogenous p62 (green) and CD63 (magenta). Scale bar, 10 μm; inset scale bar, 2 μm. (E) Scatter plot of Mander’s coefficients for the co-occurrence of p62 with CD63 in BafA1 treated cells expressing control shRNA (shNT) or Rab27a shRNA (shRab27a) in C. Statistical significance was calculated by an unpaired two-tailed student’s t test (mean ± SEM; shNT, n = 10; shRab27a, n = 10; *, P < 0.05). Source data are available for this figure: SourceData FS5.
Figure 8.
Figure 8.
SALI. In response to lysosome inhibition or impaired autophagosome maturation, autophagic intermediates containing autophagy cargo receptor proteins are diverted to late endosomes. Within these autophagosome–late endosome hybrid organelles, termed amphisomes, autophagy cargo receptors intermix with intraluminal vesicles that are formed through intraluminal budding mechanisms. The contents of amphisomes are subsequently released as EVPs via Rab27a-dependent exocytosis at the plasma membrane.

Comment in

References

    1. Amaravadi, R.K., Kimmelman A.C., and Debnath J.. 2019. Targeting autophagy in cancer: recent advances and future directions. Cancer Discov. 9:1167–1181. 10.1158/2159-8290.CD2159-19-0292 - DOI - PMC - PubMed
    1. Behrends, C., Sowa M.E., Gygi S.P., and Harper J.W.. 2010. Network organization of the human autophagy system. Nature. 466:68–76. 10.1038/nature09204 - DOI - PMC - PubMed
    1. Bel, S., Pendse M., Wang Y., Li Y., Ruhn K.A., Hassell B., Leal T., Winter S.E., Xavier R.J., and Hooper L.V.. 2017. Paneth cells secrete lysozyme via secretory autophagy during bacterial infection of the intestine. Science. 357:1047–1052. 10.1126/science.aal4677 - DOI - PMC - PubMed
    1. Bjorkoy, G., Lamark T., Brech A., Outzen H., Perander M., Overvatn A., Stenmark H., and Johansen T.. 2005. p62/SQSTM1 forms protein aggregates degraded by autophagy and has a protective effect on huntingtin-induced cell death. J. Cell Biol. 171:603–614. 10.1083/jcb.200507002 - DOI - PMC - PubMed
    1. Cashikar, A.G., and Hanson P.I.. 2019. A cell-based assay for CD63-containing extracellular vesicles. PLoS One. 14:e0220007. 10.1371/journal.pone.0220007 - DOI - PMC - PubMed

Publication types