. 2022 Apr 26;119(17):e2117814119.
doi: 10.1073/pnas.2117814119. Epub 2022 Apr 21.

Stabilizing microbial communities by looped mass transfer

Affiliations

Stabilizing microbial communities by looped mass transfer

Shuang Li et al. Proc Natl Acad Sci U S A. .

Abstract

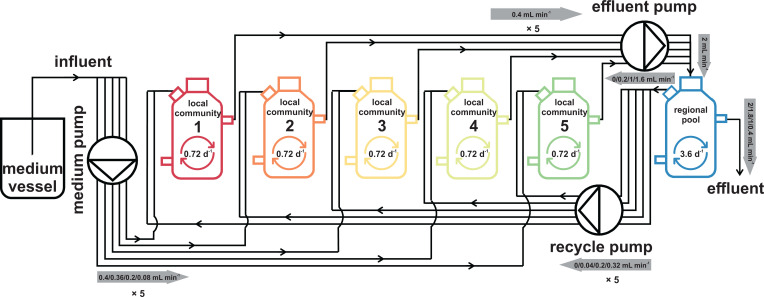
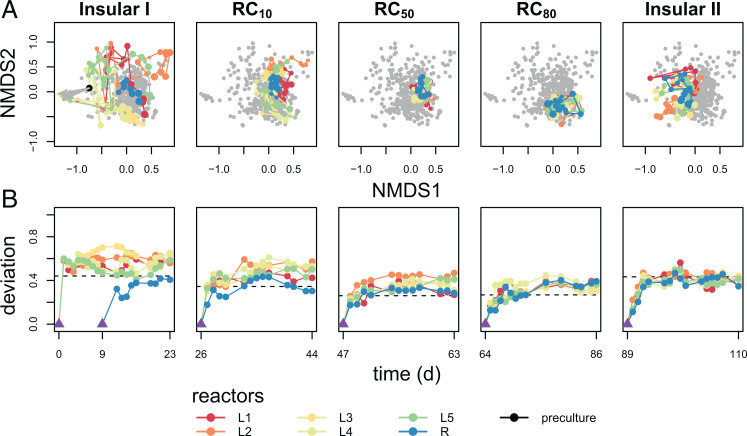
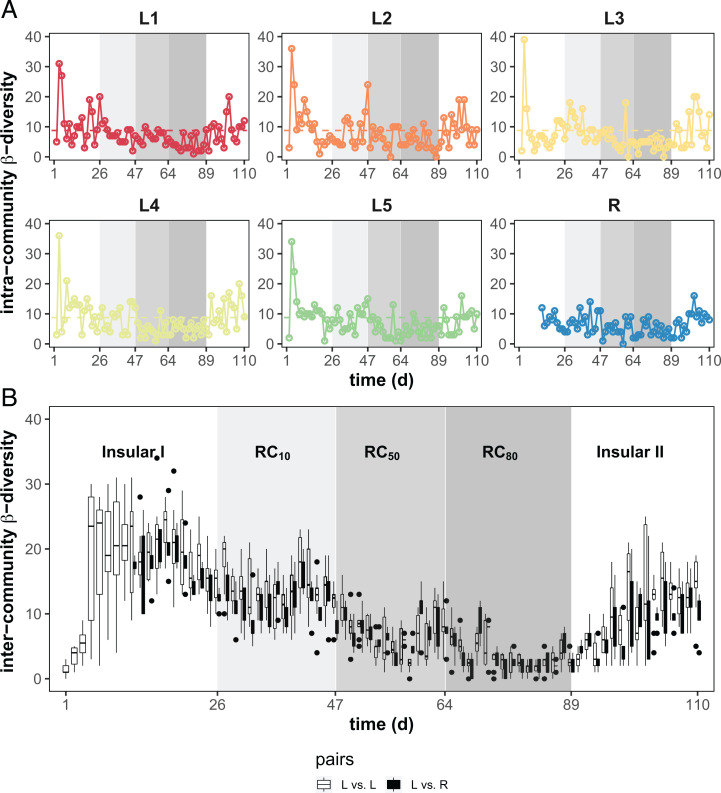
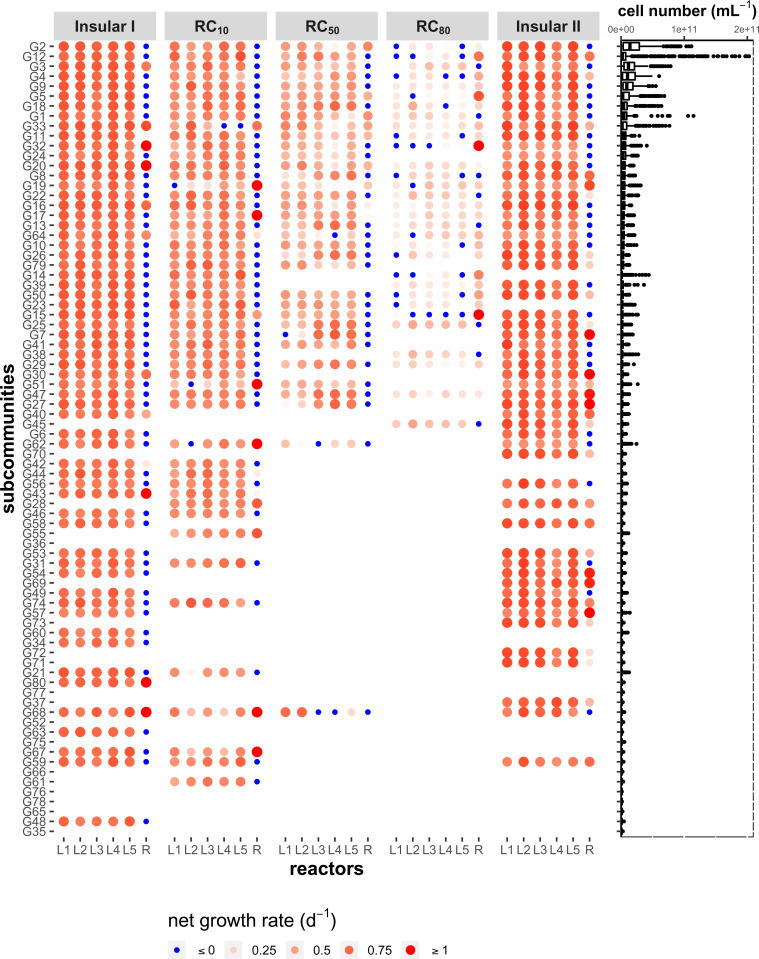
Building and changing a microbiome at will and maintaining it over hundreds of generations has so far proven challenging. Despite best efforts, complex microbiomes appear to be susceptible to large stochastic fluctuations. Current capabilities to assemble and control stable complex microbiomes are limited. Here, we propose a looped mass transfer design that stabilizes microbiomes over long periods of time. Five local microbiomes were continuously grown in parallel for over 114 generations and connected by a loop to a regional pool. Mass transfer rates were altered and microbiome dynamics were monitored using quantitative high-throughput flow cytometry and taxonomic sequencing of whole communities and sorted subcommunities. Increased mass transfer rates reduced local and temporal variation in microbiome assembly, did not affect functions, and overcame stochasticity, with all microbiomes exhibiting high constancy and increasing resistance. Mass transfer synchronized the structures of the five local microbiomes and nestedness of certain cell types was eminent. Mass transfer increased cell number and thus decreased net growth rates μ′. Subsets of cells that did not show net growth μ′SCx were rescued by the regional pool R and thus remained part of the microbiome. The loop in mass transfer ensured the survival of cells that would otherwise go extinct, even if they did not grow in all local microbiomes or grew more slowly than the actual dilution rate D would allow. The rescue effect, known from metacommunity theory, was the main stabilizing mechanism leading to synchrony and survival of subcommunities, despite differences in cell physiological properties, including growth rates.

Keywords: metacommunity assembly; microbial community cytometry; microbial ecology; single-cell analytics; stability.


Conflict of interest statement

The authors declare no competing interest.

Figures

Fig. 1.
Fig. 1.
Scheme of the reactor setup. The six reactors were run under the same environmental conditions. The five local community reactors L1–L5 were run in an identical mode. The sixth reactor served as the regional pool R and was fed by the effluents of the local communities L1–L5. The dilution rate per reactor is shown within the reactor schemes. A medium pump controlled the medium flow rate from the medium vessel to local communities L1–L5. An effluent pump controlled the effluent rate from the local communities to the regional pool R. A recycle pump controlled the recycling flow rate from the regional pool R to the local communities L1–L5. The flow rates are labeled with a gray arrow that indicates the flow direction.
Fig. 2.
Fig. 2.
Microbiome dynamics in the five reactors L1–L5 and regional pool R. Microbiome dynamics were measured by flow cytometry. The plots represent the five different phases of the experiment. In phase 1 (Insular I), L1–L5 were isolated. In phases 2 to 4, the recycling flow rate from reactor R increased sequentially from 10 to 80% (RC10 to RC80). Phase 5 (Insular II) was again without recycling. (A) The nonmetric multidimensional scaling (NMDS) plots in the upper row show the increasing similarity of communities, both within and between reactors, with increasing recycling rate RC, while similarity was quickly lost when recycling from reactor R stopped. Connected time points indicate the assembly trajectory of microbiomes. Points in gray represent samples from the other phases. The NMDS plots were created using relative cell numbers of all SCs based on Bray–Curtis distance measure (try = 100, trymax = 200). (B) Deviation of microbiome structure from the endpoints of respective previous phases (purple triangle) based on Canberra distance. The purple triangle in the Insular I phase represents the inoculum.
Fig. 3.
Fig. 3.
Intra- and intercommunity β-diversity characteristics of local microbiomes L1–L5 and the regional pool R. (A) Variation of intracommunity β-diversity over time. The number of unique dominant SCs was determined in pairwise successive samples within a microbiome. The threshold value was 8.76 and used to distinguish drift events from intrinsic cellular fluctuations during balanced growth condition (horizontal dashed line). The intracommunity β-diversity values were reduced and showed fewer drift events under RC50 and RC80 conditions compared with other phases. (B) Variation of intercommunity β-diversity over time. Numbers of SCs were determined that were not shared in pairwise samples at the same time point between local microbiomes L vs. L (open symbols) and L vs. R (closed symbols). An increase in recycling rates RC lowered intercommunity β-diversity to a high degree. The shaded areas represent different phases with changes in RC.
Fig. 4.
Fig. 4.
Cell numbers of SCs and net growth rates μSCx (x = 1 to 80), determined for the balanced periods of the different phases in the local communities L1–L5 and the regional pool (R). On the left, the net growth rate μSCx (day−1) is presented only for dominant SCs with relative abundances >1.25% in at least one sample during the corresponding periods in L1–L5 and R. The color gradient and size of the red circles represent the value of positive μSCx. Darker colors and larger circles indicate higher μSCx values for positive net growth. All blue circles represent zero net growth μSCx. The SCs are ranked in descending order according to their mean cell number (cells per milliliter) for all days and all reactors. Cell numbers of x = 80 SCs of a total of 421 samples are shown as a boxplot on the right. Outliers of deviated cell number values are shown as points.

References

    1. Grimm V., Wissel C., Babel, or the ecological stability discussions: An inventory and analysis of terminology and a guide for avoiding confusion. Oecologia 109, 323–334 (1997). - PubMed
    1. Liu Z., et al. , Ecological stability properties of microbial communities assessed by flow cytometry. MSphere 3, e00564-17 (2018). - PMC - PubMed
    1. Weise H., et al. , Resilience trinity: Safeguarding ecosystem functioning and services across three different time horizons and decision contexts. Oikos 129, 445–456 (2020).
    1. Angenent L. T., Magdalena J. A., Jeon B. S., Usack J. G., Eco-mimicry opens new doors for bioprocess engineers. Joule 4, 2074–2077 (2020).
    1. D’Hondt K., et al. , Microbiome innovations for a sustainable future. Nat. Microbiol. 6, 138–142 (2021). - PubMed

Publication types