. 2022 Jun 8;7(11):e157608.
doi: 10.1172/jci.insight.157608.

Immune and epithelial determinants of age-related risk and alveolar injury in fatal COVID-19

Affiliations

Immune and epithelial determinants of age-related risk and alveolar injury in fatal COVID-19

Michael Chait et al. JCI Insight. .

Abstract

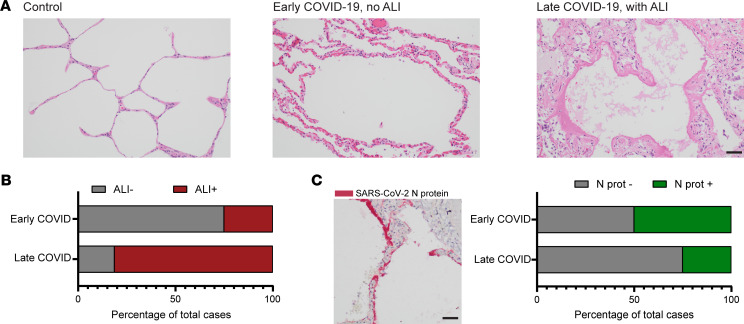
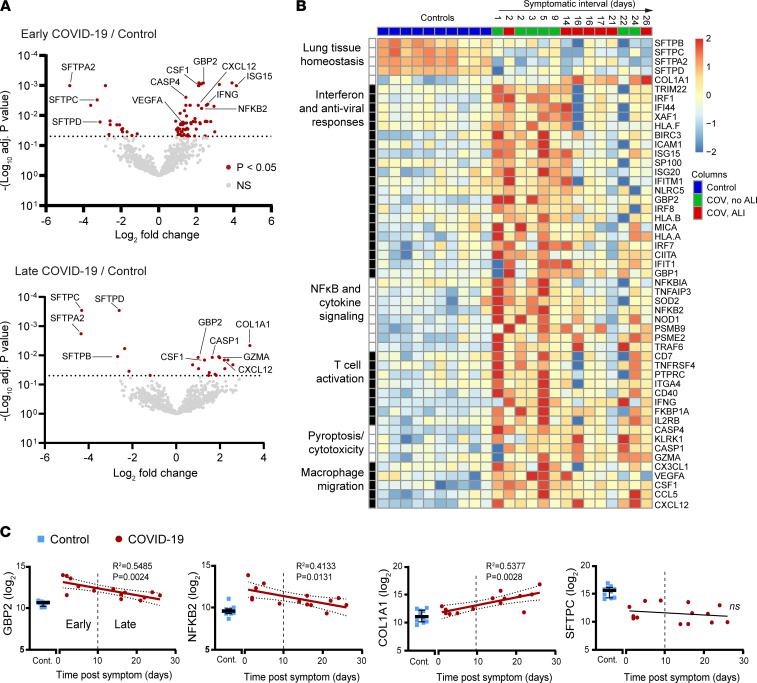
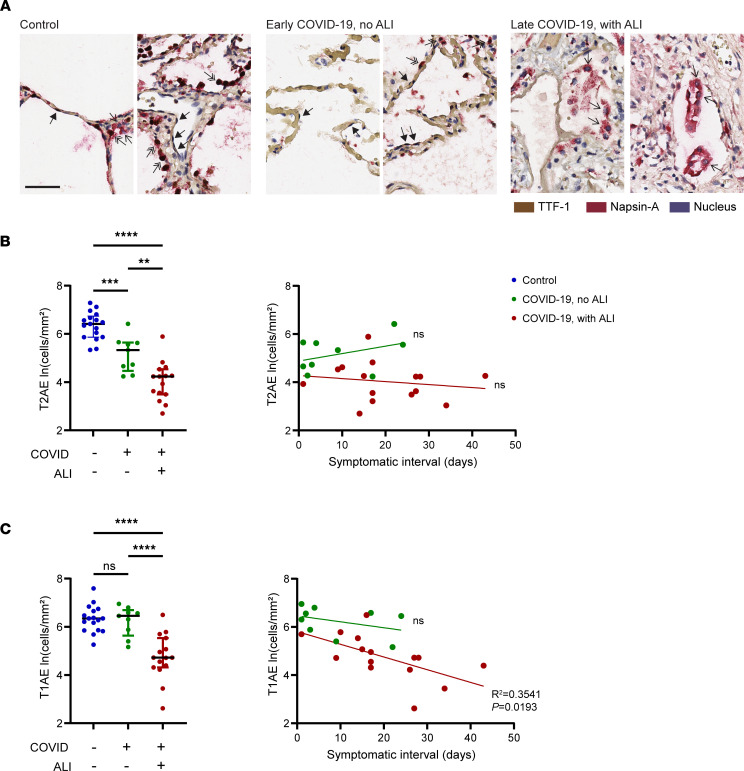
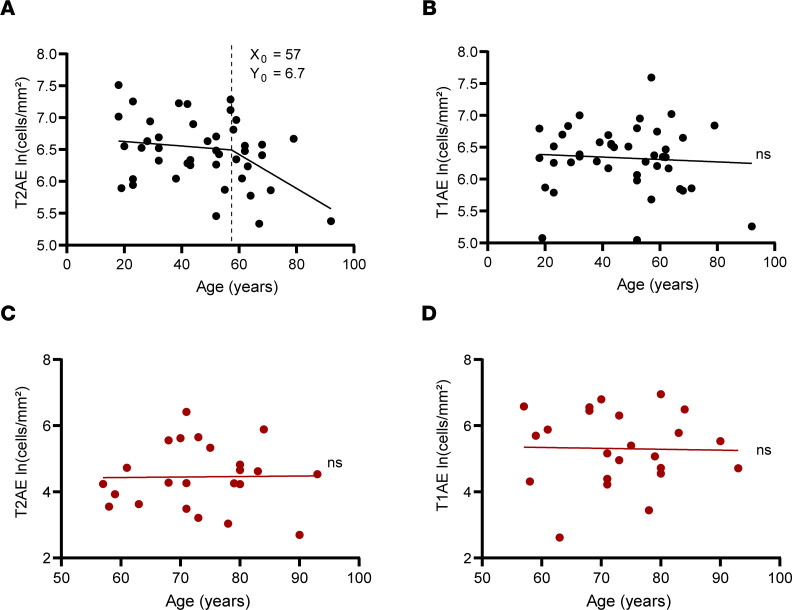
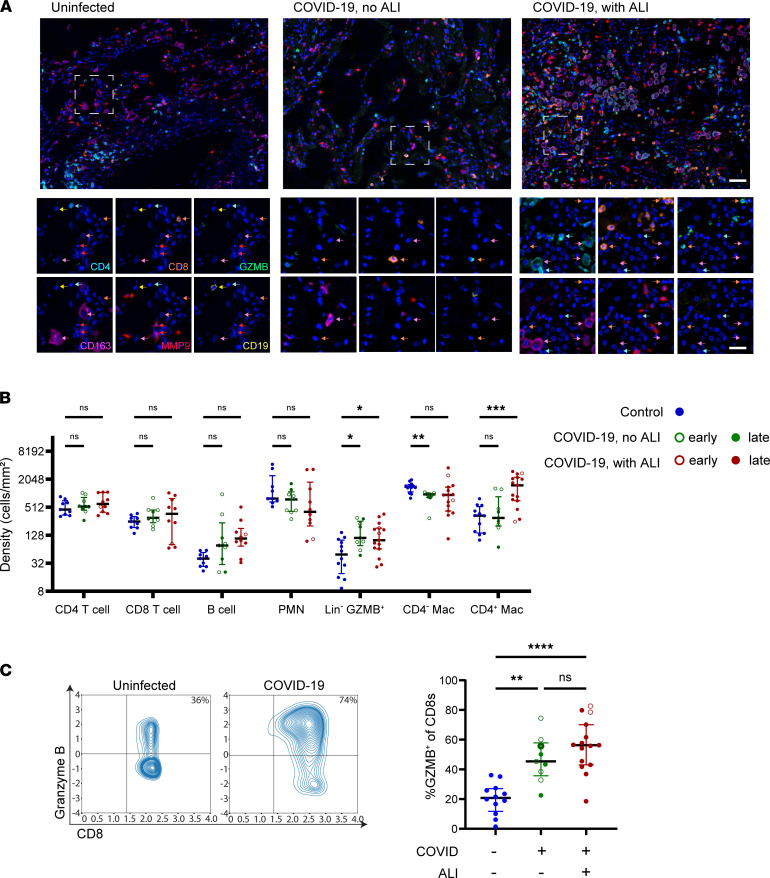
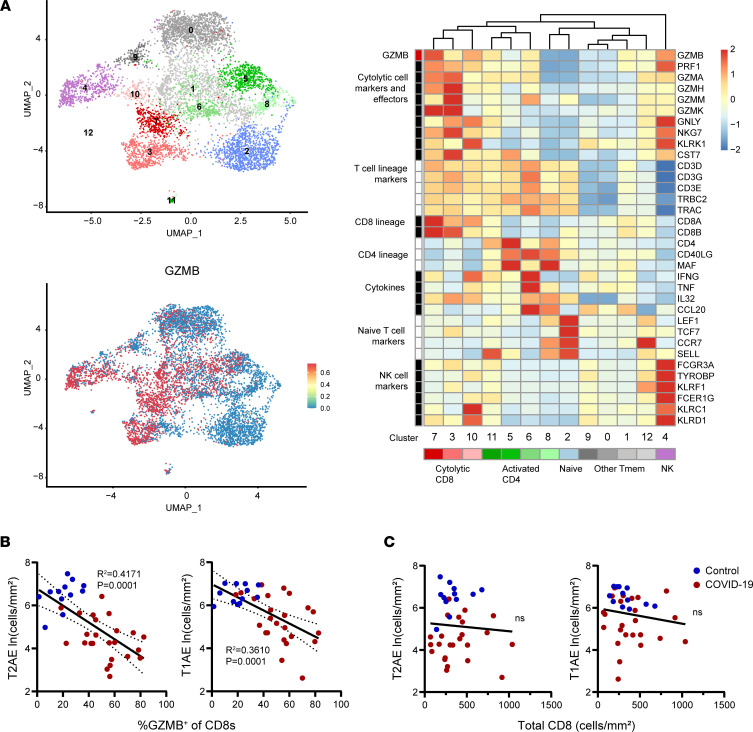
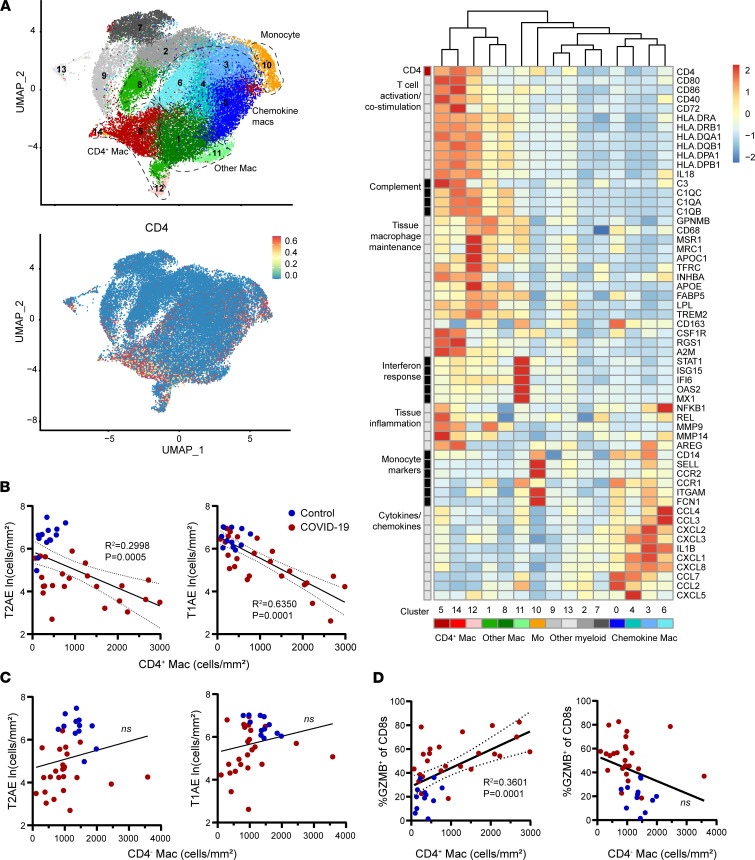
Respiratory failure in COVID-19 is characterized by widespread disruption of the lung's alveolar gas exchange interface. To elucidate determinants of alveolar lung damage, we performed epithelial and immune cell profiling in lungs from 24 COVID-19 autopsies and 43 uninfected organ donors ages 18-92 years. We found marked loss of type 2 alveolar epithelial (T2AE) cells and increased perialveolar lymphocyte cytotoxicity in all fatal COVID-19 cases, even at early stages before typical patterns of acute lung injury are histologically apparent. In lungs from uninfected organ donors, there was also progressive loss of T2AE cells with increasing age, which may increase susceptibility to COVID-19-mediated lung damage in older individuals. In the fatal COVID-19 cases, macrophage infiltration differed according to the histopathological pattern of lung injury. In cases with acute lung injury, we found accumulation of CD4+ macrophages that expressed distinctly high levels of T cell activation and costimulation genes and strongly correlated with increased extent of alveolar epithelial cell depletion and CD8+ T cell cytotoxicity. Together, our results show that T2AE cell deficiency may underlie age-related COVID-19 risk and initiate alveolar dysfunction shortly after infection, and we define immune cell mediators that may contribute to alveolar injury in distinct pathological stages of fatal COVID-19.

Keywords: Aging; COVID-19; Macrophages; Pulmonary surfactants; T cells.


Conflict of interest statement

Conflict of interest: The authors have declared that no conflict of interest exists.

Figures

Figure 1
Figure 1. Histopathological findings in early and late COVID-19 mortality.
(A) H&E-stained sections (20× original magnification fields) demonstrating the predominant histopathological changes seen in uninfected lung (left panel, control), early COVID-19 mortality (middle panel, <10 days symptomatic interval), and late COVID-19 mortality (right panel, >10 days symptomatic interval). (B) Bar plots depicting the percentage of early COVID-19 mortality (n = 8) and late COVID-19 mortality cases (n = 16) showing predominant histological patterns of acute lung injury (ALI, shown in red). (C) Representative SARS-CoV-2 nucleocapsid protein (N protein) stain is shown (left) with bar plots depicting the percentage of early (n = 8) and late (n = 16) COVID-19 mortality cases that were histologically positive for the SARS-CoV-2 N protein (shown in green, right). Black scale bar: 50 μm.
Figure 2
Figure 2. Gene expression profiles in early and late COVID-19 mortality.
(A) Bowtie plots showing gene expression log2 fold change plotted against –log10-adjusted P value for comparison of the early (top left, n = 6) and late COVID-19 mortality cases (bottom left, n = 8) versus uninfected controls (n = 10). Red dots correspond to gene expression changes for the indicated comparison with adjusted P < 0.05. P values were adjusted for multiple-hypothesis testing using the Benjamini-Hochberg method. (B) Heatmap depicting the normalized and scaled transcript levels across COVID-19 cases (ordered by symptomatic interval) and controls for all the significantly altered transcripts falling into the indicated functional categories. (C) Dot plots depicting log2-normalized counts of the indicated transcripts. Controls are shown to the left (blue squares, n = 10), and COVID-19 cases are plotted against symptomatic interval (red dots, n = 14). The best-fit line with 95% confidence bands and R2 and P values were calculated using simple linear regression analysis. Error bars show median and interquartile range.
Figure 3
Figure 3. Distinct profiles of alveolar epithelial cell loss associated with lung tissue pathology in fatal COVID-19.
(A) Dual-chromogen staining in alveolar lungs for nuclear TTF-1 (brown) and cytoplasmic Napsin-A (red) with hematoxylin counterstain (blue). Shown are representative original magnification 40× fields from 2 uninfected controls (left), early COVID-19 mortality cases without ALI (middle), and late COVID-19 mortality cases with ALI (right). (B and C) Dot plots depicting type 2 alveolar epithelial cell density (T2AE, TTF-1+Napsin-A+) (B, left) and type 1 alveolar epithelial cell density (T1AE, TTF-1+Napsin-A) (C, left) in the controls (n = 17) compared with the COVID-19 mortality cases with (n = 15) and without (n = 9) ALI (indicated on the x axis). Also shown are the T2AE (B, right) and T1AE (C, right) cell densities plotted against the symptomatic interval. The best-fit line with 95% confidence bands and R2 and P values were calculated using simple linear regression analysis. Black scale bar: 50 μm. Solid arrow, T1AE cells; double arrow, T2AE cells; single arrow, macrophages. Error bars show median and interquartile range. **P < 0.01, ***P < 0.001, ****P < 0.0001.
Figure 4
Figure 4. Age-associated changes in lung alveolar epithelial cells in uninfected organ donors and COVID-19 mortality cases.
Dot plots depicting T2AE (A) and T1AE (B) cell density in uninfected organ donors (black dots, n = 43) plotted against donor age. Also shown are dot plots depicting T2AE (C) and T1AE (D) cell density in the COVID-19 cases (n = 24, red dots). The best-fit line and P values were calculated using simple linear regression analysis. The X0 and Y0 values for the age versus T2AE cell density plot were calculated using segmental linear regression where appropriate.
Figure 5
Figure 5. Patterns of immune cell infiltration associated with lung tissue pathology in fatal COVID-19.
(A) Representative original magnification 20× fields of 7-color multiplex staining with single markers shown for the boxed magnified field, of alveolar lung tissue from uninfected controls (left), early COVID-19 mortality cases without ALI (middle), and late COVID-19 mortality cases with ALI (right). (B) Lung tissue density of immune cell subsets defined based on expression of the 6 immune lineage markers for each of the controls (n = 9–12, blue dots), COVID-19 mortality cases without ALI (n = 9, green dots), and COVID-19 mortality cases with ALI (n = 10–15, red dots). P values were calculated using a mixed effects model 2-way ANOVA and Dunnett’s multiple comparisons test. (C) Representative contour plots depicting granzyme B (GZMB) expression plotted against CD8 expression (left) in the imaged CD8+ T cells of a control and COVID-19 mortality case with compiled data (right). For each case, mortality at early (unfilled dot, n = 8) or late (filled dot, n = 16) stage of disease is also indicated. P values were calculated using Welch’s ANOVA test and Dunnett’s multiple comparisons test. *P < 0.05, **P < 0.01, ***P < 0.001, ****P < 0.0001. Error bars show median and interquartile range. White scale bar, top images 50 μm; single marker images 25 μm. Arrow colors indicate lineages (magenta, macrophage; cyan, CD4+ T cell; orange CD8+ T cell; red, neutrophil; yellow, B cell).
Figure 6
Figure 6. Correlation of lung T cell cytotoxicity with alveolar epithelial cell loss in fatal COVID-19.
(A) Uniform manifold approximation and projection (UMAP) embeddings of total T/NK cells obtained from airways of 3 patients with COVID-19 (top left) with a feature plot showing normalized expression of GZMB (bottom left). Representative marker genes for each cluster are shown in the normalized and scaled heatmap to the right, with color bars corresponding to position on the UMAP. (B) The percentage GZMB+ cells within the CD8+ T cell subset in lungs and (C) the overall density of all CD8+ T cells is plotted against the density of lung T2AE cells (left) and T1AE cells (right) from all COVID-19 cases (n = 24) and controls (n = 12). The best-fit line with 95% confidence bands and R2 and P values were calculated using simple linear regression analysis.
Figure 7
Figure 7. Correlation of CD4+ macrophages with T cell cytotoxicity and alveolar epithelial cell loss in fatal COVID-19.
(A) UMAP embeddings of total monocytes (Mo) and macrophages (Mac) from airways of 3 patients with COVID-19 (top left). Feature plot shows normalized expression of CD4 (bottom left). Representative marker genes for each cluster are shown in the normalized and scaled heatmap on the right with color bars corresponding to position on the UMAP. (B and C) The density of CD4+ macrophages (B) and CD4 macrophages (C) in lung tissue is plotted against the density of lung T2AE cells (left) and T1AE cells (right). (D) The density of CD4+ macrophages (left) and CD4 macrophages (right) is plotted against the percentage of GZMB+ cells in the CD8+ T cell subset for all COVID-19 cases (n = 24) and controls (n = 12). The best-fit line with 95% confidence bands and R2 and P values were calculated using simple linear regression analysis.

Similar articles

Cited by

References

    1. Gupta S, et al. Factors associated with death in critically ill patients with coronavirus disease 2019 in the US. JAMA Intern Med. 2020;180(11):1436–1447. doi: 10.1001/jamainternmed.2020.3596. - DOI - PMC - PubMed
    1. Epidemiology Working Group for NCIP Epidemic Response. Chinese Center for Disease Control and Prevention [The epidemiological characteristics of an outbreak of 2019 novel coronavirus diseases (COVID-19) in China] Zhonghua Liu Xing Bing Xue Za Zhi. 2020;41(2):145–151. doi: 10.3760/cma.j.issn.0254-6450.2020.02.003. - DOI - PubMed
    1. CDC COVID-19 Response Team. Severe outcomes among patients with coronavirus disease 2019 (COVID-19) — United States, February 12-March 16, 2020. MMWR Morb Mortal Wkly Rep. 2020;69(12):343–346. doi: 10.15585/mmwr.mm6912e2. - DOI - PMC - PubMed
    1. Salje H, et al. Estimating the burden of SARS-CoV-2 in France. Science. 2020;369(6500):208–211. doi: 10.1126/science.abc3517. - DOI - PMC - PubMed
    1. Richardson S, et al. Presenting characteristics, comorbidities, and outcomes among 5700 patients hospitalized with COVID-19 in the New York City area. JAMA. 2020;323(20):2052–2059. doi: 10.1001/jama.2020.6775. - DOI - PMC - PubMed

Publication types