. 2022 Apr 21;18(4):e1009854.
doi: 10.1371/journal.ppat.1009854. eCollection 2022 Apr.

Smallpox vaccination induces a substantial increase in commensal skin bacteria that promote pathology and influence the host response

Affiliations

Smallpox vaccination induces a substantial increase in commensal skin bacteria that promote pathology and influence the host response

Evgeniya V Shmeleva et al. PLoS Pathog. .

Abstract

Interactions between pathogens, host microbiota and the immune system influence many physiological and pathological processes. In the 20th century, widespread dermal vaccination with vaccinia virus (VACV) led to the eradication of smallpox but how VACV interacts with the microbiota and whether this influences the efficacy of vaccination are largely unknown. Here we report that intradermal vaccination with VACV induces a large increase in the number of commensal bacteria in infected tissue, which enhance recruitment of inflammatory cells, promote tissue damage and influence the host response. Treatment of vaccinated specific-pathogen-free (SPF) mice with antibiotic, or infection of genetically-matched germ-free (GF) animals caused smaller lesions without alteration in virus titre. Tissue damage correlated with enhanced neutrophil and T cell infiltration and levels of pro-inflammatory tissue cytokines and chemokines. One month after vaccination, GF and both groups of SPF mice had equal numbers of VACV-specific CD8+ T cells and were protected from disease induced by VACV challenge, despite lower levels of VACV-neutralising antibodies observed in GF animals. Thus, skin microbiota may provide an adjuvant-like stimulus during vaccination with VACV and influence the host response to vaccination.


Conflict of interest statement

The authors have declared that no competing interests exist.

Figures

Fig 1
Fig 1. Skin microbiota expand after VACV infection.
C57BL/6 SPF mice were injected i.d. with 104 PFU of VACV strain WR or PBS (mock) and ear tissues were collected at different times post injection. (A) Absolute numbers of different myeloid cells present in ear tissues at d 9 p.i. (n = 5 per time point). DC & MΦ: dendritic cells and macrophages; Eosin: eosinophils; Mon: monocytes; Neutr: neutrophils. Medians are shown. (B) Absolute numbers of neutrophils infiltrating ear tissues at different times p.i. Mock: mock-infected control, 5 d post intradermal injection of PBS (n = 3–5 per time point). Medians are shown. (C) Bacterial colonies grown from homogenised ear tissues and their 10-fold serial dilutions seeded on blood agar. (D) Bacteria colony-forming unit (CFU) counts of ear samples (n = 3). Results of CFU counts for mock samples at 7 d post PBS injection were obtained from a separate experiment. Means and SEM are shown. The experiments were performed at least twice and representative data from one experiment are shown.
Fig 2
Fig 2. Skin microbiome change after i.d. infection with VACV.
Ear tissues were collected from SPF mice before (intact) and at 2, 5, 8 and 12 d p.i. with 104 PFU of VACV and at d 8 post PBS injection (mock), n = 15 per group per time point. Next generation sequencing was performed for DNA samples extracted from tissue. (A) Principal Component Analysis (PCA) of microbiome of genus taxon. PCA was conducted including all taxon with a minimum abundance of 0.1%. Ellipses represent a 40% confidence interval around the cluster centroid. (B) Relative abundance of most prevalent taxa of bacterial genera. (C) Heatmap of bacterial genera with hierarchical clustering. Bacterial genera with a minimum abundance of 1% in at least five samples was used for creation of the heat map. Five clusters are colour-coded with red, blue, green, violet and orange. “D”–day post injection.
Fig 3
Fig 3. Skin microbiota promote lesion development after VACV infection.
Specific pathogen free (SPF) or germ-free (GF) mice (n = 5–15 per group) were injected intradermally with 104 PFU of VACV. SPF, AB animals received antibiotic i.p. from 1 d p.i.; SPF, NoAB animals received i.p. injections with PBS. (A-B) Ear lesion sizes of AB and NoAB-groups (A) or GF or SPF mice (B). Means and SEM are shown. Statistical analysis by two-way RM ANOVA test. (C) VACV titres in ear tissue p.i. PFU, plaque-forming units. NS–non-significant by Mann-Whitney test. Experiments (except for those with GF mice) were performed at least twice and representative data from one experiment are shown. The experiments with GF mice were performed once.
Fig 4
Fig 4. Histology of ear lesions after VACV infection.
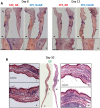
Specific pathogen free (SPF) or germ-free (GF) mice (n = 5–15 per group) were injected i.d. with 104 PFU of VACV WR. Group SPF AB was injected daily i.p. with antibiotic ceftriaxone from d 1 to 11 p.i. Group SPF NoAB received i.p. injections with PBS. (A) Images of haematoxylin and eosin (H&E) stained transverse ear sections 8 and 12 d p.i. Bars = 300 μm. Regions of necrotic tissue are labelled ‘a’ and regions of inflamed tissue labelled ‘b’. (B) Images of H&E stained transverse ear sections collected from GF mice 10 d p.i. Bars = 300 μm.
Fig 5
Fig 5. Skin microbiota advance immune cell recruitment into VACV infected tissue.
Two groups of SPF mice were infected i.d. with 104 PFU of VACV. From d 1 p.i. onwards, one group (AB) received antibiotic (ceftriaxone) i.p. daily. The second group (NoAB) received PBS i.p. (A) Numbers of myeloid and lymphoid cell of subpopulations were measured in ear tissues at 2, 5, 7 and 12 d p.i. (n = 5 per group per time point). DC & MΦ, dendritic cells and macrophages; Mon, monocytes, TCRγδ, TCRγδ+ T cells; TCRαβ CD4, TCRγδ-CD4+ T cells; TCRαβ CD8, TCRγδ-CD8+ T cells. Medians are shown; p values were determined by the Mann-Whitney test, * = p<0.05, ** = p<0.01. (B) Spearman correlation analysis of lesion sizes versus numbers of neutrophils, Ly6C+monocytes, TCRγδ T cells or TCRαβ (TCRγδ-) T cells recruited to site of infection. The experiment was performed twice and representative data from one experiment are shown.
Fig 6
Fig 6. Skin microbiota promote the production of cytokines/chemokines in VACV-infected ear tissue.
SPF or GF mice (n = 5–7 per group per time point) were injected i.d. with 104 PFU of VACV. SPF, AB-group received antibiotic (ceftriaxone) i.p. daily from 1 d p.i.; SPF, NoAB group received i.p. injections with PBS. (A) Tissue levels of cytokines and chemokines were measured by multiplex assay (Luminex). Data are shown as the fold change from the baseline (untreated intact ear samples). Means are shown. The experiment was performed twice and data from one representative experiment are shown. (B) Tissue levels of cytokines and chemokines in GF and SPF groups at d 10 p.i. measured by multiplex assay (Luminex). Graphs show results two independent experiments. Dotted lines indicate the lowest standards (or highest standard for CCL7). The experiment with GF animals was performed once.
Fig 7
Fig 7. VACV-specific antibody and CD8+ T cell memory response and virus challenge of vaccinated mice.
(A-C): SPF or GF mice (n = 5) were injected i.d. with 104 PFU of VACV. SPF, AB-group received i.p. antibiotic treatment for 10 d from 1 d p.i. SPF, NoAB group received i.p. injections with PBS. Spleens and serum samples were obtained at 34 d p.i. (A) Absolute number of splenic CD8+ and CD4+ T cells. Bars represent means. (B) Absolute number of VACV-specific splenic CD8+ T cells. Bars represent means. (C) VACV-neutralising antibody responses determined by plaque-reduction neutralisation test. IC50, half maximal inhibitory concentration. Bars represent means. All experiments (except with GF mice) were performed twice and representative data from one experiment are shown. The experiments with GF mice were performed once and in a facility separate from SPF experiments. (D-F): GF and SPF groups of mice (n = 5 per group) were vaccinated (“vac”) i.d. in both ears with 104 PFU of VACV WR per ear. “Naive” groups (n = 3–5) were not vaccinated. AB and NoAB groups were treated as in (A-C). One month p.i. groups were challenged i.n. with (D, E) 3 × 10⁶ PFU or (F) 6 × 10⁶ PFU of VACV WR. Data represent the weight of each mouse compared to the weight of the same animal before challenge (d 0). The percentages for each group are means with SEM.

Similar articles

Cited by

References

    1. Fenner F, Henderson DA, Arita I, Jezek Z, Ladnyi ID. Smallpox and its eradication. Geneva1988.
    1. Lane JM, Ruben FL, Neff JM, Millar JD. Complications of smallpox vaccination, 1968. National surveillance in the United States. N Engl J Med. 1969;281(22):1201–8. doi: 10.1056/NEJM196911272812201 - DOI - PubMed
    1. Moss B. Smallpox vaccines: targets of protective immunity. Immunol Rev. 2011;239(1):8–26. doi: 10.1111/j.1600-065X.2010.00975.x - DOI - PMC - PubMed
    1. Smith GL, Benfield CTO, Maluquer de Motes C, Mazzon M, Ember SWJ, Ferguson BJ, et al.. Vaccinia virus immune evasion: mechanisms, virulence and immunogenicity. J Gen Virol. 2013;94:2367–92. doi: 10.1099/vir.0.055921-0 - DOI - PubMed
    1. Albarnaz JD, Torres AA, Smith GL. Modulating vaccinia virus immunomodulators to improve immunological memory. Viruses. 2018;10(3). doi: 10.3390/v10030101 - DOI - PMC - PubMed

Publication types

Substances