. 2022 Apr 21;18(4):e1010443.
doi: 10.1371/journal.ppat.1010443. eCollection 2022 Apr.

Profiling metabolites and lipoproteins in COMETA, an Italian cohort of COVID-19 patients

Affiliations

Profiling metabolites and lipoproteins in COMETA, an Italian cohort of COVID-19 patients

Veronica Ghini et al. PLoS Pathog. .

Abstract

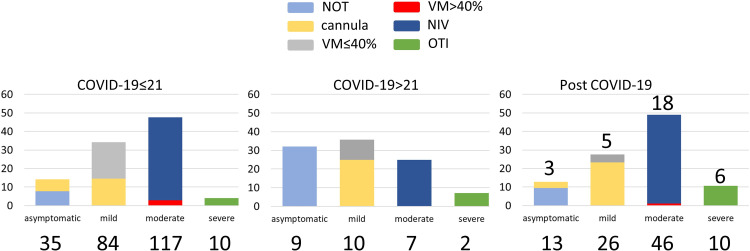
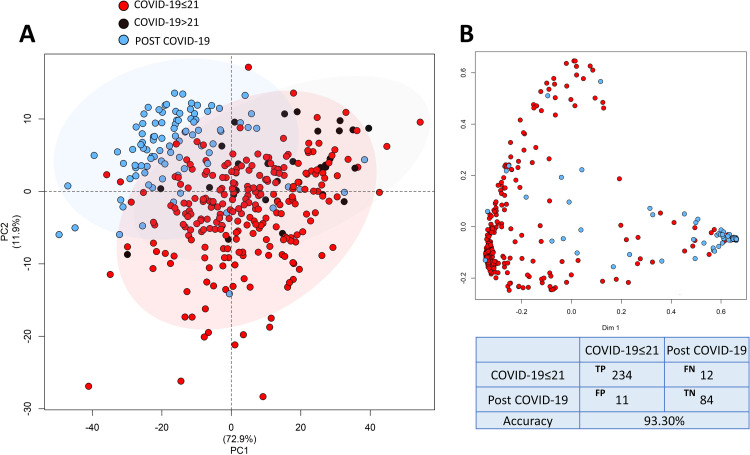
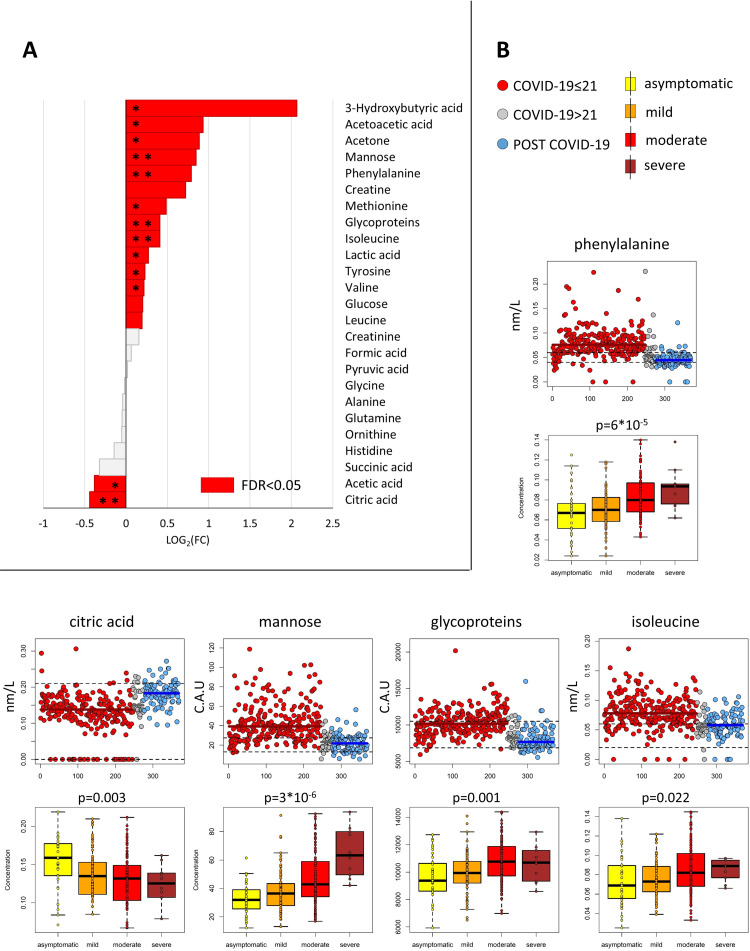
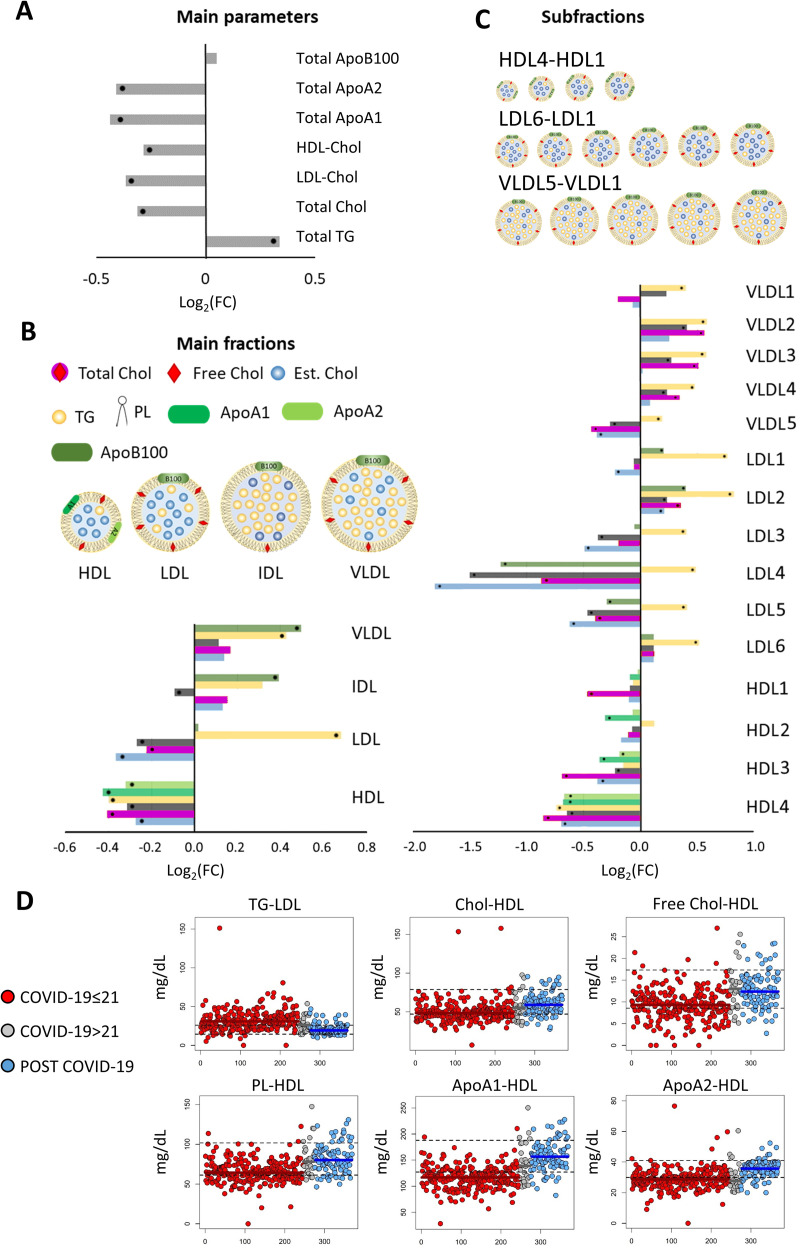
Metabolomics and lipidomics have been used in several studies to define the biochemical alterations induced by COVID-19 in comparison with healthy controls. Those studies highlighted the presence of a strong signature, attributable to both metabolites and lipoproteins/lipids. Here, 1H NMR spectra were acquired on EDTA-plasma from three groups of subjects: i) hospitalized COVID-19 positive patients (≤21 days from the first positive nasopharyngeal swab); ii) hospitalized COVID-19 positive patients (>21 days from the first positive nasopharyngeal swab); iii) subjects after 2-6 months from SARS-CoV-2 eradication. A Random Forest model built using the EDTA-plasma spectra of COVID-19 patients ≤21 days and Post COVID-19 subjects, provided a high discrimination accuracy (93.6%), indicating both the presence of a strong fingerprint of the acute infection and the substantial metabolic healing of Post COVID-19 subjects. The differences originate from significant alterations in the concentrations of 16 metabolites and 74 lipoprotein components. The model was then used to predict the spectra of COVID-19>21 days subjects. In this group, the metabolite levels are closer to those of the Post COVID-19 subjects than to those of the COVID-19≤21 days; the opposite occurs for the lipoproteins. Within the acute phase patients, characteristic trends in metabolite levels are observed as a function of the disease severity. The metabolites found altered in COVID-19≤21 days patients with respect to Post COVID-19 individuals overlap with acute infection biomarkers identified previously in comparison with healthy subjects. Along the trajectory towards healing, the metabolome reverts back to the "healthy" state faster than the lipoproteome.


Conflict of interest statement

The authors have declared that no competing interests exist.

Figures

Fig 1
Fig 1. Clinical classification.
Distribution (%) of the subjects according to the 4 descriptors defining disease severity in the acute phase, i.e. asymptomatic, mild, moderate and severe. Treatments are indicated by color code: no oxygen therapy (NOT; cyan), nasal cannula (yellow), Ventimask (VM, FiO2≤40%, grey), VM (FiO2>40%, red), non invasive ventilation (NIV, blue), orotracheal intubation (OTI, green). In the right panel, the numbers above each bar indicate the number of subjects with CT abnormalities at the follow-up visit. In all panels the absolute numbers of subjects are indicated below each bar.
Fig 2
Fig 2. Multivariate statistics.
A) Score plot of PCA analysis. Ellipsis indicate the 95% confidence intervals. B) Proximity plot of the RF model discriminating COVID-19≤21 patients and Post COVID-19 subjects with confusion matrix and accuracy value. In the confusion matrix, TP means true positive, FP false positive, TN true negative and FN false negative. Red dots: COVID-19≤21; black dots: COVID-19>21; blue dots: Post COVID-19.
Fig 3
Fig 3. Metabolite profiling.
A) Values of Log2Fold Change (FC) of quantified metabolites. Positive/negative values, have higher/lower concentration in serum samples from COVID-19≤21 patients with respect to Post COVID-19 subjects. Red bars refer to significantly different metabolites (p-value (FDR) <0.05); Cliff’s delta effect size are also reported: ** large, *medium. B) Upper panels: Scatter plots of concentration levels for significant metabolites (p-value (FDR) ≤0.05) with a “large” Cliff’s delta effect-size for the comparison COVID-19≤21 vs. Post COVID-19 groups; red dots represent COVID-19≤21 subjects, grey dots refer to COVID-19>21 subjects and blue dots to Post COVID-19 individuals; the median of each group is represented as a colored line; black dashed lines embrace the concentration ranges in a “healthy” population. Lower panels: boxplot of the concentration levels of COVID-19≤21 samples according to the grade of severity, i.e. asymptomatic (yellow), mild (orange), moderate (red), severe (brown).
Fig 4
Fig 4. Lipoprotein profiling.
Values of Log2 Fold Change (FC) of lipoprotein parameters. (A) Main parameters; (B) main fractions; (C) subfractions. Positive/negative values, have higher/lower concentration in serum samples from COVID-19≤21 patients with respect to Post COVID-19 subjects. Statistically significant parameters are marked with black dots. D) Scatter plots of concentration levels for significant main fraction parameters (p-value (FDR) ≤0.05) with a “large” Cliff’s delta effect-size for the comparison COVID-19≤21 vs. Post COVID-19 groups; red dots represent COVID-19≤21 subjects, grey dots refer to COVID-19>21 subjects and blue dots to Post COVID-19 individuals; the median of each group is represented as a colored line; black dashed lines embrace the concentration ranges in a “healthy” population.

Similar articles

Cited by

References

    1. Cunningham JW, Vaduganathan M, Claggett BL, Jering KS, Bhatt AS, Rosenthal N, et al.. Clinical Outcomes in Young US Adults Hospitalized With COVID-19. JAMA Intern Med. 2020. doi: 10.1001/jamainternmed.2020.5313 - DOI - PMC - PubMed
    1. Wiersinga WJ, Rhodes A, Cheng AC, Peacock SJ, Prescott HC. Pathophysiology, Transmission, Diagnosis, and Treatment of Coronavirus Disease 2019 (COVID-19): A Review. JAMA. 2020;324: 782–793. doi: 10.1001/jama.2020.12839 - DOI - PubMed
    1. Rothan HA, Byrareddy SN. The epidemiology and pathogenesis of coronavirus disease (COVID-19) outbreak. J Autoimmun. 2020;109: 102433. doi: 10.1016/j.jaut.2020.102433 - DOI - PMC - PubMed
    1. Zaim S, Chong JH, Sankaranarayanan V, Harky A. COVID-19 and Multiorgan Response. Curr Probl Cardiol. 2020;45: 100618. doi: 10.1016/j.cpcardiol.2020.100618 - DOI - PMC - PubMed
    1. Proal AD, VanElzakker MB. Long COVID or Post-acute Sequelae of COVID-19 (PASC): An Overview of Biological Factors That May Contribute to Persistent Symptoms. Frontiers in Microbiology. 2021;12: 1494. doi: 10.3389/fmicb.2021.698169 - DOI - PMC - PubMed

Publication types