. 2022 Jul;607(7917):128-134.
doi: 10.1038/s41586-022-04778-y. Epub 2022 Apr 21.

Increased memory B cell potency and breadth after a SARS-CoV-2 mRNA boost

Affiliations

Increased memory B cell potency and breadth after a SARS-CoV-2 mRNA boost

Frauke Muecksch et al. Nature. 2022 Jul.

Abstract

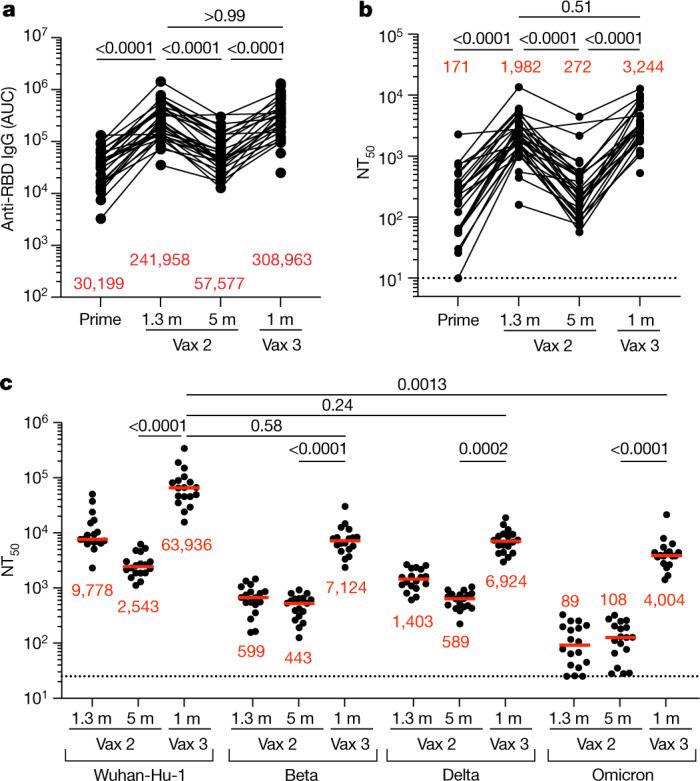
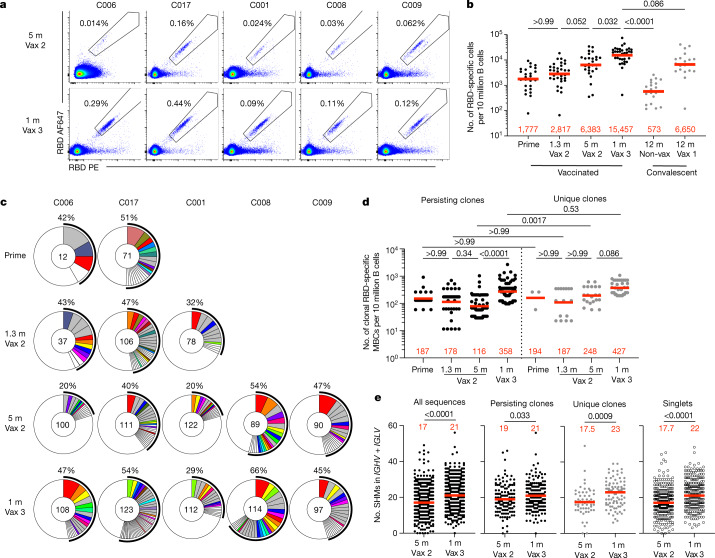
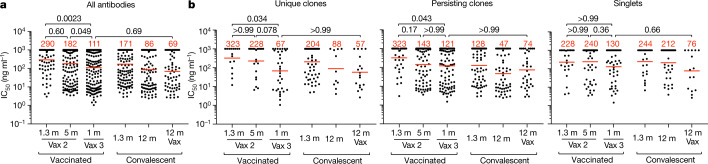
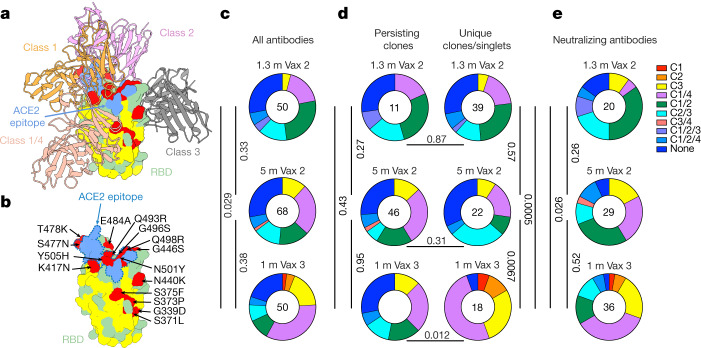
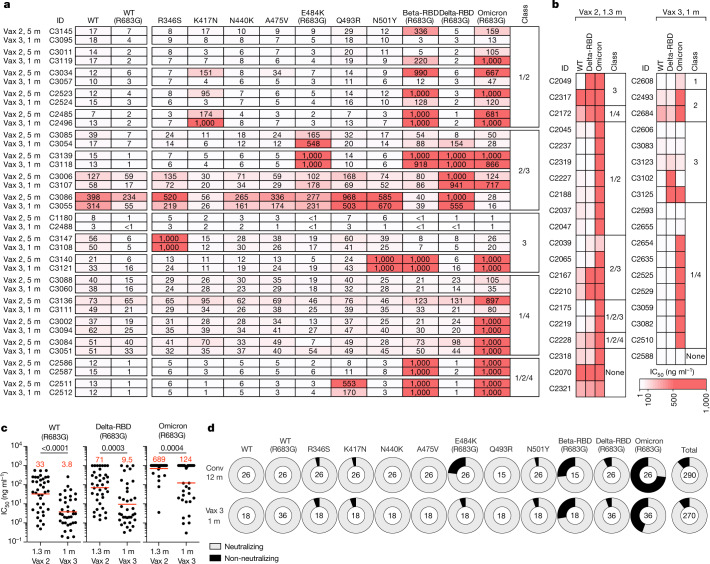
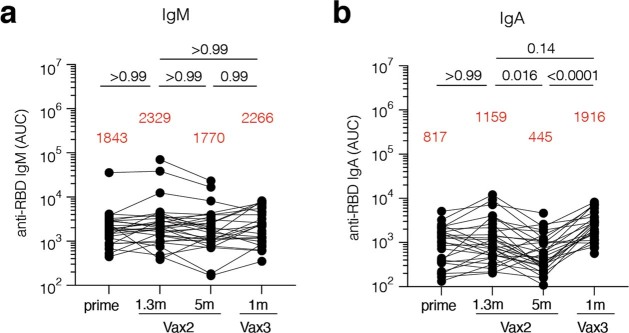
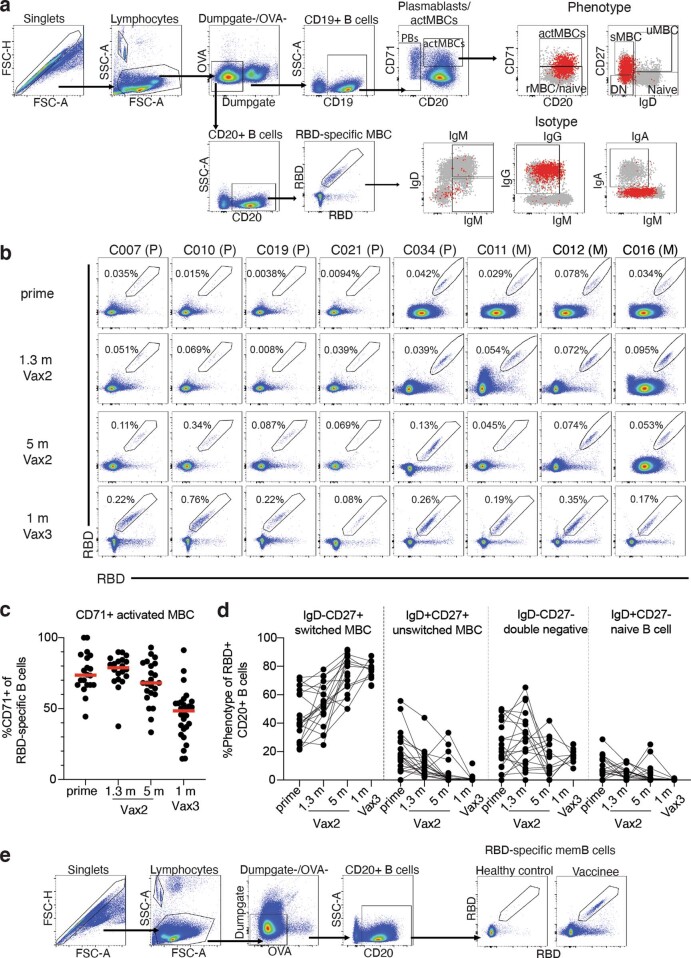
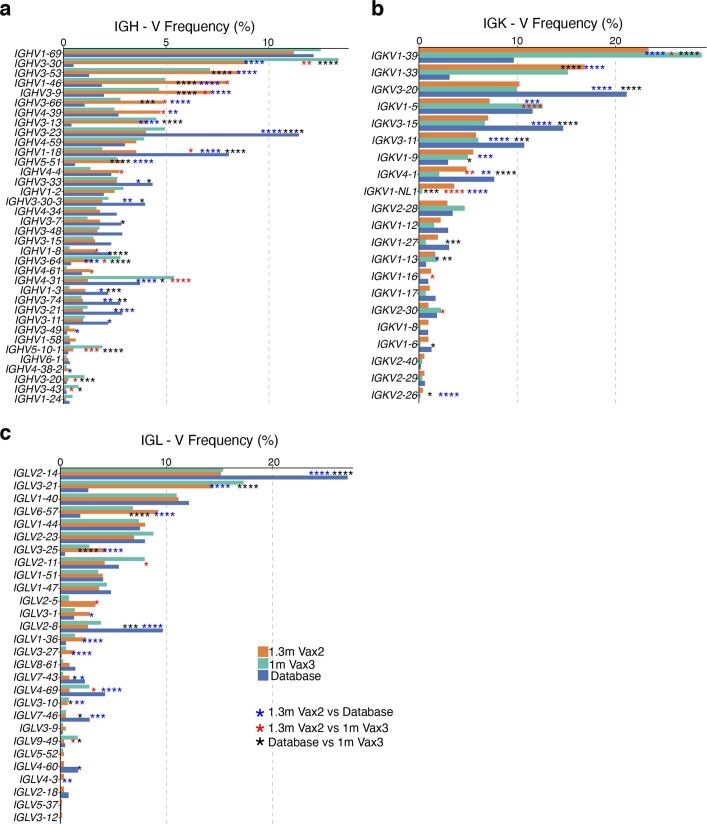
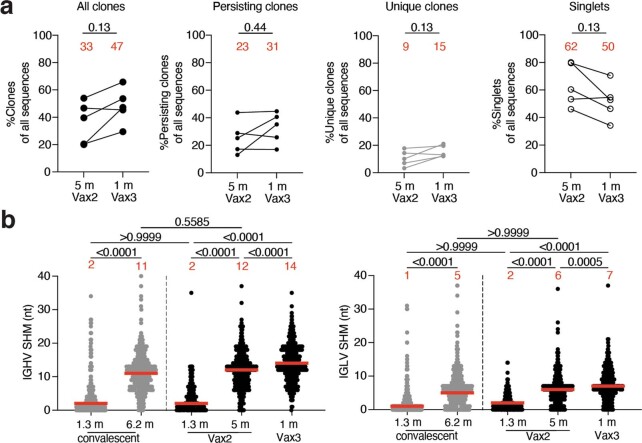
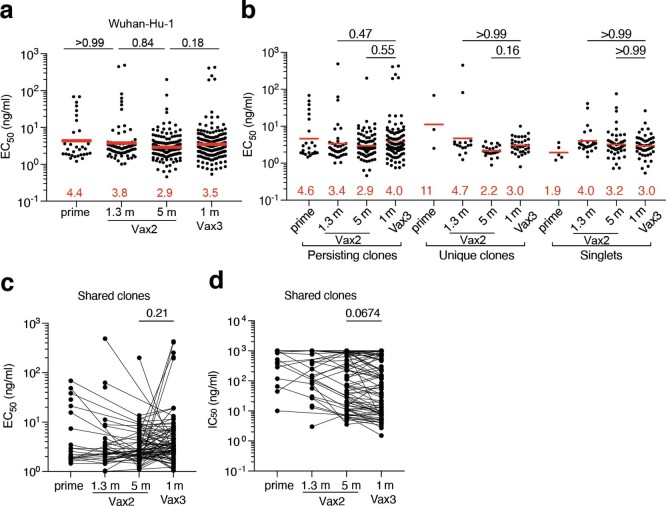
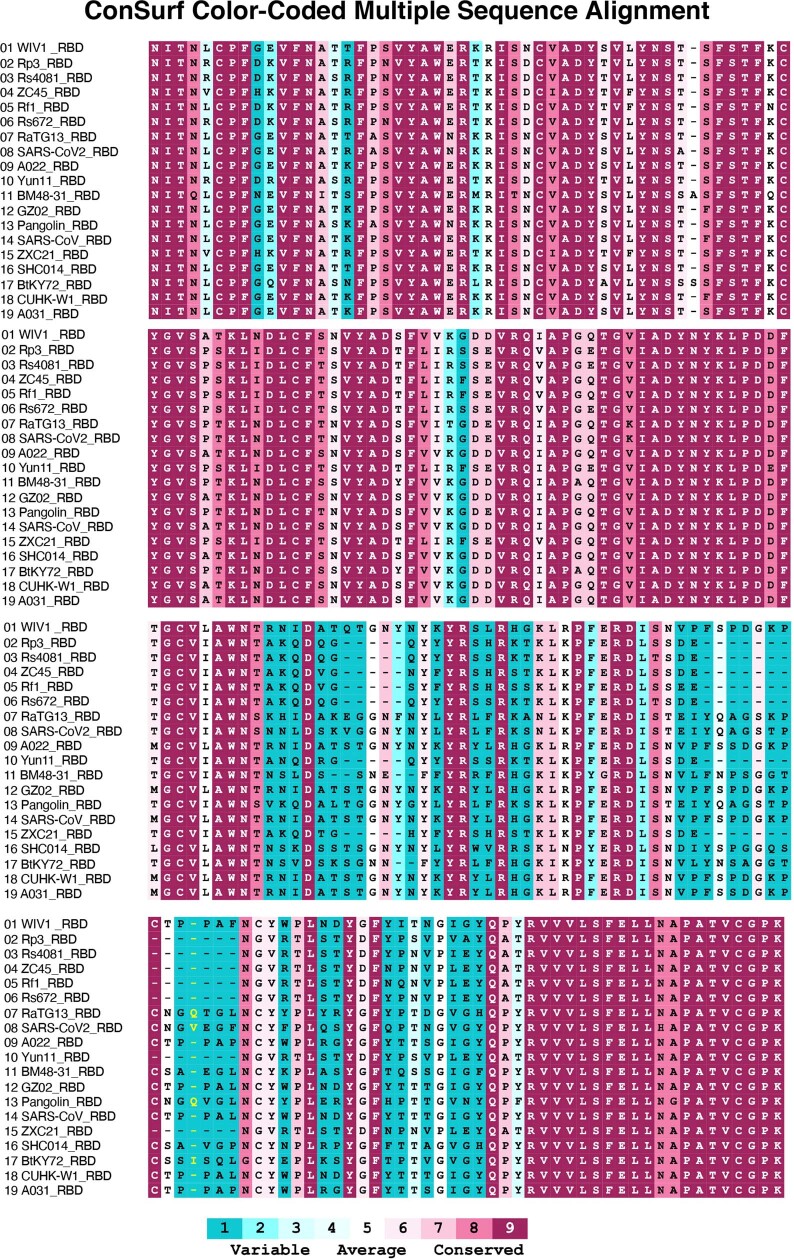
The Omicron variant of SARS-CoV-2 infected many vaccinated and convalescent individuals1-3. Despite the reduced protection from infection, individuals who received three doses of an mRNA vaccine were highly protected from more serious consequences of infection4. Here we examine the memory B cell repertoire in a longitudinal cohort of individuals receiving three mRNA vaccine doses5,6. We find that the third dose is accompanied by an increase in, and evolution of, receptor-binding domain (RBD)-specific memory B cells. The increase is due to expansion of memory B cell clones that were present after the second dose as well as the emergence of new clones. The antibodies encoded by these cells showed significantly increased potency and breadth when compared with antibodies obtained after the second dose. Notably, the increase in potency was especially evident among newly developing clones of memory cells, which differed from persisting clones in targeting more conserved regions of the RBD. Overall, more than 50% of the analysed neutralizing antibodies in the memory compartment after the third mRNA vaccine dose neutralized the Omicron variant. Thus, individuals receiving three doses of an mRNA vaccine have a diverse memory B cell repertoire that can respond rapidly and produce antibodies capable of clearing even diversified variants such as Omicron. These data help to explain why a third dose of a vaccine that was not specifically designed to protect against variants is effective against variant-induced serious disease.


Conflict of interest statement

The Rockefeller University has filed a provisional patent application in connection with this work, on which M.C.N. is an inventor (US patent 63/021,387). The patent has been licensed by Rockefeller University to Bristol Meyers Squib. P.D.B. has received remuneration from Pfizer for consulting services related to SARS-CoV-2 vaccines.

Figures

Fig. 1
Fig. 1. Plasma ELISAs and neutralizing activity.
a, Graph showing area under the curve (AUC) for plasma IgG antibody binding to SARS-CoV-2 Wuhan-Hu-1 RBD after prime, 1.3 months and 5 months after the second vaccination (Vax 2), and 1 month after the third vaccination booster (Vax 3) for n = 42 samples. Lines connect longitudinal samples. m, month. b, Graph showing anti-SARS-CoV-2 NT50 values of plasma measured by a SARS-CoV-2 pseudotype virus neutralization assay in 293TAce2 cells using wild-type (WT; Wuhan-Hu-1) SARS-CoV-2 pseudovirus, in the plasma samples shown in a. c, Plasma neutralizing activity against the indicated SARS-CoV-2 variants of interest or concern for n = 15 randomly selected samples assayed in HT1080Ace2cl.14 cells. Wuhan-Hu-1 and Omicron BA.1 NT50 values were derived from ref. . Pseudoviruses in c were based on a spike protein that also included the R683G substitution, which disrupts the furin cleavage site and increases particle infectivity. All experiments were performed at least in duplicate. Red bars and values in ac represent geometric mean values. Statistical significance in a and b was determined by two-tailed Kruskal–Wallis test with subsequent Dunn’s multiple-comparisons test. Statistical significance in c was determined by two-tailed Friedman test with subsequent Dunn’s multiple-comparisons test. P values are as indicated.
Fig. 2
Fig. 2. Anti-SARS-CoV-2 RBD memory B cells after a third vaccination.
a, Representative flow cytometry plots showing dual binding of AF647- and PE-labelled RBD from Wuhan-Hu-1 by single sorted B cells from five individuals 5 months after the second vaccine dose and 1 month after the third vaccine dose (additional gating strategy given in Extended Data Fig. 2). The percentage of Wuhan-Hu-1 RBD-specific B cells is indicated. b, Graph summarizing the number of Wuhan-Hu-1 RBD-specific memory B cells per 10 million B cells after prime,, 1.3 and 5 months after the second vaccine dose, and 1 month after the third vaccine dose (n = 42) compared with convalescent infected individuals 12 months after infection with or without later vaccination (grey dots). c, Pie charts showing the distribution of IgG antibody sequences obtained for memory B cells from five individuals after prime, 1.3 and 5 months after the second vaccine dose, and 1 month after the third vaccine dose. Time points are indicated to the left of the charts. The number inside the circle indicates the number of sequences analysed for the individual denoted above the circle. The pie slice size is proportional to the number of clonally related sequences. The black outline and associated numbers indicate the percentage of clonal sequences detected at each time point. Coloured slices indicate expanded persisting clones found at multiple time points within the same individual, grey slices indicate expanded clones unique to the time point and white slices indicate sequences isolated only once per time point. d, Graph showing the number of clonal Wuhan-Hu-1 RBD-specific memory B cells per 10 million B cells isolated from five participants. Each dot represents one clone illustrated in c (n = 331). The left panel (black dots) represents persisting clones, and the right panel (grey dots) represents time point-unique clones. e, Number of nucleotide somatic hypermutations (SHM) in IGHV and IGLV in all sequences detected 5 months after the second vaccine dose (n = 512) or 1 month after the third vaccine dose (n = 554) compared with the somatic hypermutations in IGHV and IGLV for sequences from persisting clones, unique clones and singlets. Red bars and numbers represent geometric mean values (b, d) or median values (e). Statistical difference was determined by two-tailed Kruskal–Wallis test with subsequent Dunn’s multiple-comparisons test (b, d) or by two-tailed Mann–Whitney test (e). P values are as indicated.
Fig. 3
Fig. 3. Anti-SARS-CoV-2 RBD monoclonal antibodies.
a, b, Graphs showing the anti-SARS-CoV-2 neutralizing activity of monoclonal antibodies measured by a SARS-CoV-2 pseudotype virus neutralization assay using WT (Wuhan-Hu-1) SARS-CoV-2 pseudovirus,. IC50 values are shown for all antibodies (a) and for monoclonal antibodies categorized as unique clones (sequences clonally expanded but detected at a single time point), persisting clones (sequences detected at multiple time points) or singlets (monoclonal antibodies derived from sequences detected once at a single time point) (b). Antibodies were from vaccinated individuals 1.3 and 5 months after the second vaccine dose, and 1 month after the third vaccination, convalescent individuals 1.3 months or 12 months after infection or vaccinated convalescent individuals 12 months after infection. Each dot represents 1 antibody; 459 total antibodies were tested, including the 325 reported herein (Supplementary Table 4) and 134 previously reported. Red bars and numbers indicate geometric mean values. Statistical significance was determined by two-tailed Kruskal–Wallis test with subsequent Dunn’s multiple-comparisons test. All experiments were performed at least twice.
Fig. 4
Fig. 4. Epitope mapping.
a, Diagram representing the binding poses of the antibodies used in BLI competition experiments on the RBD epitope. Class 1 antibody (C105, Protein Data Bank (PDB) 6XCM) is shown in orange, class 2 antibody (C144, PDB 7K90) is shown in pink, class 3 antibody (C135, PDB 7K8Z) is shown in grey and class 1/4 antibody (C118, PDB 7RKS) is shown in light coral,. The ACE2 epitope of the Omicron BA.1 variant is shown in blue. Omicron BA.1 mutations are shown in red. The most conserved residues as calculated by the ConSurf Database are shown in yellow (related to Extended Data Fig. 6). b, Expanded view of RBD in a. The ACE2 epitope of the Omicron BA.1 variant is indicated by a blue dashed line, and the Omicron BA.1 mutations are labelled. ce, Results of epitope mapping performed by competition BLI. Pie charts show the distribution of the antibody classes among all Wuhan-Hu-1 RBD-binding antibodies (c), Wuhan-Hu-1 RBD-binding antibodies from persisting clones or from unique clones or singlets (d) or neutralizing antibodies against Wuhan-Hu-1 (e) obtained 1.3 and 5 months after the second vaccine dose, and 1 month after the third vaccine dose. Statistical significance was determined using a two-tailed chi-square test.
Fig. 5
Fig. 5. Determination of the increase in antibody breadth.
a, b, Heat maps showing the IC50 values of clonal pairs of antibodies obtained from persisting clones at 5 months after the second vaccine dose and 1 month after the third dose (a) and clones and singlets found 1.3 months after the second dose and newly detected (either as a unique clone or singlet) 1 month after the third vaccine dose (b) against the indicated mutant and variant SARS-CoV-2 pseudoviruses. Beta-RBD and Delta-RBD indicate K417N/E484K/N501Y and L452R/T478K SARS-CoV-2 spike proteins, respectively. The heat map range from 0.1 to 1,000 ng ml−1 is represented by white to red. The antibody classes in a and b were determined by competition BLI. c, Graphs showing the neutralization activity of the antibodies shown in a and b against WT, Beta-RBD (L452R/T478K) and Omicron BA.1, comparing n = 38 monoclonal antibodies isolated at 1.3 months after the second vaccine dose and n = 36 monoclonal antibodies isolated 1 month after the third vaccine dose. Red bars and numbers indicate geometric mean values. Statistical significance was determined using the two-tailed Mann–Whitney test. P values are as indicated. d, Ring plots showing the fraction of neutralizing (IC50 < 1,000 ng ml−1) and non-neutralizing (IC50 > 1,000 ng ml−1) antibodies (represented by light grey and dark grey, respectively) for the indicated SARS-CoV-2 pseudoviruses. The numbers in the inner circles correspond to the numbers of antibodies tested.
Extended Data Fig. 1
Extended Data Fig. 1. Plasma ELISA.
Graph shows area under the curve (AUC) for plasma a, IgM and b, IgA antibody binding to Wuhan-Hu-1 SARS-CoV-2 RBD after prime, 1.3 months (m) and 5 months (m) after the 2nd vaccine dose (Vax2),, and 1 month after the 3rd (Vax3) for n = 42 samples. Lines connect longitudinal samples. Red bars and value represent geometric mean values. Statistical significance was determined by two-tailed Kruskal-Wallis test with subsequent Dunn’s multiple comparisons. P-values as indicated.
Extended Data Fig. 2
Extended Data Fig. 2. Flow Cytometry.
a, Gating strategy for phenotyping. Gating was on lymphocytes singlets that were CD19+ or CD20+ and CD3-CD8-CD16-Ova-. Anti-IgG, IgM, IgA, IgD, CD71 and CD27 antibodies were used for B cell phenotype analysis. Antigen-specific cells were detected based on binding to Wuhan-Hu-1 RBD-PE+ and RBD-AF647+. Counting beads were added to each sample and gated based on forward scatter (FSC) and side scatter (SSC) as per manufacturer instructions. b, Representative flow cytometry plots of Wuhan-Hu-1-RBD-specific memory B cells in 8 individuals after prime, 1.3- and 5-months post-Vax2,, and 1 month after Vax3. Timepoint of sample collection indicated to the left. Pfizer vaccinees indicated by (P) and Moderna by (M) across the top. c, Graph showing frequency of Wuhan-Hu-1-RBD-specific MBCs expressing activation marker CD71 over time after vaccination for n = 36 samples. Red bar indicated median value. d, Graph showing the phenotype of RBD-specific B cells over time, determined to be either switched MBCs (IgD-CD27+), unswitched MBCs (IgD+CD27+), double negative MBCs (IgD-CD27-) or naïve B cells (IgD+CD27-), for n = 18 samples. Lines connect longitudinal samples. f, Gating strategy for single-cell sorting for CD20+ memory B cells for Wuhan-Hu-1 RBD-PE and Wuhan-Hu-1 RBD-AF647.
Extended Data Fig. 3
Extended Data Fig. 3. Frequency distribution of human V genes.
a-c Comparison of the frequency distribution of human V genes for heavy chain and light chains of anti-RBD Wuhan-Hu-1 antibodies from this study and from a database of shared clonotypes of human B cell receptor generated by Cinque Soto et al.. Graph shows relative abundance of human IGHV (a), IGKV (b) and IGLV (c) genes Sequence Read Archive accession SRP010970 (blue), 1.3m-Vax 2 antibodies (orange), and 1m-Vax3 antibodies (green).
Extended Data Fig. 4
Extended Data Fig. 4. Clonality and somatic hypermutation of anti-SARS-CoV-2 Wuhan-Hu-1 RBD antibody clones after third vaccination booster.
a, Graphs show relative fraction of all clones (persisting and unique), persisting clones only (sequences detected at multiple time points), unique clones only (clonally expanded but detected at a single time point), and singlets (detected only once at a single time point) among all antibody sequences in individuals (n = 5) 5m after the 2nd and 1 month after the 3rd dose. b, Number of nucleotide somatic mutations (SHM) in the IGHV (left panel) and IGLV (right panel) in the antibodies illustrated in Fig. 2c for vaccinees after 1.3- and 5- months post-Vax2, and 1 month after Vax3, compared to the number of mutations obtained after 1.3 or 6.2 months after infection (grey). Statistical significance was determined by Wilcoxon matched-pairs signed rank test (a) or by two-tailed Kruskal Wallis test with subsequent Dunn’s multiple comparisons (b). P-values as indicated.
Extended Data Fig. 5
Extended Data Fig. 5. Anti-SARS-CoV-2 RBD monoclonal antibodies.
a, Graphs show half-maximal concentration (EC50) of n = 459 monoclonal antibodies measured by ELISA against Wuhan-Hu-1 RBD after prime, 1.3- and 5-months post-Vax2,, and 1 month after Vax3. b, Graph showing EC50 of n = 459 monoclonal antibodies as categorized as either persisting clones detected at multiple time points, unique clones where sequences were clonally expanded but detected at a single time point, or singlets where mAbs were derived from sequences detected once at a single time point. c-d, EC50 (c) or IC50 neutralizing activity (d) of n = 246 monoclonal antibodies derived from shared clones only. Lines connect the related clones at the indicated time point. Red bars and numbers in a, and b, indicate geometric mean values. Statistical significance was determined by two-tailed Kruskal Wallis test with subsequent Dunn’s multiple comparisons. All experiments were performed at least twice.
Extended Data Fig. 6
Extended Data Fig. 6. Multiple sequence alignment of RBDs.
Sequences used for the alignment are the RBDs of WIV1(Bat SARS-like coronavirus WIV1, GenBank: KF367457.1), Rp3(Bat coronavirus Rp3/2004), UniprotKB:Q3I5J5), Rs4081(Bat SARS-like coronavirus isolate Rs4081, GenBank: KY417143.1), ZC45 (Bat SARS-like coronavirus ZC45, GenBank: AVP78031.1), Rf1(Bat SARS coronavirus Rf1, GenBank: DQ412042.1), Rs672(SARS coronavirus Rs_672/2006, GenBank: ACU31032.1), RaTG13(Bat coronavirus RaTG13, GenBank: QHR63300.2), SARS-CoV2 (Severe acute respiratory syndrome coronavirus 2, GenBank: MN985325.1), A022(SARS coronavirus A022, GenBank: AAV91631.1), Yun11 (Bat coronavirus Cp/Yunnan2011, GenBank: JX993988.1), BM48-31(Bat coronavirus BM48-31/BGR/2008, NCBI Reference Sequence: NC_014470.1), GZ02(SARS coronavirus GZ02, GenBank: AAS00003.1), Pangolin(Pangolin coronavirus, GenBank: QIA48632.1), SARS-CoV(Severe acute respiratory syndrome coronavirus, UniProtKB:P59594), ZXC21(Bat SARS-like coronavirus ZXC21, GenBank: AVP78042.1), SHC014(Bat SARS-like coronavirus RsSHC014, GenBank: KC881005.1), BtKY72(Severe acute respiratory syndrome-related coronavirus strain BtKY72, GenBank: KY352407.1), CUHK-W1(SARS coronavirus CUHK-W1, GenBank: AAP13567.1), and A031(SARS coronavirus A031, GenBank: AAV97988.1). Multiple sequence alignment of RBDs was processed by Clustal Omega. Sequence conservation was calculated by the ConSurf Database.

References

    1. Chaguza, C. et al. Rapid emergence of SARS-CoV-2 Omicron variant is associated with an infection advantage over Delta in vaccinated persons. Med.10.1101/2022.01.22.22269660 (2022). - PMC - PubMed
    1. Kuhlmann C, et al. Breakthrough infections with SARS-CoV-2 Omicron despite mRNA vaccine booster dose. Lancet. 2022;399:625–626. doi: 10.1016/S0140-6736(22)00090-3. - DOI - PMC - PubMed
    1. Nemet I, et al. Third BNT162b2 vaccination neutralization of SARS-CoV-2 Omicron infection. N. Engl. J. Med. 2022;386:492–494. doi: 10.1056/NEJMc2119358. - DOI - PMC - PubMed
    1. Danza P, et al. SARS-CoV-2 infection and hospitalization among adults aged ≥ 18 years, by vaccination status, before and during SARS-CoV-2 B.1.1.529 (Omicron) variant predominance—Los Angeles County, California, November 7, 2021–January 8, 2022. MMWR Morb. Mortal. Wkly. Rep. 2022;71:177–181. doi: 10.15585/mmwr.mm7105e1. - DOI - PMC - PubMed
    1. Wang Z, et al. mRNA vaccine-elicited antibodies to SARS-CoV-2 and circulating variants. Nature. 2021;592:616–622. doi: 10.1038/s41586-021-03324-6. - DOI - PMC - PubMed

MeSH terms

Supplementary concepts