. 2022 May 12;185(10):1694-1708.e19.
doi: 10.1016/j.cell.2022.03.033. Epub 2022 Apr 20.

Quiescent cancer cells resist T cell attack by forming an immunosuppressive niche

Affiliations

Quiescent cancer cells resist T cell attack by forming an immunosuppressive niche

Pilar Baldominos et al. Cell. .

Abstract

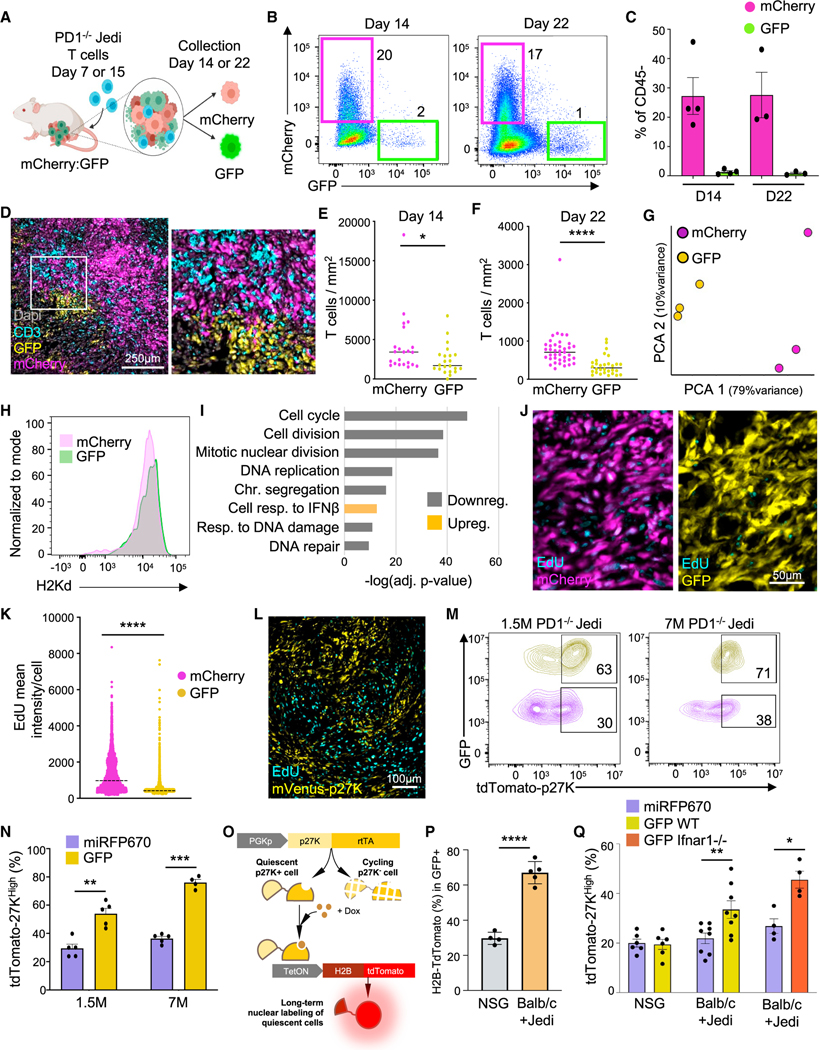
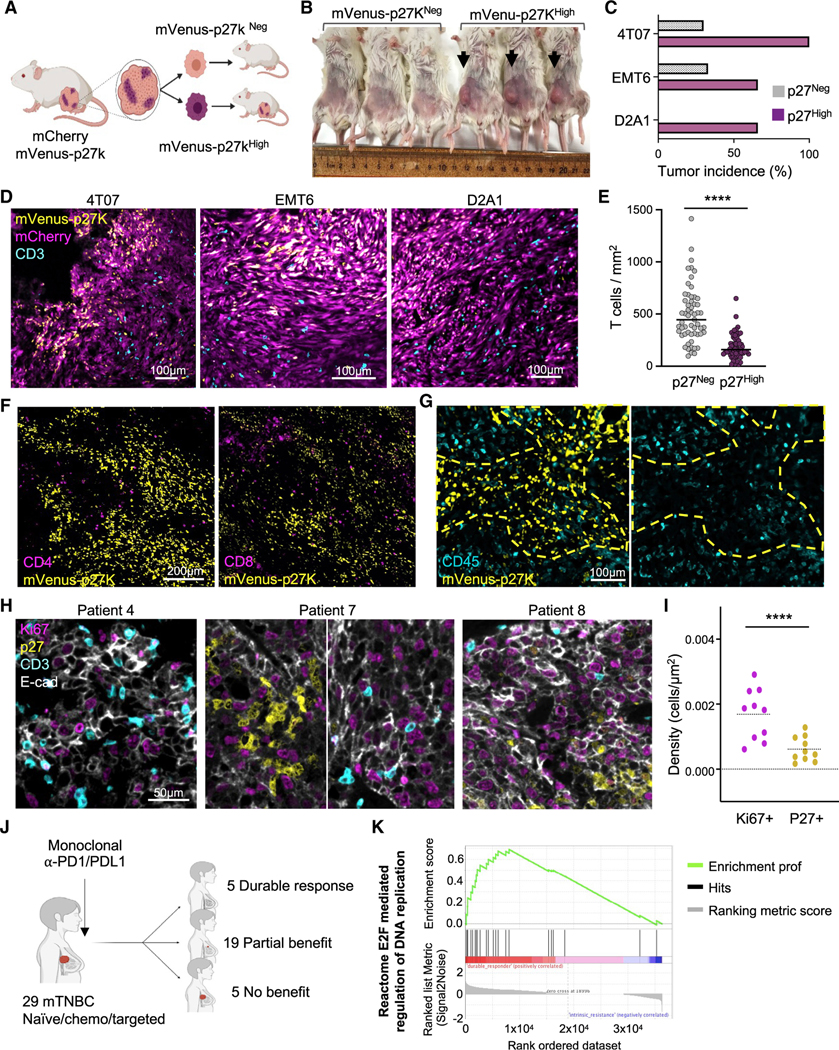
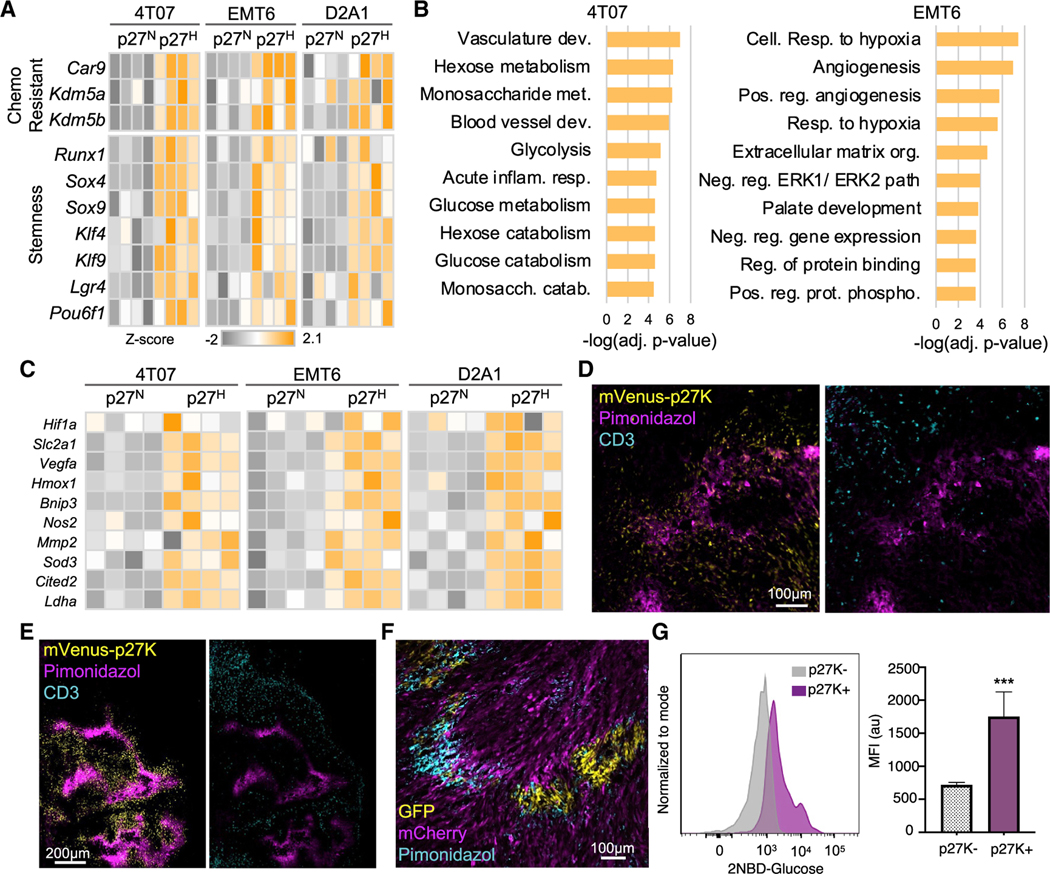
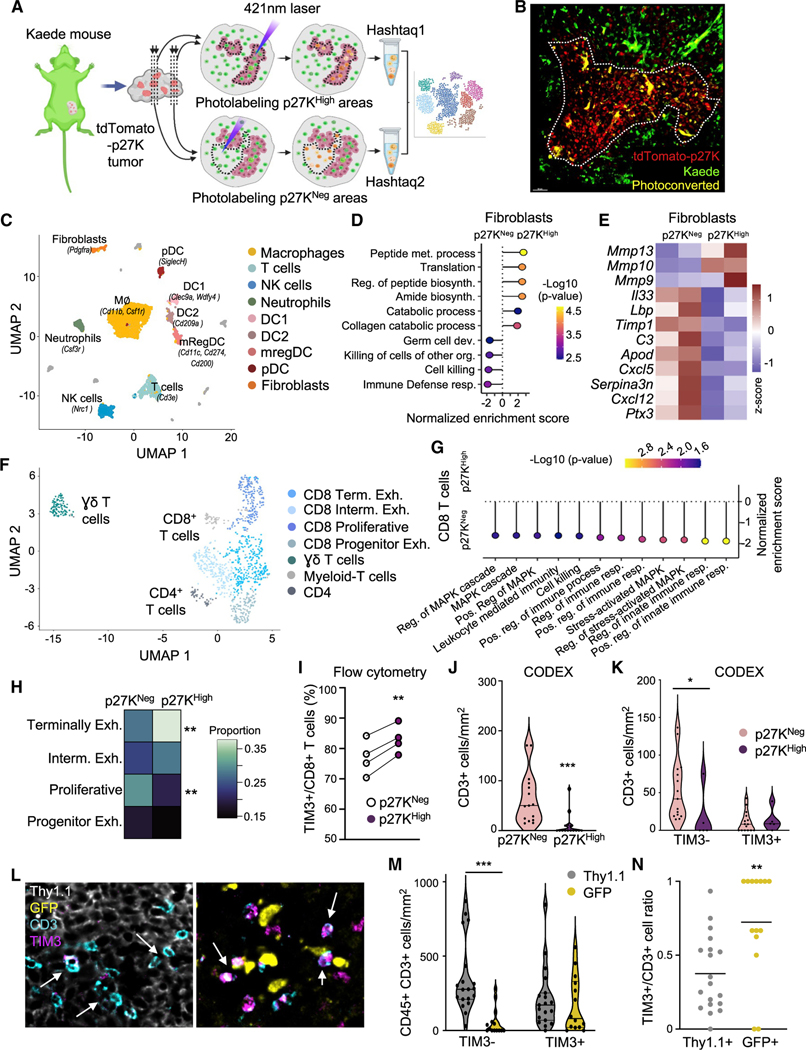
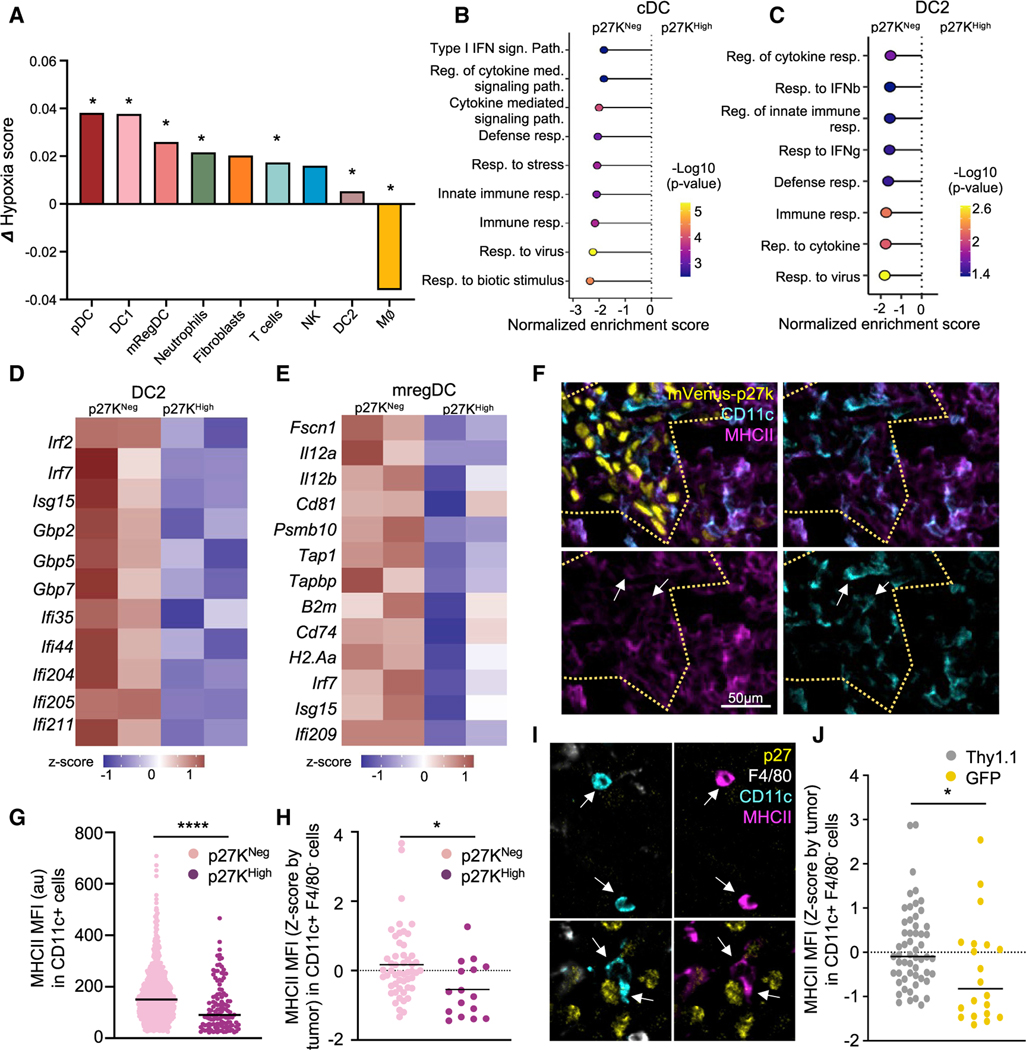
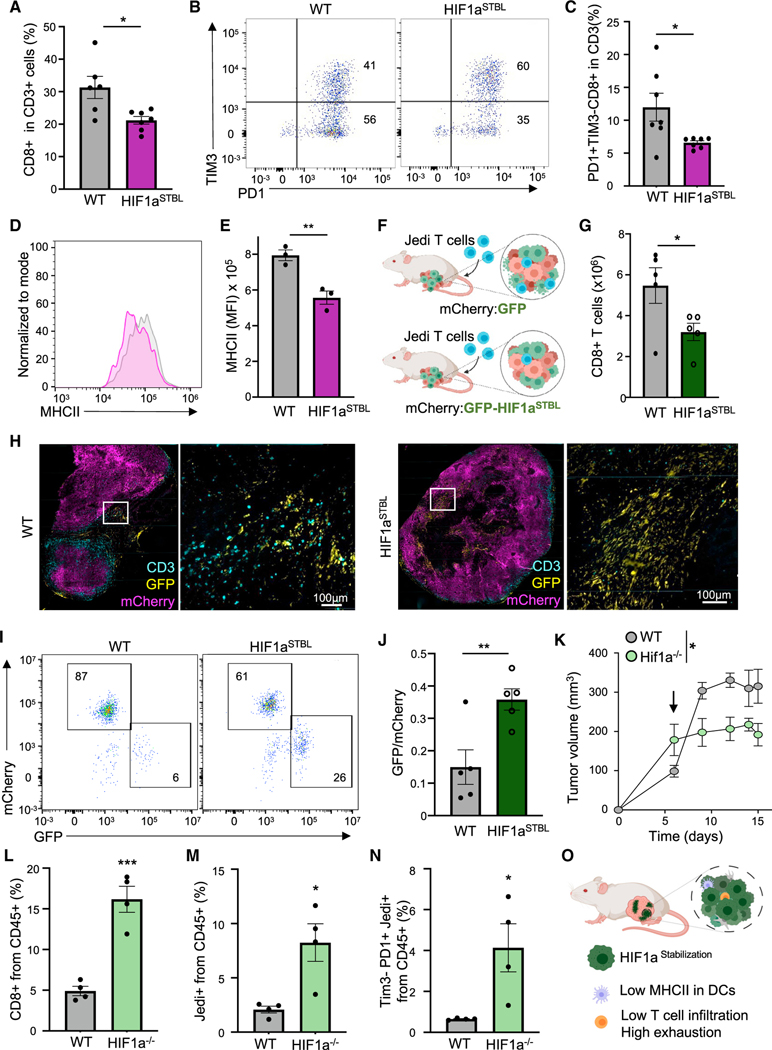
Immunotherapy is a promising treatment for triple-negative breast cancer (TNBC), but patients relapse, highlighting the need to understand the mechanisms of resistance. We discovered that in primary breast cancer, tumor cells that resist T cell attack are quiescent. Quiescent cancer cells (QCCs) form clusters with reduced immune infiltration. They also display superior tumorigenic capacity and higher expression of chemotherapy resistance and stemness genes. We adapted single-cell RNA-sequencing with precise spatial resolution to profile infiltrating cells inside and outside the QCC niche. This transcriptomic analysis revealed hypoxia-induced programs and identified more exhausted T cells, tumor-protective fibroblasts, and dysfunctional dendritic cells inside clusters of QCCs. This uncovered differential phenotypes in infiltrating cells based on their intra-tumor location. Thus, QCCs constitute immunotherapy-resistant reservoirs by orchestrating a local hypoxic immune-suppressive milieu that blocks T cell function. Eliminating QCCs holds the promise to counteract immunotherapy resistance and prevent disease recurrence in TNBC.

Keywords: T cells; TME; breast cancer; cancer-associated fibroblasts; dendritic cells; immunotherapy; resistance to therapy; single-cell RNA-sequencing; tumor dormancy; tumor immunology; tumor microenvironment.


Conflict of interest statement

Declaration of interests S.A.S.: non-financial support (Bristol-Myers Squibb), equity (Agenus Inc., Agios Pharmaceuticals, Breakbio Corp., Bristol-Myers Squibb, and Lumos Pharma). E.A.M.: SAB compensation (Merck, Genentech, and Genomic Health), uncompensated steering committees (Bristol-Myers Squibb, Lilly, and Genentech). K.W.W.: scientific advisory board (TCR2 Therapeutics, T-Scan Therapeutics, SQZ Biotech, and Nextechinvest), sponsored research funding (Novartis), co-founder (Immunitas Therapeutics). S.M.T.: institutional research funding (AstraZeneca, Lilly, Merck, Nektar, Novartis, Pfizer, Genentech/Roche, Immunomedics, Exelixis, Bristol-Myers Squibb, Eisai, Nanostring, Cyclacel, Odonate, and Seattle Genetics); adviser/consultant (AstraZeneca, Lilly, Merck, Nektar, Novartis, Pfizer, Genentech/Roche, Immunomedics, Bristol-Myers Squibb, Eisai, Nanostring, Puma, Sanofi, Celldex, Paxman, Puma, Silverback Therapeutics, G1 Therapeutics, Gilead, AbbVie, Anthenex, OncoPep, Outcomes4Me, Kyowa Kirin Pharmaceuticals, Daiichi-Sankyo, Ellipsis, Infinity, and Samsung Bioepsis Inc). R.B.-S.: consulting (AstraZeneca, Elli Lilly, Libbs, Merck, Roche, and Zodiac), non-CME services received directly from commercial interest or their Agents (Bard Access, BMS, Eli Lilly, Libbs, Merck, Novartis, and Pfizer, Roche), contracted research funding (Roche and BMS), travel/accommodation/expenses (Eli Lilly, Roche, Daichi Sankyo, and Merck). M.H.: co-founder and adviser (Neomer Diagnostics). P.B., A.B.-M., Y.H., A.W., J.-W.C., G.E., I.A., S.M., J.S., X.Z., X.S., Z.K., A.R., E.T.R., R.P., and J.A. have no conflicts of interest to report.

Figures

Figure 1.
Figure 1.. Breast tumor cells that escape from PD1−/− T cell killing are quiescent
(A) Schematic of the experiment: mammary carcinoma was grown with mixed GFP+ and mCherry+ 4T07 cells (1:1). Mice were treated with 7M PD1−/− Jedi T cells at either day 7 or day 15 after tumor inoculation. All mice were analyzed 7 days post-T cell injection (n = 3–4 mice). (B) Flow cytometry plots from tumors in (A), gated on DAPI— CD45. (C) Mean ± SEM of data in (B). (D) Tumor images from (A) at day 14. (E and F) Number of T cells per tumor area from mice in (A). Bar marks the median (Multiple areas from 3 tumors). (G) Principal component analysis (PCA) from RNA-seq data from mCherry+ and GFP+ tumor cells from (A) at day 14. (H) H2-Kd (MHCI) in cancer cells from mice in (A) (n = 4 mice). (I) Pathway enrichment analysis from (G) at day 14 ranked by lowest adjusted p value. (J) EdU labeling in tumors from (A). EdU was injected 30 h before adoptive transfer of Jedi T cells and continued daily (n = 5 mice). (K) EdU intensity from pictures in (J). Line marks the median (n = 15 images from 5 tumors). (L) EdU in mVenus-p27K-expressing 4T07 tumors (n = 3 mice). (M and N) GFP and tdTomato-p27K 4T07 cells mixed with H2B-miRFP670 and tdTomato-p27k 4T07 tumor-bearing mice were treated with the specified number of PD1−/− Jedi T cells (n = 5 mice). (M) Flow cytometry plots gating on GFP+ and miRFP670+ tumor cells. Percentages calculated over color coded populations. (N) Mean ± SEM of percentage of tdTomato-p27KHigh cells. (O and P) Genetic circuit to assess quiescence in cancer cells prior to injection of Jedi T cells. GFP+ 4T07 cells with the circuit were injected in BALB/c or NSG mice. All mice received doxycycline on day 6 post-tumor inoculation. 30 h later, 5M Jedi T cells were injected into the BALB/c group. (O) Schematic. (P) Mean ± SEM of the percentage of H2B-tdTomato+ cells (n = 4–5 mice). (Q) Quantification of p27KHigh cells in Jedi T cell-resistant cancer cells upon loss of IFNAR1 signaling. Either Ifnar1−/− or WT GFP 4T07 cells were mixed with WT H2B-miRFP670 4T07 cells (1:1) and were injected into BALB/c mice. WT GFP+ and H2B-miRFP670+ 4T07 cells were injected into NSG mice as no T cell controls. All cancer cells carried tdTomato-p27K reporter. 5M Jedi T cells were injected into all BALB/c mice. Mean ± SEM of percentage of tdTomato-p27KHigh cells in each group is shown. *p < 0.05, **p < 0.01, ***p < 0.001, ****p < 0.0001.
Figure 2.
Figure 2.. Tumor cell quiescence leads to exclusion of T cells
(A–C) Assessment of tumor initiation potential in QCCs. mCherry+ mVenus-p27KHigh and mCherry+ mVenus-p27KNeg cancer cells were isolated from 4T07, EMT6, and D2A1 tumors. Live sorted cells (500 for EMT6 and 1,000 for 4T07 and D2A1) were injected in new mice. (A) Schematic. (B) Representative picture 4T07 cells. (C) Percentage of tumor growth (4T07, n = 6; EMT6, n = 3; D2A1, n = 3). (D) Immunofluorescence analysis of CD3+ cells in mCherry and mVenus-p27K-expressing 4T07, EMT6, and D2A1 mammary carcinomas (n = 4 mice). (E) Quantification of T cell density in mVenus-p27KHigh versus mVenus-p27KNeg areas in 4T07 tumors. Bar marks the median (n = 28 images from 3 mice). (F) CD4 and CD8 immunofluorescence in mVenus-p27K-expressing 4T07 tumors (n = 3 mice). (G) CD45 immunofluorescence in mVenus-p27K-expressing 4T07 tumors (n = 5 mice). Yellow dashed line marks mVenus-p27KHigh area. (H) Immunofluorescence analysis of CD3, p27, Ki67, and E-cadherin (E-cad) in tissue sections from TNBC de-identified patients (n = 10 patients). (I) Density of p27+ and Ki67+ tumor cells surrounding T cells from patients in (H). Each dot represents the averaged density of the corresponding marker (p27 or Ki67) in all analyzed areas from each patient. Bar marks the median. (J) Patient cohort treated with ICB at DFCI (n = 29 patients). (K) Most significantly upregulated transcriptional program in durable responders compared with non-responders in (J). ****p < 0.0001.
Figure 3.
Figure 3.. QCCs are hypoxic and glycolytic
(A) RNA-seq analysis of mCherry+ mVenus-p27KHigh and mCherry+ mVenus-p27KNeg cells from 4T07, EMT6, and D2A1 tumors. Heatmaps show differentially expressed genes involved in stemness and chemotherapy resistance (B) Pathway enrichment analysis from (A) showing top upregulated pathways by adjusted p value. (C) Heatmap shows hypoxia-induced differentially expressed genes in (B). Data is color coded to reflect gene expression Z scores. (D and E) Pimonidazole in 4T07 (D) and EMT6 (E) tumors expressing mVenus-p27K (n = 3 mice/model). (F) Pimonidazole in GFP:mCherry 4T07 tumors 7 days after treatment with 5M Jedi T cells (n = 5 mice). (G) Mean ± SEM of mean fluorescent intensity (MFI) of 2-NBD-glucose (n = 3 mice). ***p < 0.001.
Figure 4.
Figure 4.. scRNA-seq analysis inside the QCC niche reveals higher T cell exhaustion
(A) Schematic of PADME-seq. (B) Representative image after photo-conversion. White dashed line marks photoconverted area. (C) Uniform manifold approximation and projection (UMAP) visualization of cell clusters identified from PADME-seq. (D and E) Unsupervised gene-set enrichment analysis performed in the fibroblast population comparing cells from p27KHigh versus p27KNeg areas. (D) GO term pathways. (E) Heatmap with the average expression across populations in set signature genes from (D). Z score normalized data are shown. (F) UMAP visualization of reclustered T cells from (C). (G) Unsupervised gene-set enrichment analysis performed in all CD8 T cells comparing p27High versus p27Neg areas. (H) Distribution of CD8+ T cell sub-populations identified in (F). **adj. p value < 0.01. (I) Flow cytometry analysis of infiltrating cells in p27KHigh areas versus p27KNeg (n = 4 mice). (J and K) Exhausted PD1+ TIM3+ CD3+ T cells by CODEX in untreated 4T07 tumors. (J) CD3+ T cell density in p27KHigh areas and p27KNeg. (K) Exhausted (TIM3+) and non-exhausted (TIM3—) CD3+ T cells inside p27KHigh versus p27KNeg areas. Bar marks the median (multiple areas from 4 tumors). Non-parametric Wilcoxson test was used. (L–N) Quantification of exhausted PD1+ TIM3+ CD3+ T cells by CODEX in Thy1.1:GFP tumors after treatment with 5M Jedi T cells (multiple areas from 3 tumors). (L) Representative image, arrows point to T cells. (M) Exhausted (TIM3+) and non-exhausted (TIM3—) CD3+ T cells in GFP+ versus Thy1.1+ regions. (N) TIM3+/ CD3+ T cell ratio in GFP+ areas versus Thy1.1+ areas. Bar marks the median. *p < 0.05, **p < 0.01, ***p < 0.001.
Figure 5.
Figure 5.. Dendritic cells within the QCC niche downregulate key genes for T cell activation
(A) Difference in expression of hypoxic signature comparing cells from p27KHigh versus p27KNeg regions from Figure 4C. *adj. p value < 0.05. (B) Gene-set enrichment analysis from all cDCs (DC1, DC2, and mregDC) comparing cells from p27KHigh versus p27KNeg areas. (C) Gene-set enrichment analysis from DC2, comparing cells from p27KHigh versus p27KNeg areas. (D) Heatmap of differentially expressed interferon-induced genes comparing DC2 from p27KHigh versus p27KNeg areas. (E) Heatmap of differentially expressed key functional genes in mregDC from p27KHigh versus p27KNeg areas. Z score normalized data is shown. (F) Representative immunofluorescence image of MHCII and CD11c staining in mVenus-p27K-expressing tumors (n = 3 tumors). Yellow dashed line marks mVenus-p27KHigh area. Arrows point at CD11c+ MHCIILow cells. (G) MHCII in CD11c+ cells in D. Bar marks the median (4 images from 3 tumors). (H) MHCII in DCs from untreated 4T07 tumors (Figures 4J and 4K) from CODEX. DCs were identified as CD45+ CD11c+ F4/80— CD3—. Bar marks the median (n = 4 tumors). (I) Representative images from (H). Arrows point at F4/80-, CD11c+ cells. (J) MHCII in DCs by CODEX from GFP:Thy1.1 tumors after treatment with 5M Jedi T cells (Figures 4L–4N). Bar marks the median. *p < 0.05, ****p < 0.0001.
Figure 6.
Figure 6.. HIF1a in tumor cells modulates T cell infiltration and exhaustion, controlling killing of tumor cells
(A) Percentage of CD8+ T cells in WT or Hif1aSTBL 4T07 tumors (n = 5 mice). (B and C) T cell exhaustion in CD8+ T cells from (A). (B) Representative plot. (C) Mean ± SEM of PD1+ TIM3— CD8+ T cells (n = 6 mice). (D) MHCII in tumors in (A) (n = 3 mice). (E) Mean ± SEM of MFI from (D). (F) Schematic: mixed WT mCherry with WT GFP or WT mCherry with Hif1aSTBL GFP 4T07 cells were used to grow tumors. Mice were treated with 7M Jedi T cells (n = 5 mice). (G) Mean ± SEM of CD8+ T cells per gram of tumor from mice in (F) (n = 5 mice). (H) CD3 staining in tumors from (F). (I) Flow cytometry of surviving GFP+ cells in tumors from (F). (J) Mean ± SEM of GFP:mCherry cells ratio in tumors from (F). (K) Area under the curve of tumor size in Hif1a_/_GFP and WTGFP tumors upon treatment with 5M Jedi T cells. Arrowindicates time of Jedi injection (n = 4 mice). (L) Mean ± SEM of percentage of CD8+ T cells in tumors from (K). (M) Mean ± SEM of percentage of Jedi T cells (CD45.1+) in tumors from (K). (N) Mean ± SEM of percentage of TIM3_ PD1+ Jedi T cells in tumors from (K). (O) Effects HIFaSTBL in tumor cells. *p < 0.05, **p < 0.01, ***p < 0.001.

Comment in

References

    1. Agudo J, Park ES, Rose SA, Alibo E, Sweeney R, Dhainaut M, Kobayashi KS, Sachidanandam R, Baccarini A, Merad M, and Brown BD (2018). Quiescent tissue stem cells evade immune surveillance. Immunity 48, 271–285.e5. - PMC - PubMed
    1. Agudo J, Ruzo A, Park ES, Sweeney R, Kana V, Wu M, Zhao Y, Egli D, Merad M, and Brown BD (2015). GFP-specific CD8 T cells enable targeted cell depletion and visualization of T-cell interactions. Nat. Biotechnol. 33, 1287–1292. - PMC - PubMed
    1. Agudo J, Ruzo A, Tung N, Salmon H, Leboeuf M, Hashimoto D, Becker C, Garrett-Sinha L-A, Baccarini A, Merad M, and Brown BD (2014). The miR-126–VEGFR2 axis controls the innate response to pathogen-associated nucleic acids. Nat. Immunol. 15, 54–62. - PMC - PubMed
    1. Beltra JC, Manne S, Abdel-Hakeem MS, Kurachi M, Giles JR, Chen Z, Casella V, Ngiow SF, Khan O, Huang YJ, et al. (2020). Developmental relationships of four exhausted CD8+ T cell subsets reveals underlying transcriptional and epigenetic landscape control mechanisms. Immunity 52, 825–841.e8. - PMC - PubMed
    1. Binnewies M, Roberts EW, Kersten K, Chan V, Fearon DF, Merad M, Coussens LM, Gabrilovich DI, Ostrand-Rosenberg S, Hedrick CC, et al. (2018). Understanding the tumor immune microenvironment (TIME) for effective therapy. Nat. Med. 24, 541–550. - PMC - PubMed

Publication types

MeSH terms

Substances