. 2022 May 23;57(10):1211-1225.e6.
doi: 10.1016/j.devcel.2022.03.019. Epub 2022 Apr 20.

Mitochondrial dynamics regulate genome stability via control of caspase-dependent DNA damage

Affiliations

Mitochondrial dynamics regulate genome stability via control of caspase-dependent DNA damage

Kai Cao et al. Dev Cell. .

Abstract

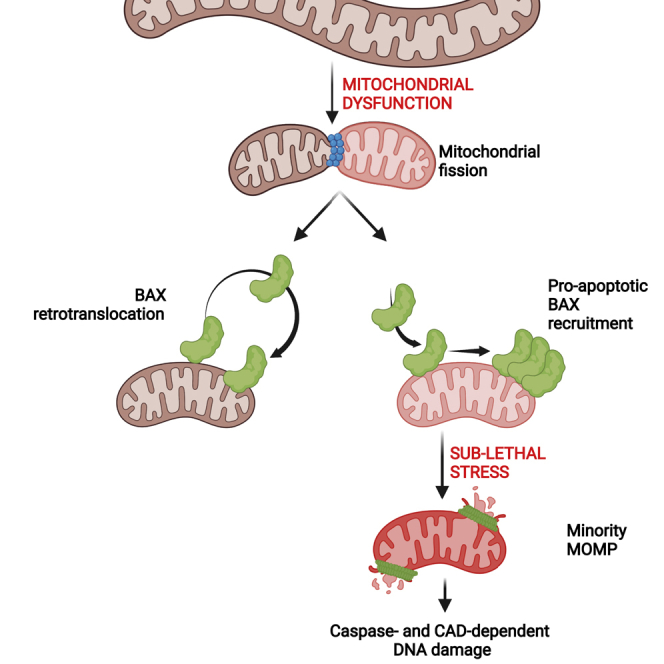
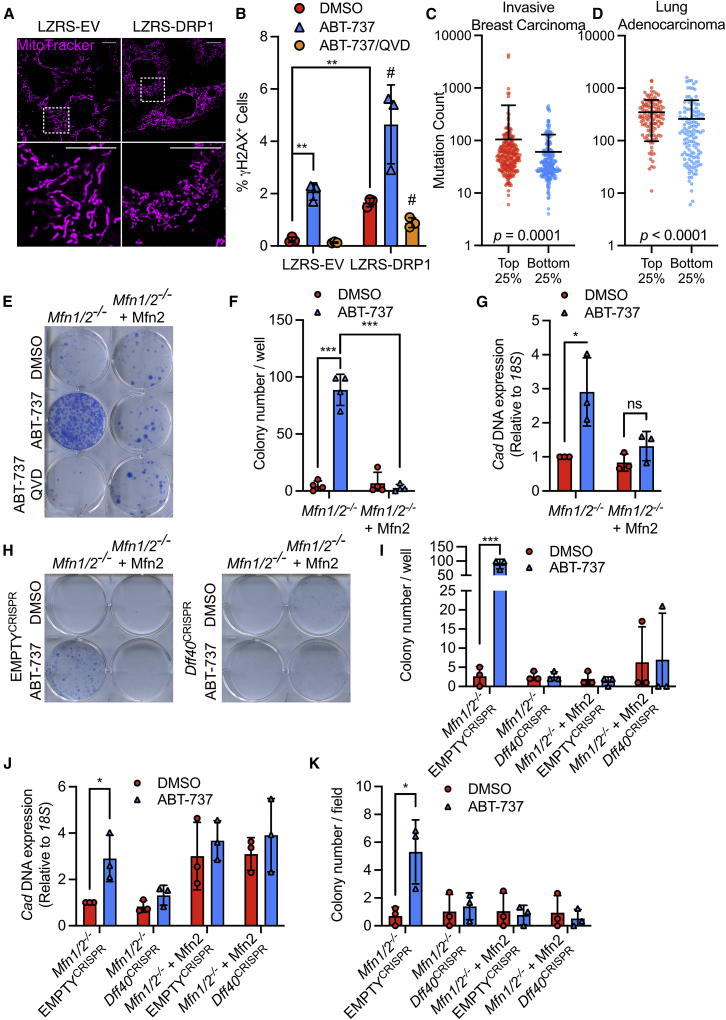
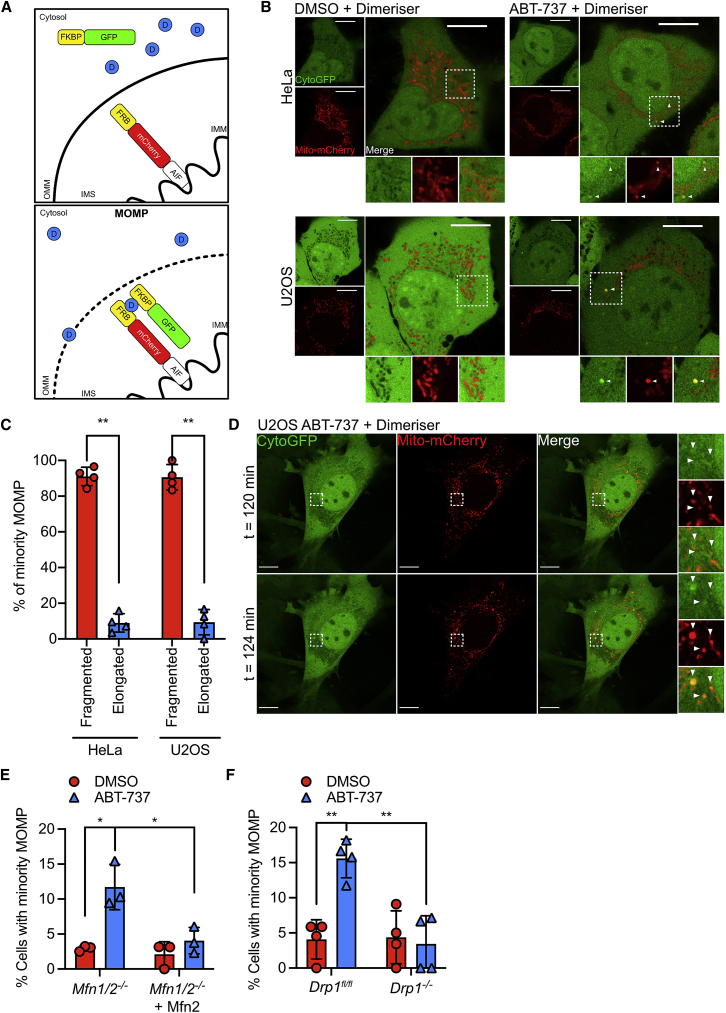
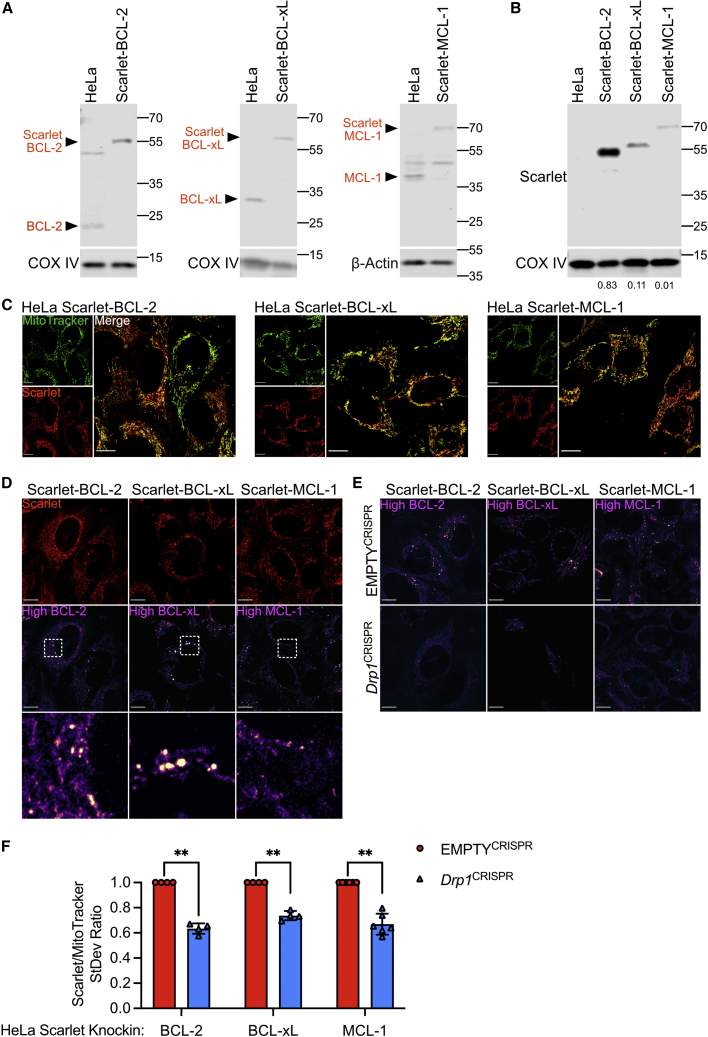
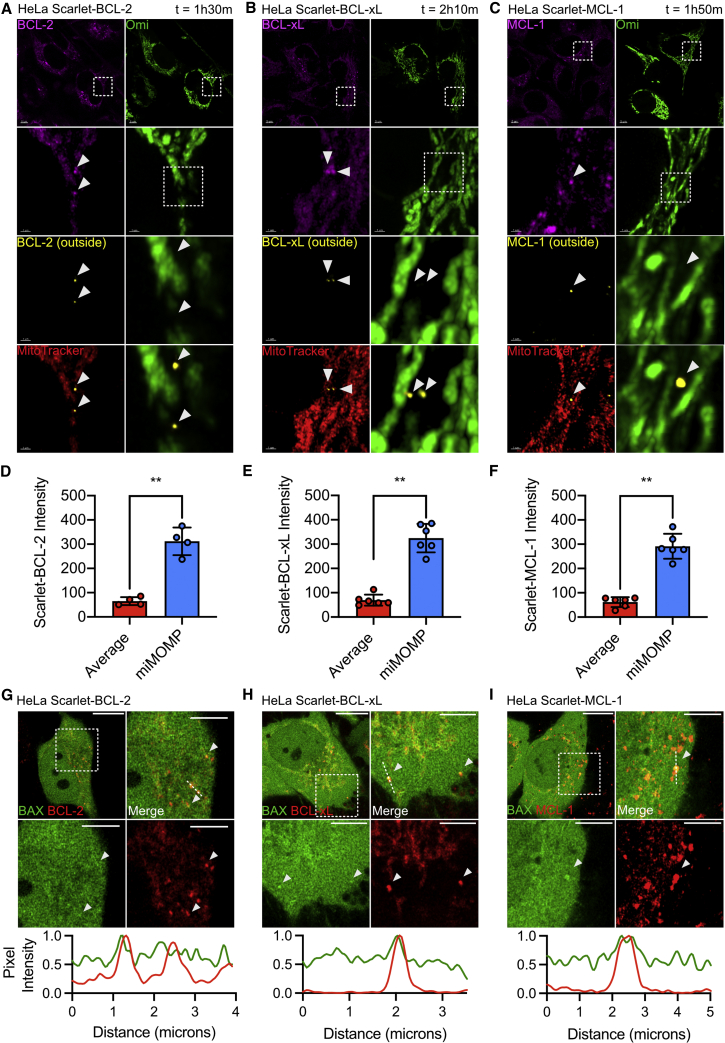
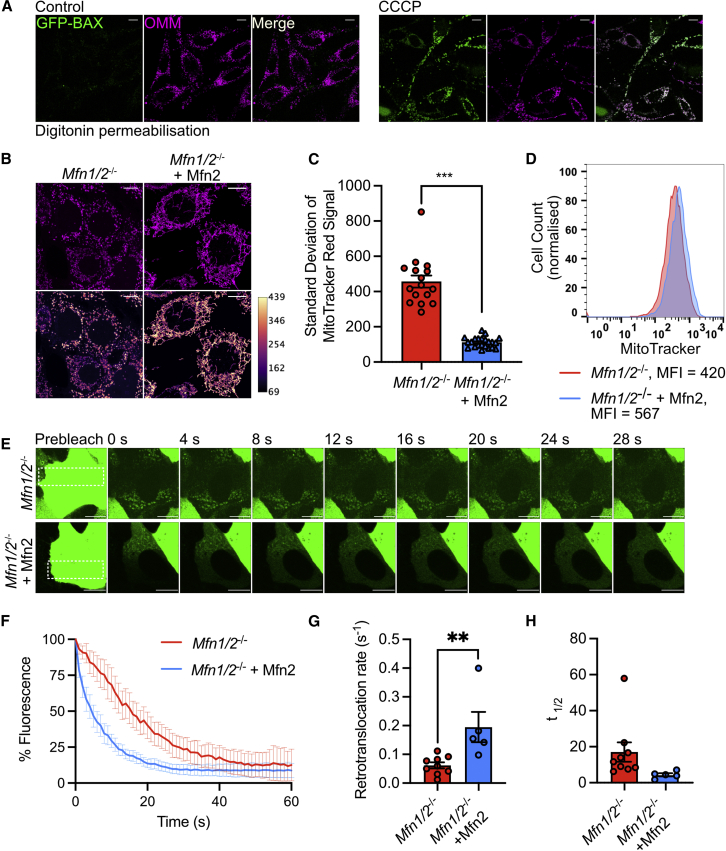
Mitochondrial dysfunction is interconnected with cancer. Nevertheless, how defective mitochondria promote cancer is poorly understood. We find that mitochondrial dysfunction promotes DNA damage under conditions of increased apoptotic priming. Underlying this process, we reveal a key role for mitochondrial dynamics in the regulation of DNA damage and genome instability. The ability of mitochondrial dynamics to regulate oncogenic DNA damage centers upon the control of minority mitochondrial outer membrane permeabilization (MOMP), a process that enables non-lethal caspase activation leading to DNA damage. Mitochondrial fusion suppresses minority MOMP and its associated DNA damage by enabling homogeneous mitochondrial expression of anti-apoptotic BCL-2 proteins. Finally, we find that mitochondrial dysfunction inhibits pro-apoptotic BAX retrotranslocation, causing BAX mitochondrial localization and thereby promoting minority MOMP. Unexpectedly, these data reveal oncogenic effects of mitochondrial dysfunction that are mediated via mitochondrial dynamics and caspase-dependent DNA damage.

Keywords: DNA damage; MOMP; apoptosis; cancer; caspase; cell death; fission; fusion; mitochondrial dynamics.


Conflict of interest statement

Declaration of interests The authors declare no competing interests.

Figures

None
Graphical abstract
Figure 1
Figure 1
Mitochondrial dynamics regulate DNA damage (A) Flow cytometric analysis of HeLa and U2OS cells treated with 10 μM CCCP for 30 min before treatment with 10 μM ABT-737 for 3 h. Cells were immunostained with anti-ɣH2AX antibody. Data represented as mean ± SEM from 3 independent experiments and analyzed using Student’s t test. (B) Airyscan images of U2OS cells treated with 10 μM ABT-737 for 3 h or 20-Gy irradiation for 4 h. Cells were immunostained with anti-pATM (red) or anti-ɣH2AX (green) antibody. Images representative of 3 independent experiments. Scale bars, 10 μm. (C) Airyscan images of Mfn1/2/ and Mfn1/2/ + Mfn2 MEF, immunostained with anti-TOM20 antibody. Scale bars, 10 μm. (D) Immunoblot of MFN2 and β-tubulin (loading control) in Mfn1/2/ and Mfn1/2/ + Mfn2 MEF. (E) Immunoblot of ɣH2AX and β-tubulin (loading control) in Mfn1/2/ and Mfn1−/− + MFN2 MEF treated with 10 μM ABT-737 for 3 h. Data are representative of 3 independent experiments. (F) Flow cytometric analysis of ɣH2AX expression in Mfn1/2/ and Mfn1/2/ + MFN2 MEF treated with 10 μM ABT-737 for 3 h. Data represented as mean (SD) from 5 independent experiments and analyzed using Student’s t test. (G) Mfn1/2/ and Mfn1/2/ + MFN2 MEF were cultured for twenty passages in 10 μM ABT-737 and their anchorage-independent growth assessed by soft agar assay. Representative images from 3 independent experiments shown. (H) Quantification of anchorage-independent growth in soft agar from (G). Data are expressed as mean (SD) from 3 independent experiments and analyzed using Student’s t test. (I) Airyscan images of Drp1fl/fl MEF infected with AdCre (Drp1−/−) and immunostained with anti-TOM20 antibody. Scale bars, 10 μm. (J) Flow cytometric analysis of ɣH2AX expression in Drp1fl/fl and Drp1−/− MEF treated with 10 μM ABT-737 for 3 h. Data are expressed as mean ± SEM from 3 independent experiments and analyzed using Student’s t test. Statistics: p ≤ 0.05, ∗∗p ≤ 0.01, ∗∗∗p ≤ 0.001. See also Figure S1.
Figure 2
Figure 2
Mitochondrial dynamics regulate DNA damage and genome instability in a caspase- and CAD-dependent manner (A) Airyscan images of MEF overexpressing LZRS-DRP1 or LZRS empty vector, stained with MitoTracker Deep Red. Lower panels represent the area in the region depicted. Scale bars, 10 μm. (B) Flow cytometric analysis of MEF stably overexpressing LZRS control or LZRS-DRP1, treated with 10 μM ABT-737, with and without 20 μM qVD-OPh, for 3 h. Data are expressed at mean (SD) from 3 independent experiments and analyzed using Student’s t test. (C) Mutation counts in patient lung adenocarcinoma samples from the highest and lowest DNM1L mRNA quartiles. Significance is analyzed by Mann-Whitney test. Data points represent individual patient samples, bar represents mean (SD). (D) Mutation counts in patient breast invasive carcinoma cancer samples from the highest and lowest DNM1L mRNA quartiles. Significance is analyzed by Mann-Whitney test. Data points represent individual patient samples, bar represents mean (SD). (E) Mfn1/2/ and Mfn1/2/ + Mfn2 MEF were treated daily for twenty passages with 10 μM ABT-737, with and without 20 μM qVD-OPh. Clonogenic survival was performed in the presence of 100 μM PALA. Data are a representative example of 4 independent experiments. (F) Quantification of clonogenic outgrowth from 4 independent experiments. Data are expressed as mean (SD) and analyzed using Student’s t test. (G) Quantification of Cad DNA levels in Mfn1/2/ and Mfn1/2/ + MFN2 MEF, treated with or without 10 μM ABT-737. Data are expressed as mean (SD) from 3 independent experiments and analyzed using Student’s t test. (H) Mfn1/2/ and Mfn1/2/ + MFN2 MEF, with and without CRISPR-Cas9-mediated Dff40 deletion, treated daily for twenty passages with 10 μM ABT-737, with and without 20 μM QVD. Clonogenic survival was performed in the presence of 100 μM PALA. Data are a representative example of 3 independent experiments. (I) Quantification of clonogenic outgrowth from (H) from 3 independent experiments. Data are expressed as mean (SD) and analyzed using Student’s t test. (J) Quantification of Cad DNA levels in Mfn1/2/ and Mfn1/2/ + MFN2 MEF, with and without Dff40 deletion, and treated with or without 10 μM ABT-737. Data are expressed as mean (SD) from 3 independent experiments and analyzed using Student’s t test. (K) Mfn1/2/ and Mfn1/2/ + MFN2 MEF, with and without Dff40 deletion, cultured for twenty passages in 10 μM ABT-737 and their anchorage-independent growth assessed by soft agar assay. Data are expressed as mean (SD) from 3 independent experiments and analyzed using Student’s t test. Statistics: p ≤ 0.05, ∗∗p ≤ 0.01, ∗∗∗p ≤ 0.001. See also Figures S2 and S3 and Table S1.
Figure 3
Figure 3
Minority MOMP occurs on fragmented mitochondria and is regulated by mitochondrial dynamics (A) Schematic of the MOMP reporter. (B) Fixed super-resolution Airyscan images of HeLa and U2OS cells transfected with cytoGFP (green) and mito-mCherry (red). Cells were treated with 10 μM ABT-737 for 3 h in the presence of dimerizer. Scale bars, 10 μm. (C) Quantification of fragmentation or elongation of mitochondria which have undergone minority MOMP, as visualized in (B). Data represented as mean (SD) from 4 independent experiments and analyzed using Student’s t test. (D) Live-cell Airyscan imaging of U2OS cells transfected with cytoGFP (green) and mito-mCherry (red), and treated with 10 μM ABT-737 in the presence of dimerizer. Scale bars, 10 μm. See Video S1. (E) Quantification of minority MOMP assessed in Mfn1/2/ and Mfn1−/− MEF, transfected with cyto-GFP and mito-mCherry. Cells were treated with 10 μM ABT-737 for 3 h in the presence of dimerizer. Data represented as mean (SD) from 3 independent experiments. (F) Quantification of minority MOMP assessed in WT and Drp1fl/fl MEF, transfected with cyto-GFP and mito-mCherry. Cells were treated with 10 μM ABT-737 for 3 h in the presence of dimerizer. Data represented as mean (SD) from 4 independent experiments. Statistics: p ≤ 0.05, ∗∗p ≤ 0.01, ∗∗∗p ≤ 0.001. See also Figure S4.
Figure 4
Figure 4
Pro-survival BCL-2 proteins display inter-mitochondrial heterogeneity in expression (A) Immunoblots of HeLa cells with CRISPR-Cas9-mediated knockin of Scarlet into the BCL-2, BCL-xL, or MCL-1 locus using antibodies against BCL-2, BCL-xL, or MCL-1. COX IV or β-actin serves as loading controls. (B) Immunoblots of HeLa cells with CRISPR-Cas9-mediated knockin of Scarlet into the BCL-2, BCL-xL, or MCL-1 locus, using an antibody against Scarlet. COX IV serves as a loading control. Band quantification relative to COX IV loading shown below. (C) Live-cell Airyscan imaging of HeLa Scarlet-BCL-2, Scarlet-BCL-xL, and Scarlet-MCL-1 (red) cells. Cells were incubated with MitoTracker Green (green) to stain mitochondria. Scale bars, 10 μm. (D) Live-cell Airyscan imaging of HeLa Scarlet-BCL-2, Scarlet-BCL-xL, and Scarlet-MCL-1 (red) cells. Magenta LUT applied to reveal areas of high BCL-2, BCL-XL, and MCL-1 expression. Scale bars, 10 μm. (E) Live-cell Airyscan imaging of HeLa Scarlet-BCL-2, Scarlet-BCL-xL, and Scarlet-MCL-1 cells, with and without CRISPR-Cas9-mediated Drp1 deletion. Magenta LUT applied to reveal areas of high BCL-2, BCL-XL, and MCL-1 expression. Scale bars, 10 μm. (F) Quantification of Scarlet to MitoTracker signal standard deviation in HeLa Scarlet-BCL-2, Scarlet-BCL-xL, and Scarlet-MCL-1 cells, with and without CRISPR-Cas9-mediated Drp1 deletion. Data are expressed as mean (SD) from 4 to 5 independent experiments and analyzed using Student’s t test. Statistics: p ≤ 0.05, ∗∗p ≤ 0.01, ∗∗∗p ≤ 0.001. See also Figure S5.
Figure 5
Figure 5
Heterogeneity in apoptotic priming underpins minority MOMP (A) Live-cell Airyscan imaging of HeLa Scarlet-BCL-2 (magenta) transfected with Omi-GFP (green) and incubated with MitoTracker Deep Red (red). Cells were treated with 10 μM ABT-737 for the time indicated. Images were processed with Imaris to determine BCL-2, BCL-xL, or MCL-1 expression (yellow) at mitochondrial areas lacking Omi-GFP expression. Scale bar as indicated on images. (B) HeLa Scarlet-BCL-xL imaged as (A). (C) HeLa Scarlet-MCL-1 imaged as (A). (D) Quantification of Scarlet-BCL-2 intensity at mitochondrial regions determined by MitoTracker Deep Red staining but lacking Omi-GFP. Data are expressed as mean (SD) and analyzed using Student’s t test. (E) HeLa Scarlet-BCL-xL quantified as (D). (F) HeLa Scarlet-MCL-1 quantified as (D). (G) Live-cell Airyscan imaging of HeLa Scarlet-BCL-2 (red) cells stably overexpressing GFP-BAX (green). Arrows indicate regions of high BCL-2 expression with high GFP-BAX expression. Scale bars, 10 μm. Dotted line represents pixel intensities for the dotted track shown, GFP-BAX in green and BCL-2 in red. (H) Live-cell Airyscan images of HeLa Scarlet-BCL-xL (red) cells stably overexpressing GFP-BAX (green). Arrows indicate regions of high BCL-xL expression with high GFP-BAX expression. Scale bars, 10 μm. Dotted line represents pixel intensities for the dotted track shown, GFP-BAX in green and BCL-xL in red. (I) Live-cell Airyscan images of HeLa Scarlet-MCL-1 (red) cells stably overexpressing GFP-BAX (green). Arrows indicate regions of high MCL-1 expression with high GFP-BAX expression. Scale bars, 10 μm. Dotted line represents pixel intensities for the dotted track shown, GFP-BAX in green and MCL-1 in red. Statistics: p ≤ 0.05, ∗∗p ≤ 0.01, ∗∗∗p ≤ 0.001. See also Figure S6.
Figure 6
Figure 6
Mitochondrial dysfunction promotes BAX accumulation on mitochondria promoting minority MOMP (A) HeLa cells stably expressing GFP-BAX (green) and Omp25-iRFP (outermitochondrial membrane {OMM}, magenta), treated with and without 10 μM of CCCP for 30 min prior to digitonin permeabilization. See Videos S2 and S3. (B) Mfn1/2/ and Mfn1/2/ + MFN2 MEF pulsed with MitoTracker Red and imaged. Images with magenta LUT applied are shown in lower panels. Scale bars, 10 μm. Data are representative from three independent experiments. (C) Standard deviation of MitoTracker Red signal in Mfn1/2/ and Mfn1/2/ + MFN2 MEF pulsed with MitoTracker Red acquired using Airyscan. Data are expressed as mean ± SEM from three independent experiments and analyzed using Student’s t test. (D) Fluorescence profiles of Mfn1/2/ and Mfn1/2/ + MFN2 MEF pulsed with MitoTracker Red. Data are representative of 2 independent experiments. (E) Mfn1/2/ and Mfn1/2/ + Mfn2 MEF stably expressing GFP-BAX (green) imaged pre- and post-bleaching to reveal mitochondrially localized GFP-BAX. Scale bars, 10 μm. See Videos S6 and S7. (F) FLIP analysis of Mfn1/2/ and Mfn1/2/ + MFN2 MEF stably overexpressing GFP-BAX. Mitochondrial GFP-BAX dissociation was imaged over 60 s and the first image post-bleaching is set to 0 s. Data are expressed as mean ± SEM. Mfn1/2/ n = 9 cells; Mfn1/2/ + MFN2 n = 5 cells. (G) Retrotranslocation rates from cells analyzed in (F). Data expressed as mean ± SEM and analyzed using Student’s t test. (H) Half-life (t1/2) of GFP-BAX from cells analyzed in (F). Data expressed as mean ± SEM and analyzed using Student’s t test. Statistics: p ≤ 0.05, ∗∗p ≤ 0.01, ∗∗∗p ≤ 0.001. See also Figure S7.

References

    1. Bender C.E., Fitzgerald P., Tait S.W., Llambi F., McStay G.P., Tupper D.O., Pellettieri J., Sánchez Alvarado A., Salvesen G.S., Green D.R. Mitochondrial pathway of apoptosis is ancestral in metazoans. Proc. Natl. Acad. Sci. USA. 2012;109:4904–4909. - PMC - PubMed
    1. Berthenet K., Castillo Ferrer C., Fanfone D., Popgeorgiev N., Neves D., Bertolino P., Gibert B., Hernandez-Vargas H., Ichim G. Failed apoptosis enhances melanoma cancer cell aggressiveness. Cell Rep. 2020;31:107731. - PubMed
    1. Bhola P.D., Mattheyses A.L., Simon S.M. Spatial and temporal dynamics of mitochondrial membrane permeability waves during apoptosis. Biophys. J. 2009;97:2222–2231. - PMC - PubMed
    1. Bock F.J., Tait S.W.G. Mitochondria as multifaceted regulators of cell death. Nat. Rev. Mol. Cell Biol. 2020;21:85–100. - PubMed
    1. Brokatzky D., Dörflinger B., Haimovici A., Weber A., Kirschnek S., Vier J., Metz A., Henschel J., Steinfeldt T., Gentle I.E., Häcker G. A non-death function of the mitochondrial apoptosis apparatus in immunity. EMBO J. 2019;38:e100907. - PMC - PubMed

Publication types