

Rates of β-amyloid deposition indicate widespread simultaneous accumulation throughout the brain
- PMID: 35447369
- PMCID: PMC9986974
- DOI: 10.1016/j.neurobiolaging.2022.03.005
Rates of β-amyloid deposition indicate widespread simultaneous accumulation throughout the brain
Abstract
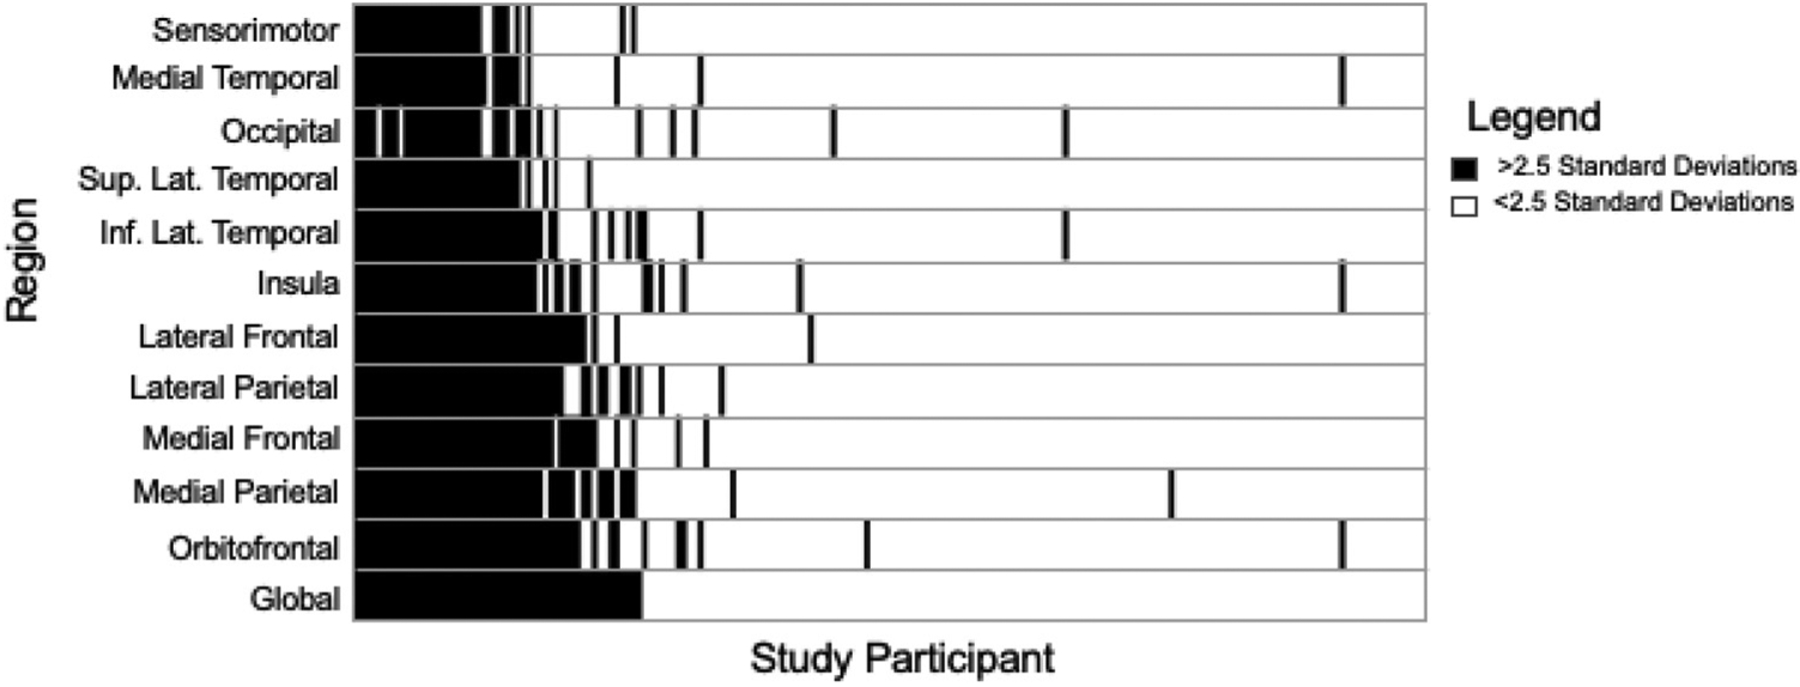
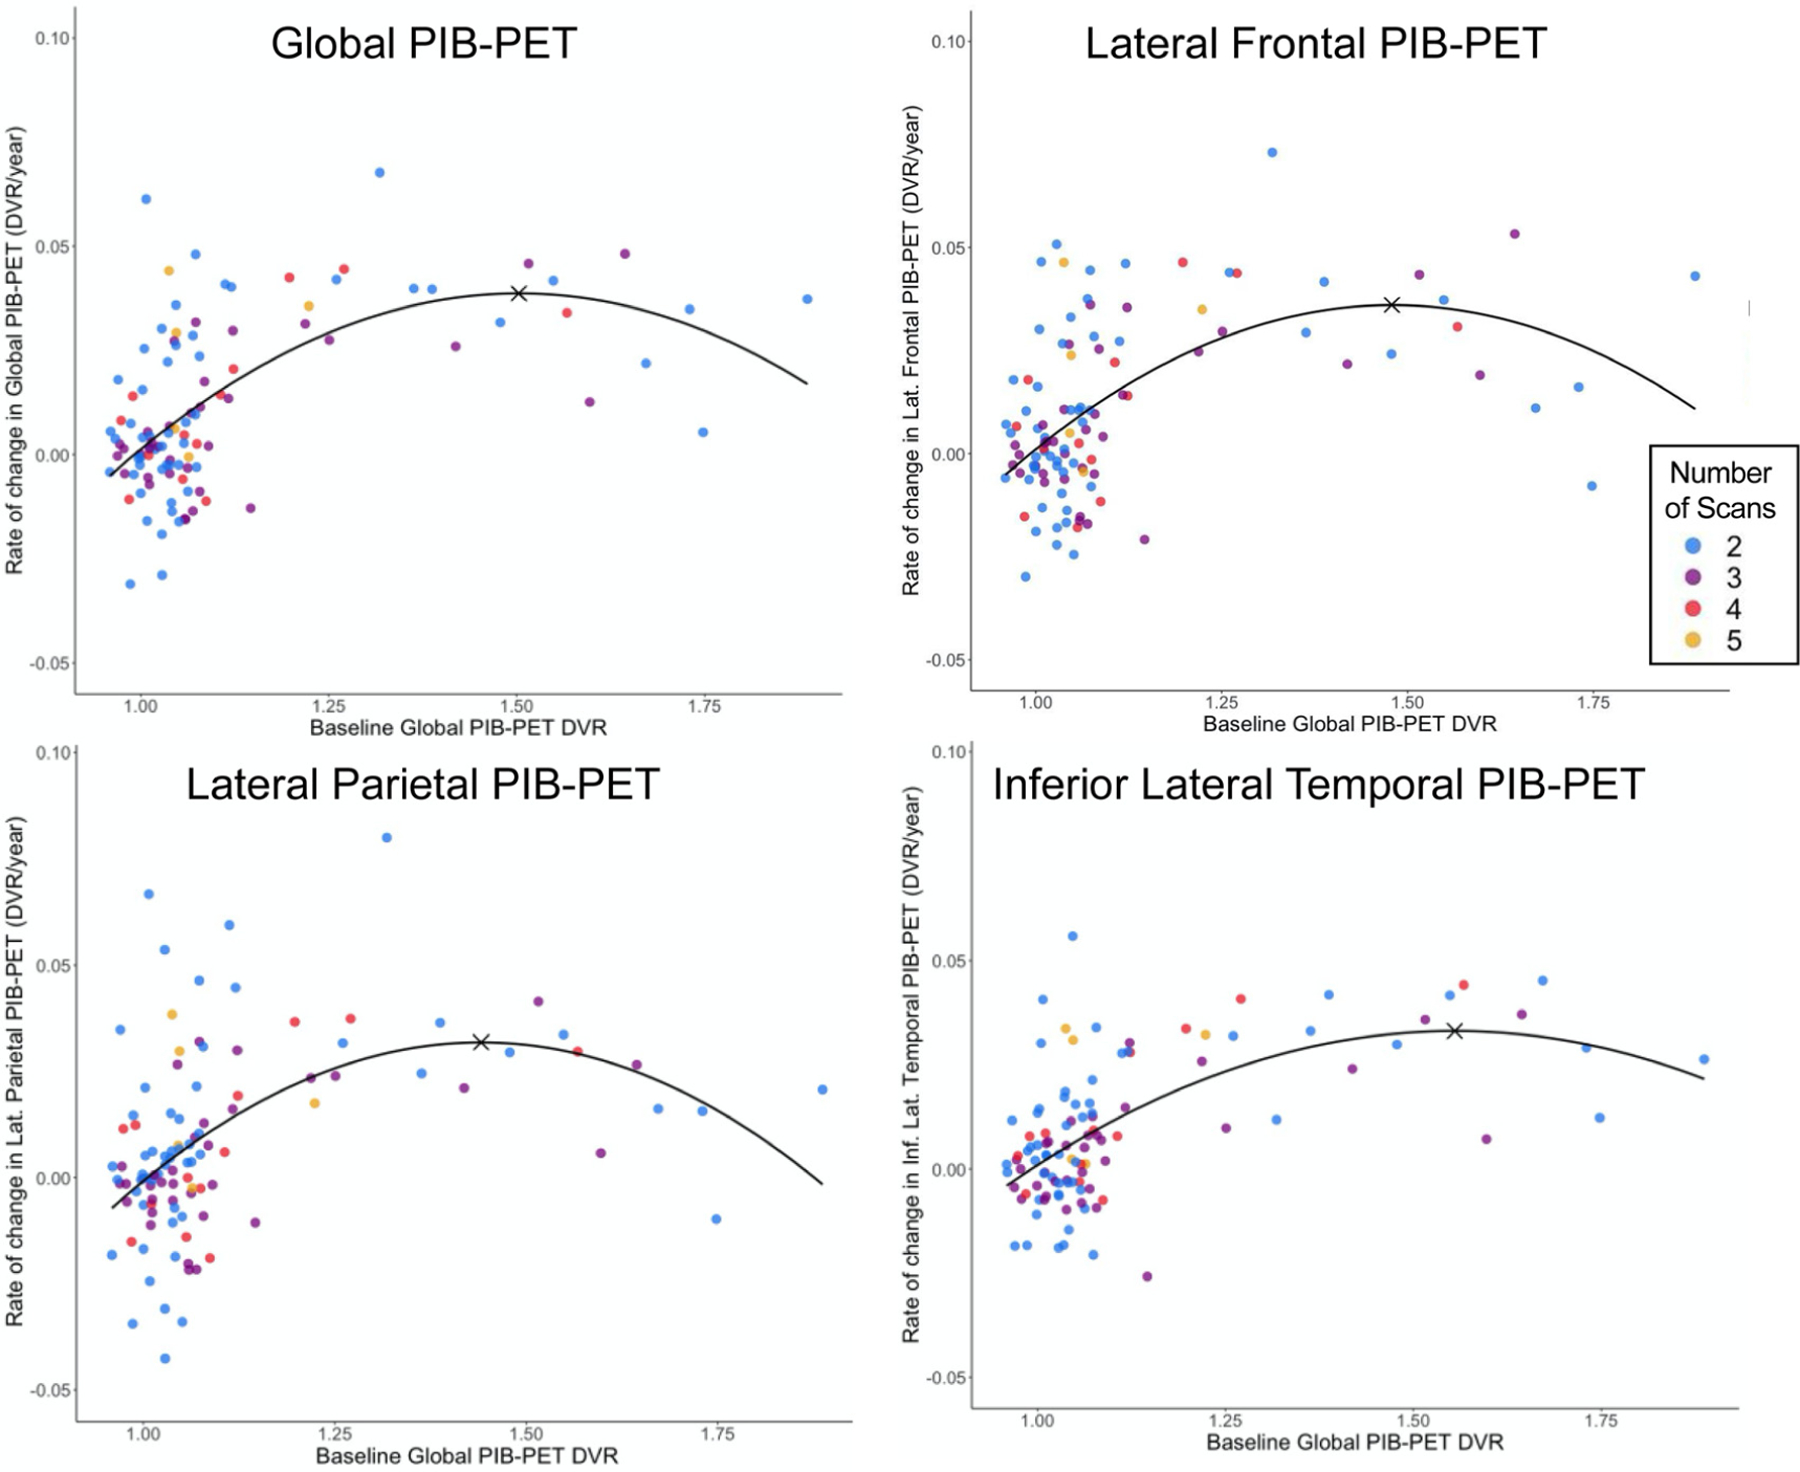
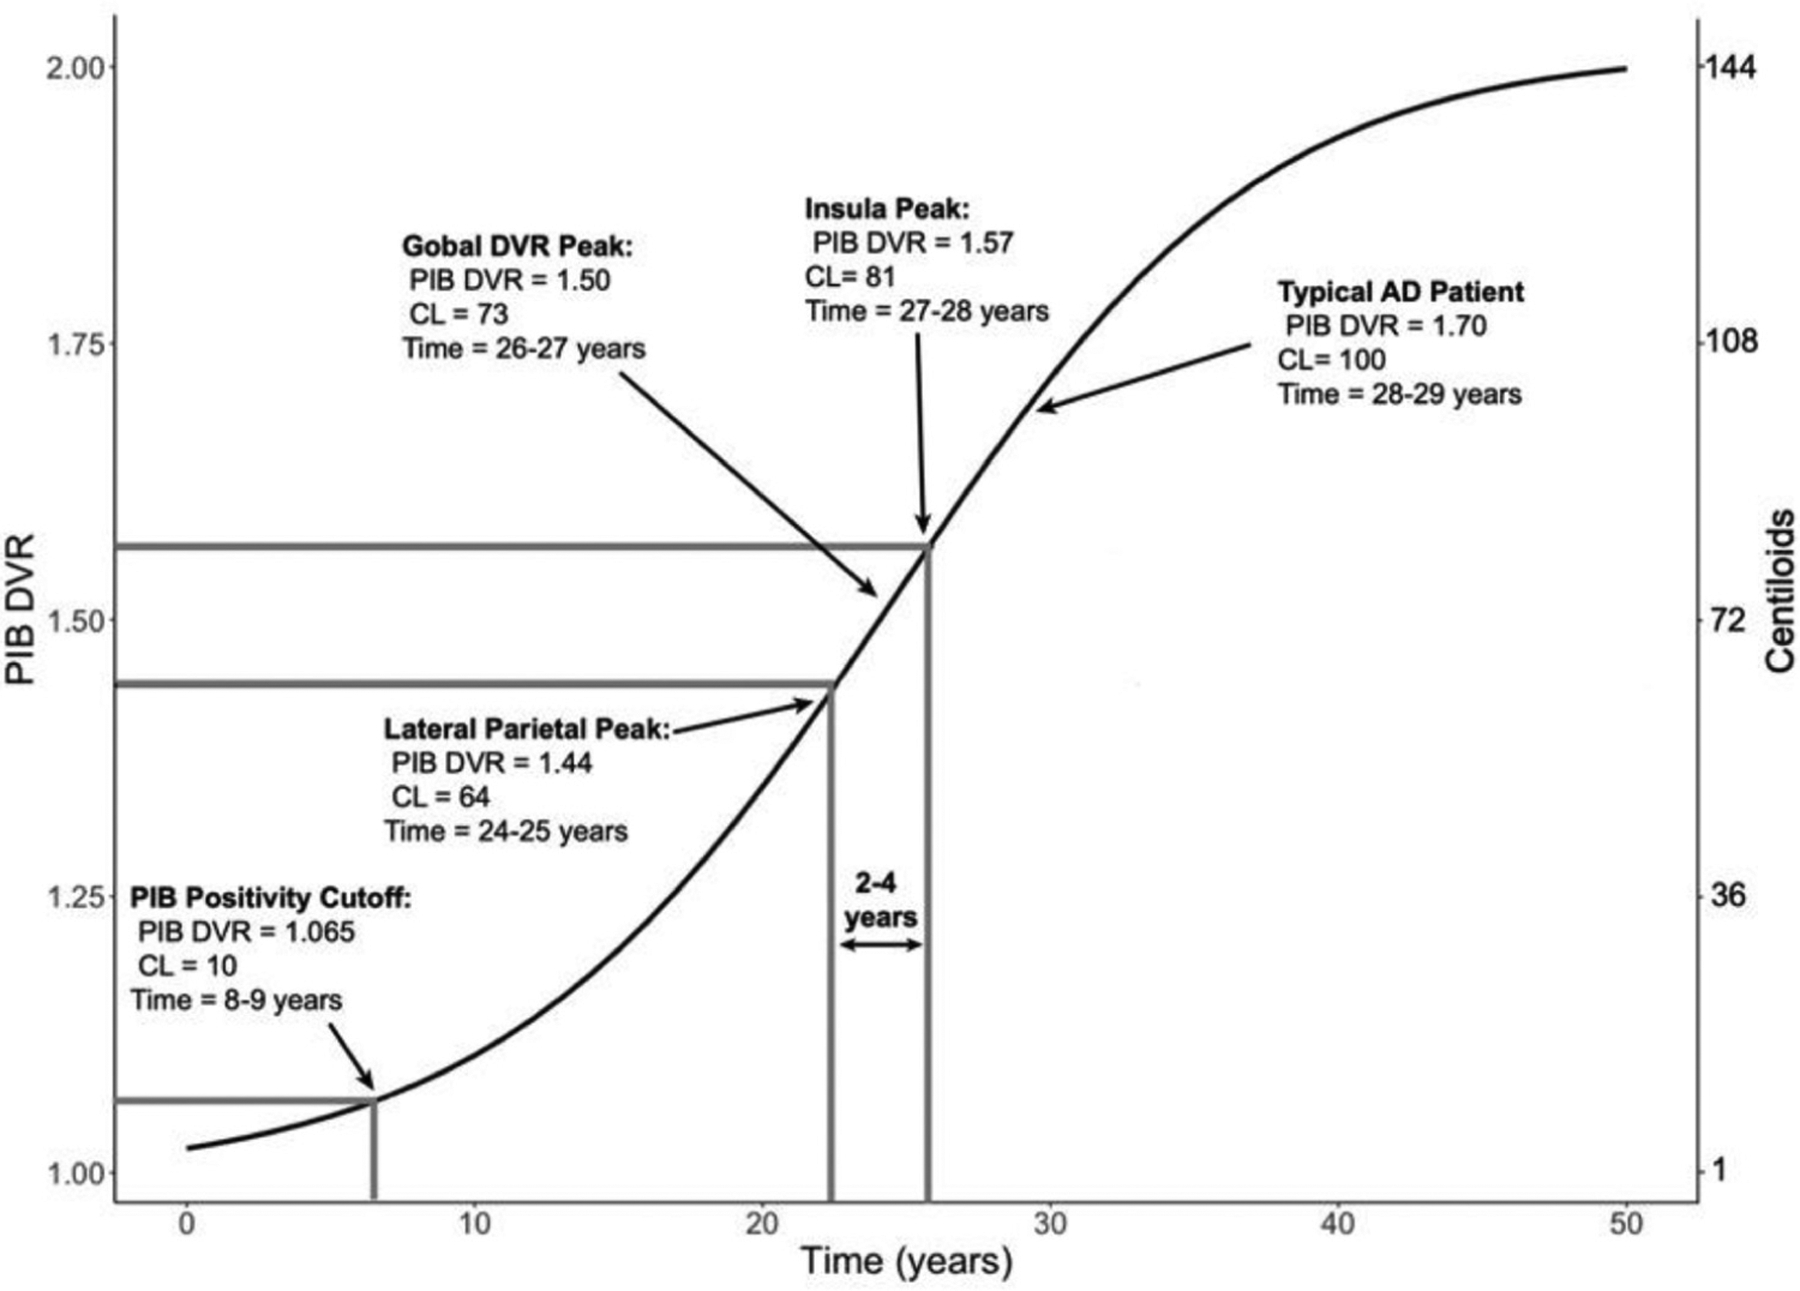
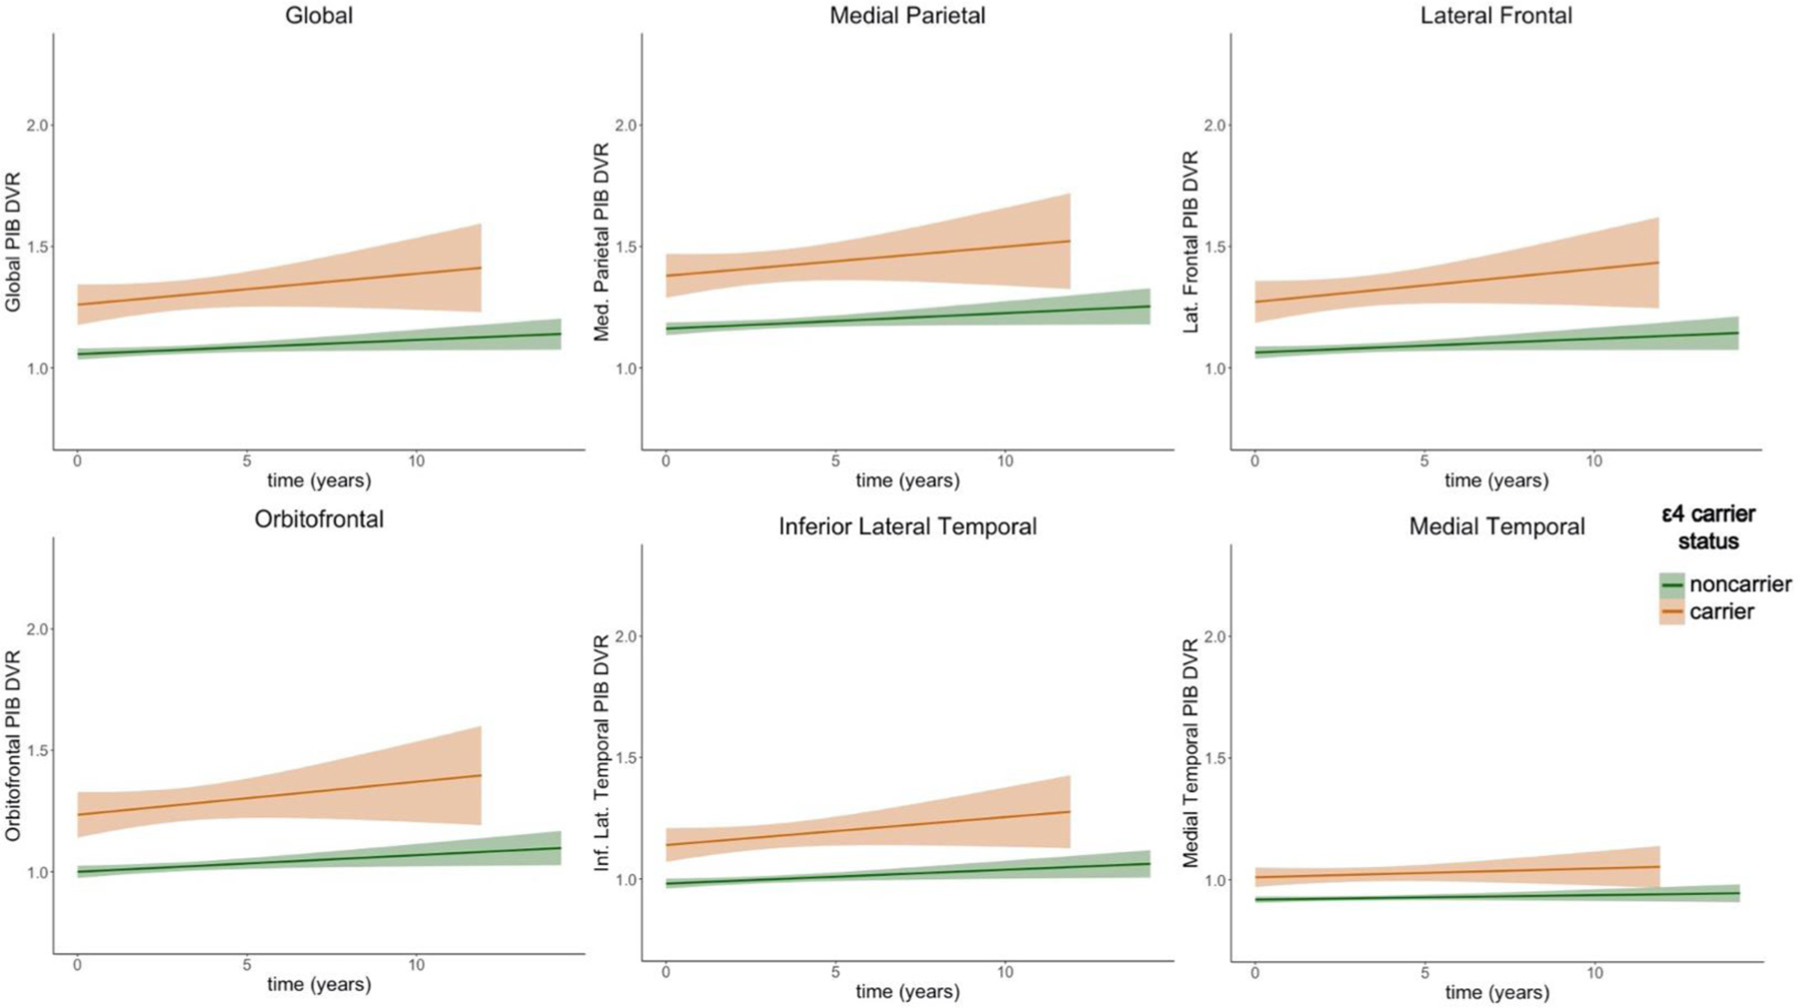
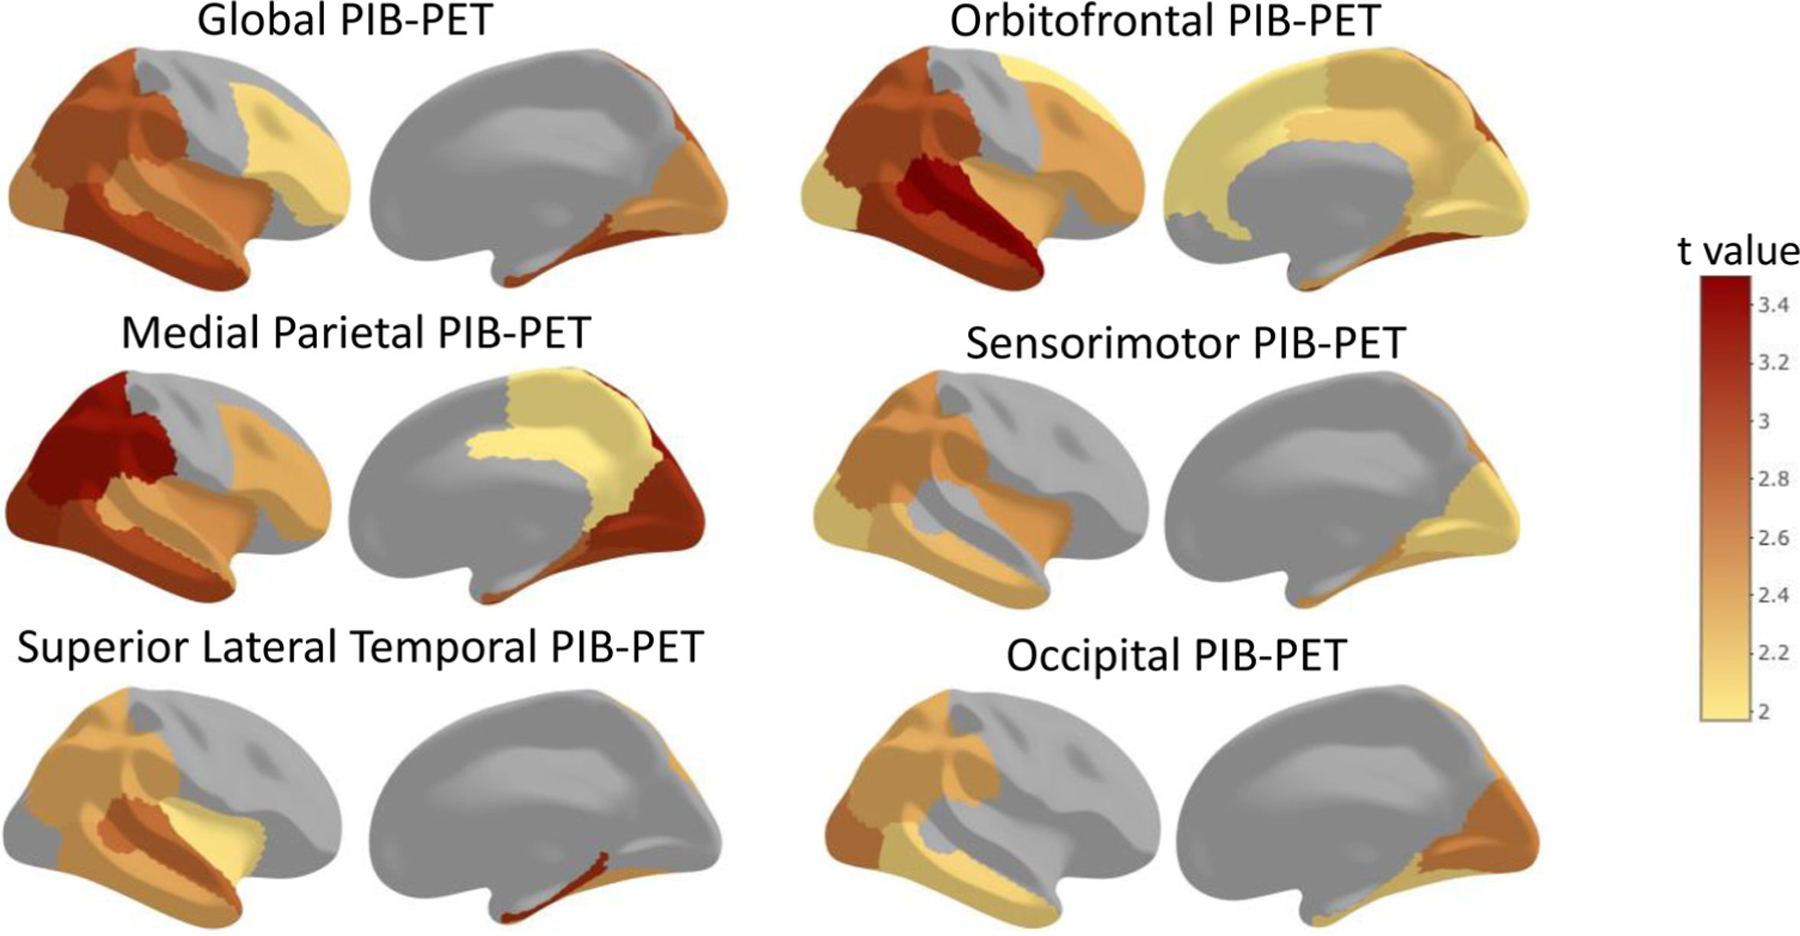
Amyloid plaque aggregation is a pathologic hallmark of Alzheimer's disease (AD) that occurs early in the disease. However, little is known about its progression throughout the brain. Using Pittsburgh Compound B (PIB)-PET imaging, we investigated the progression of regional amyloid accumulation in cognitively normal older adults. We found that all examined regions reached their peak accumulation rates 24-28 years after an estimated initiation corresponding to the mean baseline PIB-PET signal in amyloid-negative older adults. We also investigated the effect of increased genetic risk conferred by the apolipoprotein-E ɛ4 allele on rates of amyloid accumulation, as well as the relationship between regional amyloid accumulation and regional tau pathology, another hallmark of AD, measured with Flortaucipir-PET. Carriers of the ɛ4 allele had faster amyloid accumulation in all brain regions. Furthermore, in all regions excluding the temporal lobe, faster amyloid accumulation was associated with greater tau burden. These results indicate that amyloid accumulates near-simultaneously throughout the brain and is associated with higher AD pathology, and that genetic risk of AD is associated with faster amyloid accumulation.
Keywords: APOE; Aging; Alzheimer's Disease; Amyloid; Longitudinal; Tau.
Copyright © 2022. Published by Elsevier Inc.
Figures
Similar articles
-
The accumulation rate of tau aggregates is higher in females and younger amyloid-positive subjects.Brain. 2020 Dec 1;143(12):3805-3815. doi: 10.1093/brain/awaa327. Brain. 2020. PMID: 33439987 Free PMC article.
-
Tau Accumulation in Clinically Normal Older Adults Is Associated with Hippocampal Hyperactivity.J Neurosci. 2019 Jan 16;39(3):548-556. doi: 10.1523/JNEUROSCI.1397-18.2018. Epub 2018 Nov 27. J Neurosci. 2019. PMID: 30482786 Free PMC article.
-
Relationships between flortaucipir PET tau binding and amyloid burden, clinical diagnosis, age and cognition.Brain. 2017 Mar 1;140(3):748-763. doi: 10.1093/brain/aww334. Brain. 2017. PMID: 28077397 Free PMC article.
-
Pittsburgh Compound B and AV-1451 positron emission tomography assessment of molecular pathologies of Alzheimer's disease in progressive supranuclear palsy.Parkinsonism Relat Disord. 2018 Mar;48:3-9. doi: 10.1016/j.parkreldis.2017.12.016. Epub 2017 Dec 13. Parkinsonism Relat Disord. 2018. PMID: 29254665 Free PMC article.
-
Subthreshold Amyloid Predicts Tau Deposition in Aging.J Neurosci. 2018 May 9;38(19):4482-4489. doi: 10.1523/JNEUROSCI.0485-18.2018. Epub 2018 Apr 23. J Neurosci. 2018. PMID: 29686045 Free PMC article.
Cited by
-
Connectome-based modelling of neurodegenerative diseases: towards precision medicine and mechanistic insight.Nat Rev Neurosci. 2023 Oct;24(10):620-639. doi: 10.1038/s41583-023-00731-8. Epub 2023 Aug 24. Nat Rev Neurosci. 2023. PMID: 37620599 Review.
-
A review of the flortaucipir literature for positron emission tomography imaging of tau neurofibrillary tangles.Brain Commun. 2023 Nov 16;6(1):fcad305. doi: 10.1093/braincomms/fcad305. eCollection 2024. Brain Commun. 2023. PMID: 38187878 Free PMC article. Review.
-
Associations between regional blood-brain barrier permeability, aging, and Alzheimer's disease biomarkers in cognitively normal older adults.PLoS One. 2024 Jun 5;19(6):e0299764. doi: 10.1371/journal.pone.0299764. eCollection 2024. PLoS One. 2024. PMID: 38837947 Free PMC article.
-
New precision medicine avenues to the prevention of Alzheimer's disease from insights into the structure and function of γ-secretases.EMBO J. 2024 Mar;43(6):887-903. doi: 10.1038/s44318-024-00057-w. Epub 2024 Feb 23. EMBO J. 2024. PMID: 38396302 Free PMC article. Review.
-
Brain inflammation co-localizes highly with tau in mild cognitive impairment due to early-onset Alzheimer's disease.Brain. 2025 Jan 7;148(1):119-132. doi: 10.1093/brain/awae234. Brain. 2025. PMID: 39013020 Free PMC article.
References
-
- Blautzik J, Brendel M, Sauerbeck J, Kotz S, Scheiwein F, Bartenstein P, Seibyl J, Rominger A, 2017. Reference region selection and the association between the rate of amyloid accumulation over time and the baseline amyloid burden. Eur. J. Nucl. Med. Mol. Imaging 44, 1364–1374. doi: 10.1007/s00259-017-3666-8. - DOI - PubMed
Publication types
MeSH terms
Substances
Grants and funding
LinkOut - more resources
Full Text Sources
Medical
Miscellaneous
