. 2022 Mar 31;12(4):466.
doi: 10.3390/brainsci12040466.

Features and Extra-Striate Body Area Representations of Diagnostic Body Parts in Anger and Fear Perception

Affiliations

Features and Extra-Striate Body Area Representations of Diagnostic Body Parts in Anger and Fear Perception

Jie Ren et al. Brain Sci. .

Abstract

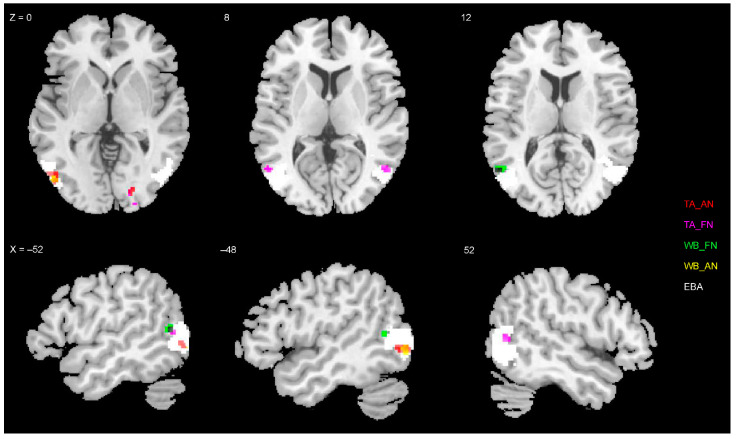
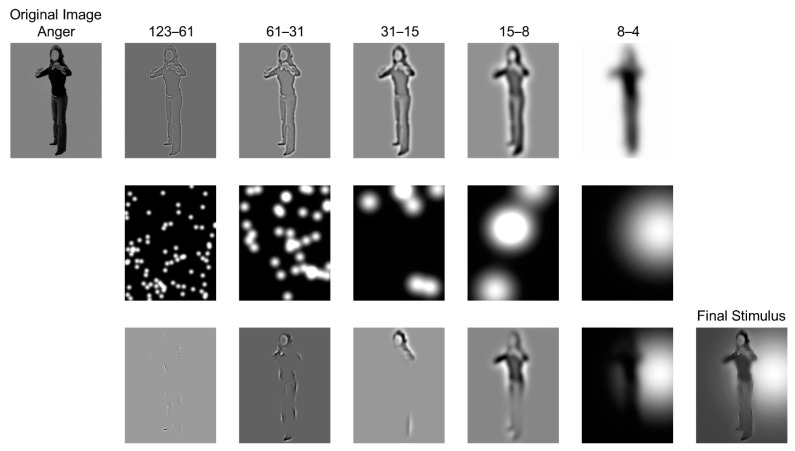
Social species perceive emotion via extracting diagnostic features of body movements. Although extensive studies have contributed to knowledge on how the entire body is used as context for decoding bodily expression, we know little about whether specific body parts (e.g., arms and legs) transmit enough information for body understanding. In this study, we performed behavioral experiments using the Bubbles paradigm on static body images to directly explore diagnostic body parts for categorizing angry, fearful and neutral expressions. Results showed that subjects recognized emotional bodies through diagnostic features from the torso with arms. We then conducted a follow-up functional magnetic resonance imaging (fMRI) experiment on body part images to examine whether diagnostic parts modulated body-related brain activity and corresponding neural representations. We found greater activations of the extra-striate body area (EBA) in response to both anger and fear than neutral for the torso and arms. Representational similarity analysis showed that neural patterns of the EBA distinguished different bodily expressions. Furthermore, the torso with arms and whole body had higher similarities in EBA representations relative to the legs and whole body, and to the head and whole body. Taken together, these results indicate that diagnostic body parts (i.e., torso with arms) can communicate bodily expression in a detectable manner.

Keywords: Bubbles paradigm; EBA; bodily perception; diagnostic body parts; fMRI.


Conflict of interest statement

The authors declare no conflict of interest.

Figures

Figure A1
Figure A1
Diagnostic information in one other female actor.
Figure A2
Figure A2
Diagnostic information in one other male actor.
Figure A3
Figure A3
Clusters of main effects and interaction of the group-level whole-brain ANOVA. (A) Clusters results for a main effect of body and (B) a main effect of expression. (C) Clusters results revealed by the interaction between body and expression. Abbreviations: EBA = extra-striate body area, aITG = anterior inferior temporal gyrus, PHG = parahippocampal gyrus, FG = fusiform gyrus, ACC = anterior cingulate cortex, INS = insular, MTG = middle temporal gyrus, IOL = left inferior occipital, LG = lingual gyrus, IFG = inferior frontal gyrus, STG = superior temporal gyrus, PCC = posterior cingulate cortex, MTG = middle temporal gyrus, SFG = superior frontal gyrus, MFG = middle frontal gyrus, SMA = supplementary motor area, SPL = superior parietal lobule, vmPFC = ventromedial prefrontal cortex, MSF = medial superior frontal cortex, IPL = inferior parietal lobule.
Figure A4
Figure A4
Clusters of contrast analysis. (A) Clusters shown by the contrast angry legs > neutral legs. (B) Clusters shown by the contrast fearful legs > neutral legs. (C) Clusters shown by the contrast fearful head > neutral head. Abbreviations: INS = insular, MTG = middle temporal gyrus, EBA = extra-striate body area, IFG = inferior frontal gyrus, MFG = middle frontal gyrus, SMA = supplementary motor area, IPL = inferior parietal lobule, SPL = superior parietal lobule.
Figure A5
Figure A5
Overlapping of the ROI and maps of emotional torso parts. Abbreviations: TA_AN = anger vs. neutral under torso with arms, TA_FN = fear vs. neutral under torso with arms, WB_AN = anger vs. neutral under whole body, WB_FN = fear vs. neutral under whole body.
Figure 1
Figure 1
Illustration of generating Bubbles stimulus. As shown in the first row, each original body stimulus was decomposed into 5 scales of five spatial frequency bandwidths (123 to 4 cpi). Then, in the second row, each bandwidth was independently and randomly placed Gaussian window bubbles. The third row shows the body information revealed by bubbles of each scale and the sum of information across scales. The final stimulus summed the 5 leftmost pictures on the row, and it was then applied in the formal experiment.
Figure 2
Figure 2
(a). Stimuli illustration of the 3 bodily expressions and 4 body parts. (b). fMRI task procedures.
Figure 3
Figure 3
Candidate models. Body-separate, body-pattern1, emotion-separate and emotion-pattern1 are categorical models of simulating the similarity of the BOLD activation patterns induced by the emotional categorization task, if the body or emotion factors independently dominate the underlying representations. Body-pattern2 assumes that the similarities of activation patterns induced by torso + arms, legs and head with that induced by whole body vary from high to low. Emotion-pattern2 combines emotion-pattern1 and body-pattern2, assuming that torso + arms and whole body share similar patterns for emotion categorization.
Figure 4
Figure 4
Diagnostic information revealed by the Bubbles experiment. The significant body information (red regions) for categorizing each bodily expression is displayed in a separate row. The first three rows show the three expressions by a female actor and the latter three rows those by a male actor. The first column shows the diagnostic SF features overlaying all the SF bands sampled in our experiment. The next five columns show the SF features of each band, respectively. The last bar graph is about the diagnostic SF spectrum for each expression (proportion of the diagnostic information per band). The numbers at the top show the range of each bandwidth (unit: cpi). The numbers at the top correspond with those below each bar graph.
Figure 5
Figure 5
Bar graph for results of the Bubbles experiment. Each bar represents the diagnostic pixel proportion (mean + s.e.m.) in the body parts of torso with arms, legs and head for classification as anger, fear and neutral. ** p < 0.005; *** p < 0.001.
Figure 6
Figure 6
Bar graph for behavioral results of fMRI experiment. Each bar represents the behavioral performance (Hu, see the main text; mean + s.e.m.) for classifying the WB, TA, legs and head into anger, fear and neutral, respectively. * p < 0.05; ** p < 0.01; *** p < 0.001.
Figure 7
Figure 7
Group analysis results for the contrast of ‘anger vs. neutral’ and ‘fear vs. neutral’ under whole body (WB, yellow clusters) and torso with arms (TA, red clusters) conditions. WB and TA were overlapped in orange clusters. The clusters were significantly located in occipitotemporal cortex around EBA.
Figure 8
Figure 8
Representation structures in EBA and FBA. (A) True RDMs, averaged across subjects for the four ROIs, show the neural dissimilarity (1 – r) between any two of the body parts. (B) MDS, calculated based on the RDM matrices, plotting the pairwise distance in a 2D space. The distances reflect the response-pattern similarity: the pairs which are located next to each other shared similar response patterns, while those far away from each other had dissimilar response patterns. (C) Dendrogram, grouping the body parts (nearest neighbor), aiming at revealing their categorical divisions.
Figure 9
Figure 9
Statistical test results. (A) Correlation (Kendall’s rank correlation coefficient τA) between the true RDMs and the candidate RDMs, respectively. The correlation coefficients were tested using a default one-sided signed-rank test. Significant results are marked by one ‘*’ below the bars. (B) The difference between any two candidate RDMs in their relatedness to the true RDMs. Each entry represents the significance of the difference tested by a two-sided signed-rank test. The colors of each entry represent different significant thresholds: q(FDR) = 0.05 (deep red) and q(FDR) = 0.01 (red); the nonsignificant entries are black. (C) Candidate models. BS: body-separate; BP: body-pattern; ES: emotion-separate; EP: emotion-pattern; r: random.

Similar articles

Cited by

References

    1. Aviezer H., Trope Y., Todorov A. Body cues, not facial expressions, discriminate between intense positive and negative emotions. Science. 2012;338:1225–1229. doi: 10.1126/science.1224313. - DOI - PubMed
    1. Aviezer H., Trope Y., Todorov A. Holistic person processing: Faces with bodies tell the whole story. J. Pers. Soc. Psychol. 2012;103:20. doi: 10.1037/a0027411. - DOI - PubMed
    1. Barrett L.F., Mesquita B., Gendron M. Context in Emotion Perception. Curr. Dir. Psychol. Sci. 2011;20:286–290. doi: 10.1177/0963721411422522. - DOI
    1. De Gelder B. Why bodies? Twelve reasons for including bodily expressions in affective neuroscience. Philos. Trans. R. Soc. B. 2009;364:3475–3484. doi: 10.1098/rstb.2009.0190. - DOI - PMC - PubMed
    1. Dael N., Mortillaro M., Scherer K.R. Emotion expression in body action and posture. Emotion. 2012;12:1085. doi: 10.1037/a0025737. - DOI - PubMed

LinkOut - more resources