. 2022 Apr 7;9(4):111.
doi: 10.3390/jcdd9040111.

Inhibition of the NOTCH1 Pathway in the Stressed Heart Limits Fibrosis and Promotes Recruitment of Non-Myocyte Cells into the Cardiomyocyte Fate

Affiliations

Inhibition of the NOTCH1 Pathway in the Stressed Heart Limits Fibrosis and Promotes Recruitment of Non-Myocyte Cells into the Cardiomyocyte Fate

Mohamed Nemir et al. J Cardiovasc Dev Dis. .

Abstract

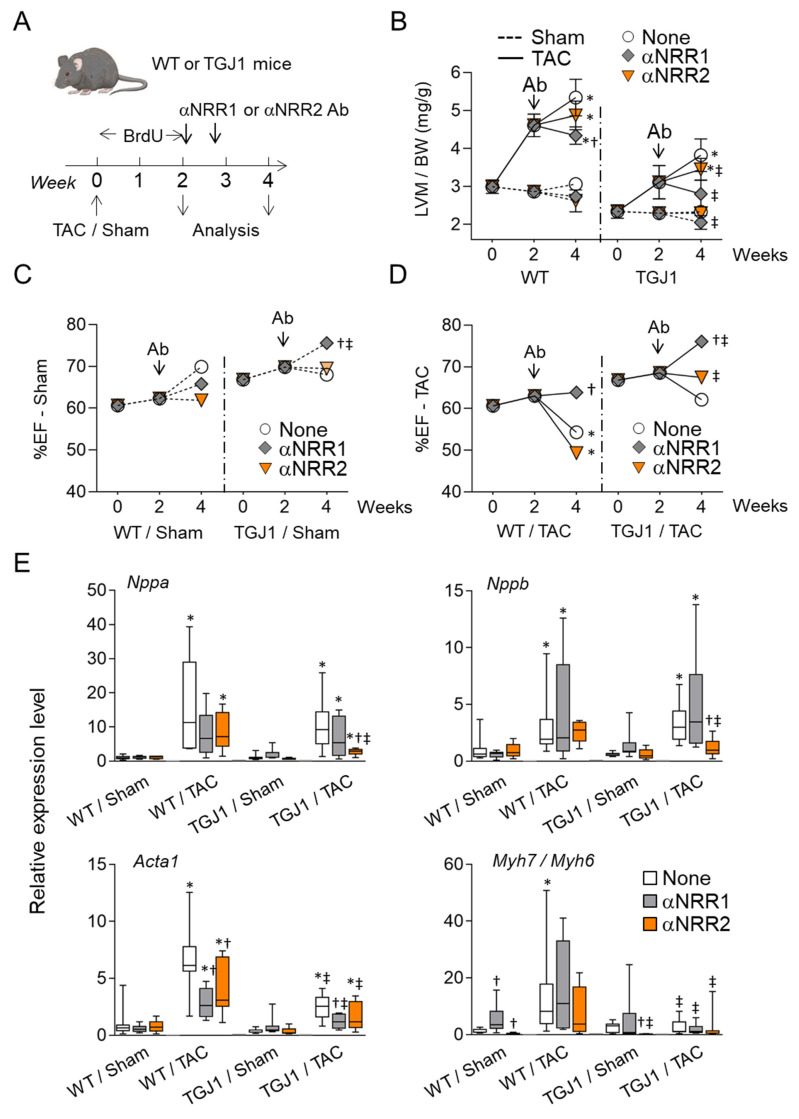
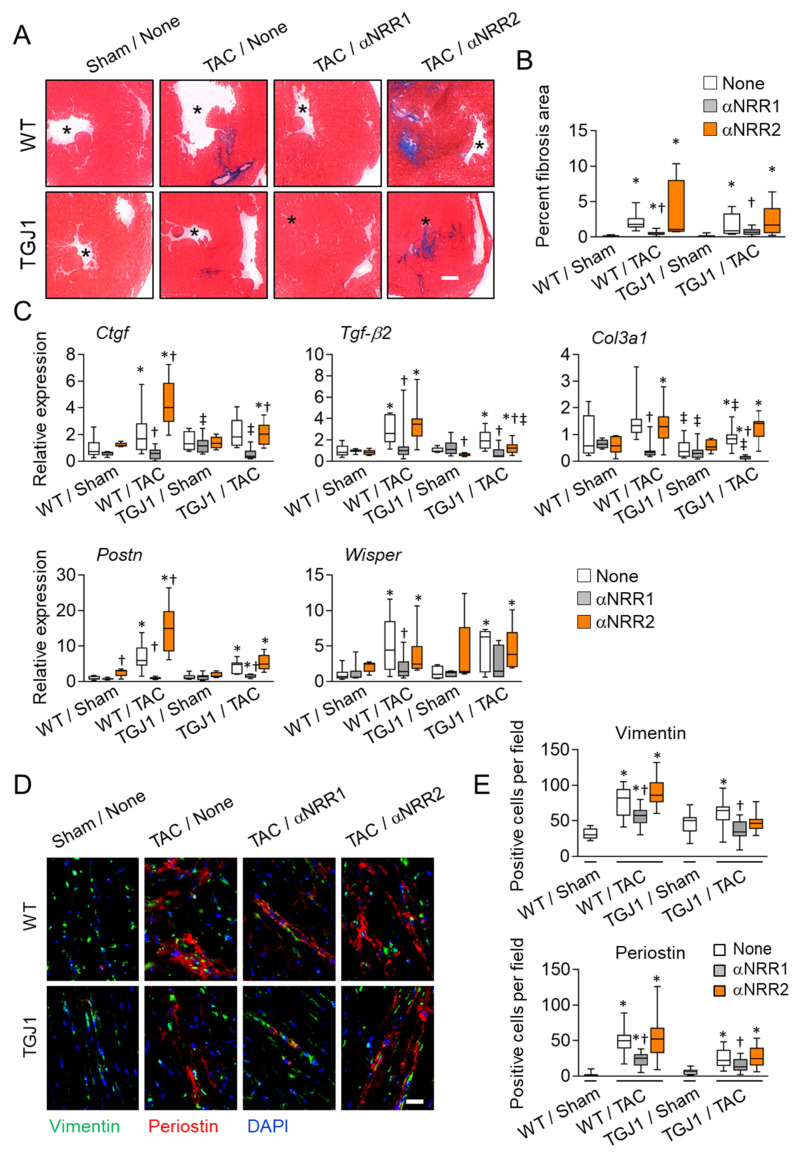
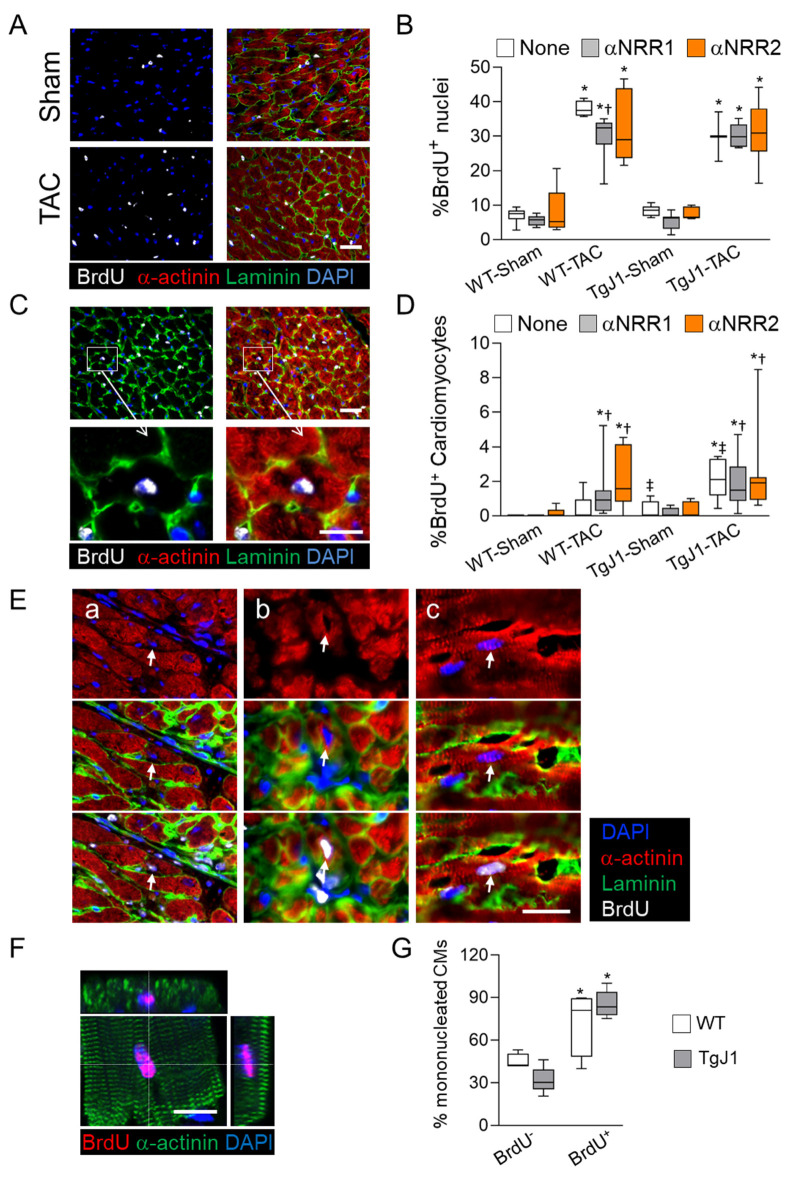
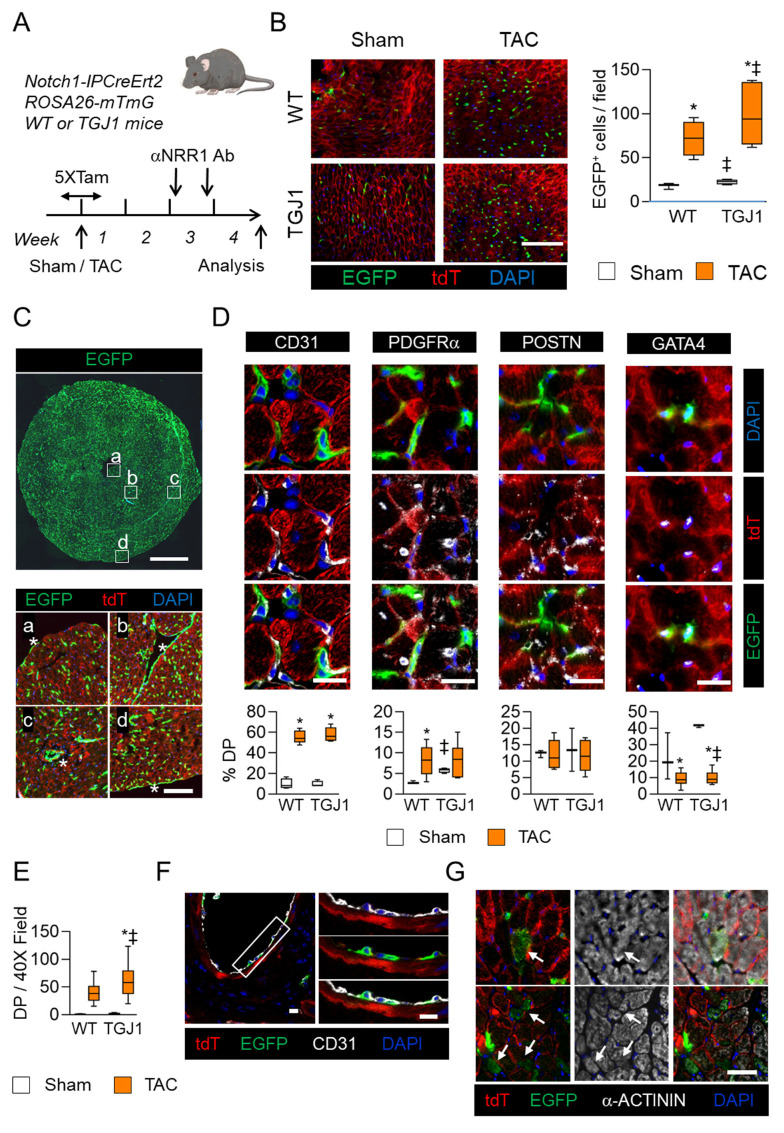
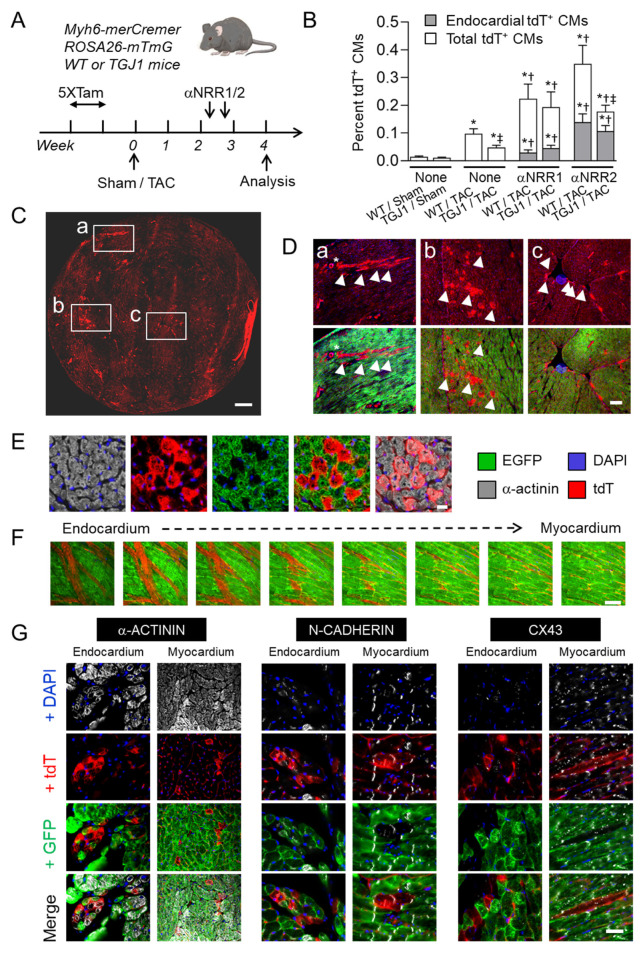
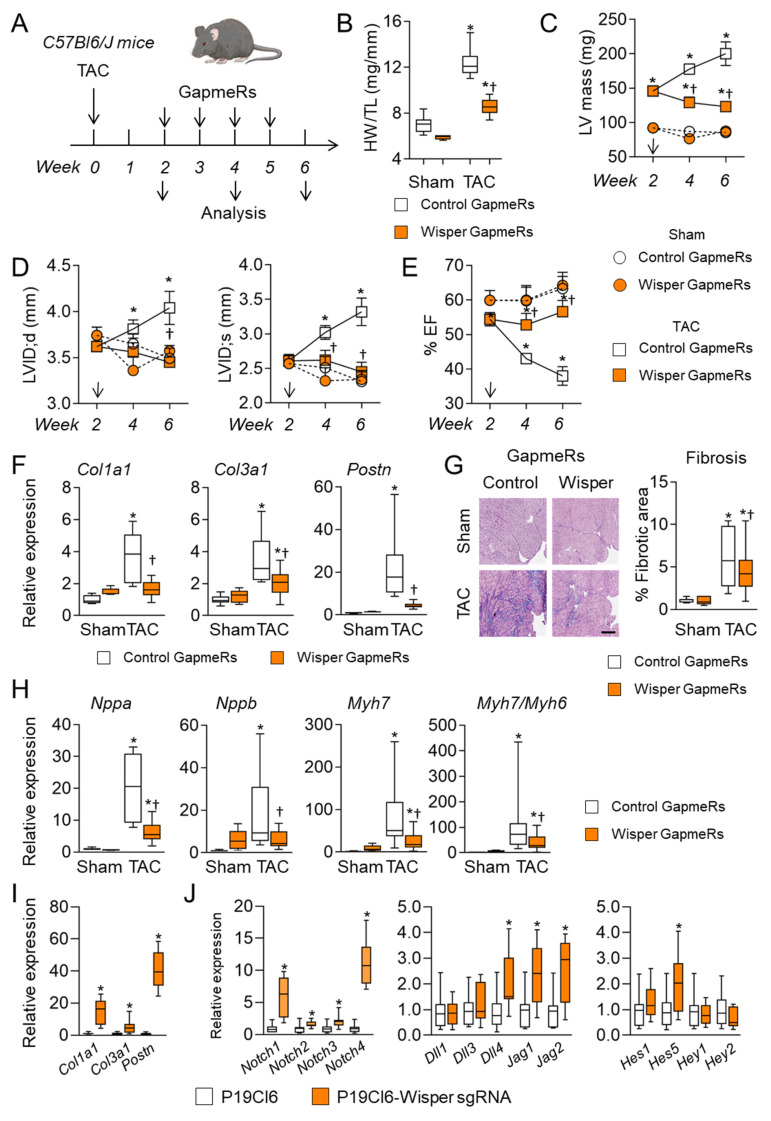
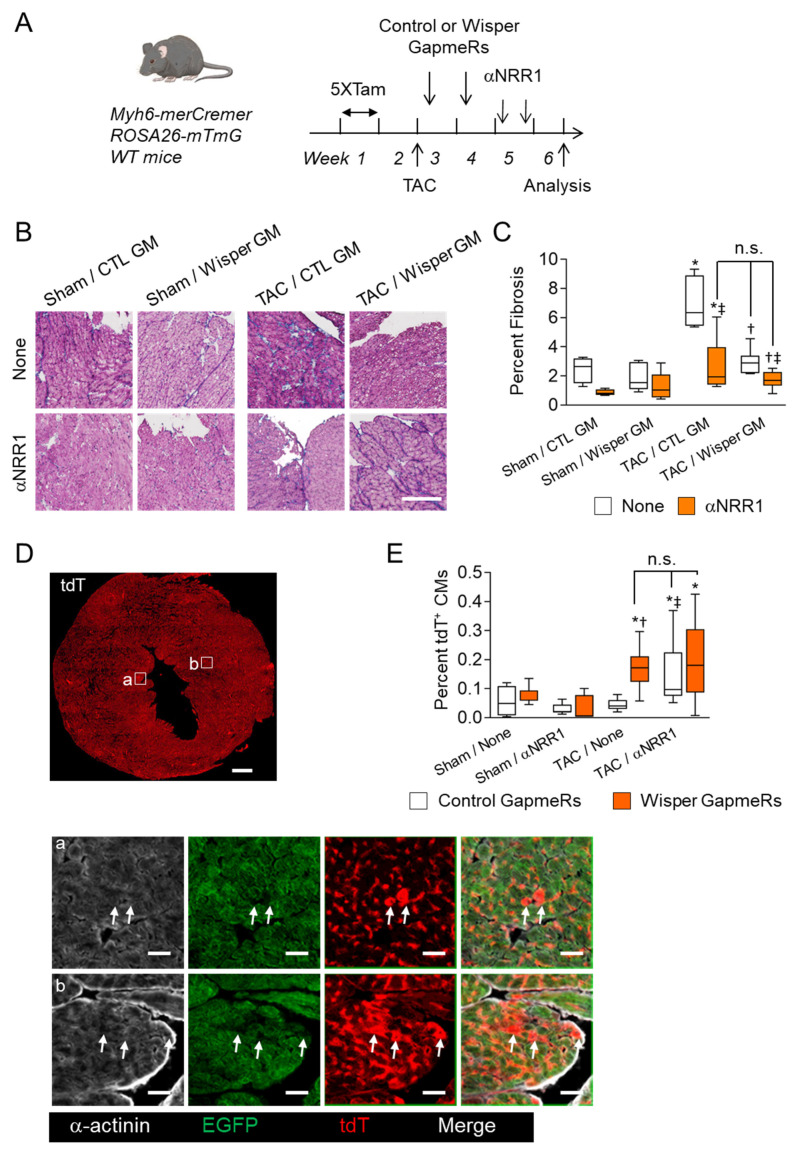
Cardiac pathologies lead to an acute or gradual loss of cardiomyocytes. Because of the limited regenerative capacity of the mammalian heart, cardiomyocytes are only replaced by fibrotic tissue. Excessive fibrosis contributes to the deterioration of cardiac function and the transition to heart failure, which is the leading cause of morbidity and mortality worldwide. Currently, no treatments can promote replenishment of the injured heart with newly formed cardiomyocytes. In this context, regenerative strategies explore the possibility to promote recovery through induction of cardiomyocyte production from pre-existing cardiomyocytes. On the other hand, cardiac non-myocyte cells can be directly reprogrammed into induced cardiac precursor cells and cardiomyocytes, suggesting that these cells could be exploited to produce cardiomyocytes in vivo. Here, we provide evidence that the sequential activation and inhibition of the NOTCH1 signaling pathway in the stressed heart decreases fibrosis and improves cardiac function in the stressed heart. This is accompanied by the emergence of new cardiomyocytes from non-myocyte origin. Overall, our data show how a developmental pathway such as the NOTCH pathway can be manipulated to provide therapeutic benefit in the damaged heart.

Keywords: NOTCH; cardiomyocyte production; fibrosis; heart; remodeling.


Conflict of interest statement

TP is a co-founder of Haya Therapeutics, Lausanne, Switzerland. The other authors declare no conflict of interest. The funders had no role in the design of the study; in the collection, analyses, or interpretation of data; in the writing of the manuscript, or in the decision to publish the results.

Figures

Figure 1
Figure 1
NOTCH1 blocking antibody treatment attenuates cardiac hypertrophy. (A) Experimental protocol. TGJ1 mice and WT controls were subjected to Sham or transaortic constriction for two weeks, then treated twice with αNRR1 or αNRR2 antibodies (Ab) at 4 days interval. Untreated mice (none) were also included. BrdU was administered during the first two weeks to label proliferating cells. Hearts were harvested 4 weeks after TAC and analyzed. (B) Left ventricle mass-to-body weight ratio in mg/g measured at baseline and week 2 and 4 post surgery. (C,D) Progression of percent ejection fraction (%EF) from baseline to week 4, in Sham (C) or TAC (D) operated mice. (E) RT-PCR analysis of expression of cardiac stress marker genes Acta1, Nppa, Nppb and Myh7/Myh6 ratio. The graphs represent expression values relative to untreated, Sham-operated group; n = 5–10 animals/group (see Supplementary Table S2). *, p < 0.05 in TAC vs. Sham; †, p < 0.05 in αNRR vs. None; ‡, p < 0.05 in TGJ1 vs. WT.
Figure 2
Figure 2
NOTCH1 and NOTCH2 antibody blockade exerts different effects on cardiac fibrosis. (A) Mice were operated as in Figure 1, and transverse heart tissue sections were subjected to histological Masson Trichrome staining to reveal collagen deposition (blue). Asterisks indicate the left ventricle cavity. (B) Interstitial fibrosis was measured on heart tissue sections stained as in (A) and expressed as percent of total heart section area. (C) RT-PCR analysis of expression of fibrosis marker genes Ctgf, Tgf-β2, Col3a1, Postn and Wisper in control WT and TGJ1 mice subjected to sham or TAC operation with αNRR1 or αNRR2 antibody or without antibody treatment (None). Expression levels are relative to untreated, Sham-operated group. (D,E) Immunofluorescence staining of heart tissue sections using anti-vimentin (green) and anti-periostin (red) antibodies. n = 5–10 animals/group (see Supplementary Table S2). *, p < 0.05 in TAC vs. Sham; †, p < 0.05 in αNRR vs. None; ‡, p < 0.05 in TGJ1 vs. WT. Scale bar in B = 200 μm, in (D) = 20 μm.
Figure 3
Figure 3
Aortic constriction increased BrdU incorporation in the myocardium. Mice were subjected to Sham or TAC operation as in Figure 1A and heart tissue sections were subjected to immunostaining to reveal BrdU incorporation. (A) Micrographs showing tissue sections stained with antibodies against BrdU (Gray), α-actinin (red), Laminin (green) and DAPI (blue). (B) Quantitative analysis of total BrdU incorporation expressed as percentage of BrdU+ nuclei. (C) Examples of BrdU+ CMs in the myocardium, identified by virtue of BrdU+ nuclei within sarcomeric α-actinin+ cytoplasm delimited by a laminin+ signal to mark CM boundaries. The insets show the BrdU+ CMs at high magnifications. (D) Quantification of BrdU+ CMs. The results are expressed as percent BrdU+ CMs relative to total CMs with visible nuclei. (E) Examples of small BrdU+ CMs. The micrographs show small α-actinin+ and BrdU+ CMs (arrows) with faint laminin extracellular matrix organization in sub-endocardial regions (a), in proximity of blood vessels (b), and in the myocardium (c). (F,G) Single CMs isolated from WT and TGJ1 mouse hearts subjected to TAC and αNRR1 treatment were immunostained using antibodies against BrdU (red) and α-actinin (green) and DAPI. (F) Confocal image of a BrdU+ CM isolated from adult heart with orthogonal views showing BrdU+ nucleus within α-actinin-stained sarcomeres (G) The percentage of mono-nucleated BrdU+ (pos.) and BrdU− (neg.) CMs were determined on CMs stained as in (E). (B,D) n = 5–10 mice/group (see Supplementary Table S2); for (F), WT, n = 4; TGJ1, n = 5. *, p < 0.05 in TAC vs. Sham; †, p < 0.05 in αNRR vs. None; ‡, p < 0.05 in TGJ1 vs. WT. Scale bars = 20 μm.
Figure 4
Figure 4
Fate of NOTCH1-activated cells in the stressed heart. (A) Experimental protocol. Wild type and TGJ1 mice harboring Notch1-IPCreErt2 and ROSA26-mTmG alleles were subjected to TAC or Sham operation. Mice were injected with Tamoxifen to induce tdT to EGFP conversion in cells experiencing NOTCH1 signaling in the 2 days before, the 2 days after and on the day of surgery. After 2 weeks, they were injected with αNRR1 antibody. Analysis was performed 4 weeks after operation. (B) Photomicrograph of heart tissue sections showing NOTCH1-traced EGFP+ cells in the myocardium of Sham and TAC-operated αNRR1-treated WT and TGJ1 mice. The graph on the right shows the number of EGFP+ cells per 40X microscope field. (C) Whole heart tissue section showing NOTCH1-traced cells. The insets marked (ad) show NOTCH1-traced cells in the endocardium of the left and right ventricles (a,b), in a small blood vessel (c) and in the epicardium (d), which are indicated by asterisks. (D) Characterization of NOTCH1-traced EGFP+ cells. Tissue sections were stained with anti-EGFP (green) and with either anti-CD31, anti-PDGFRα, anti-PERIOSTIN or anti-GATA4 antibodies (Gray); non-traced cells express tdT (red). The graphs represent the percentage of double positive (% DP) EGFP+ cells expressing the indicated markers in WT and TGJ1 mice subjected to Sham or TAC surgery and αNRR1 treatment. (E) Number of CD31+-EGFP+ double-positive (DP) cells per 40X field in WT and TGJ1 mice subjected to Sham or TAC operation. (F) NOTCH1 traced cells in the endothelium of a large blood vessel. Heart tissue sections were stained for CD31 (Gray) and EGFP to reveal NOTCH1-traced cells. The insets show the area demarcated by the rectangle at high magnification. (G) Fluorescence micrographs showing NOTCH1-traced EGFP+ CMs (arrows), identified as single CMs or clusters of several CMs. The EGFP+ CMs (Green) also express α-actinin (Gray), as do the adjacent tdT+ CMs (Red). In (B,D,E,F), WT-Sham, n = 3; TGJ1-Sham, n = 4; WT-TAC, n = 6; TGJ1-TAC, n = 5. *, p < 0.05 in TAC vs. Sham; ‡, p < 0.05 in TGJ1 vs. WT. Scale bar in (B) = 200 μm; in (C) = 1 mm; in insets (ad) = 100 μm; in (D,G) = 50 μm.
Figure 5
Figure 5
New myocytes originate from non-myocyte cells. (A) Experimental protocol. TGJ1 and WT control mice bearing Myh6- MerCreMer and ROSA26-mTmG transgenes were injected with Tamoxifen during 5 consecutive days to induce a conversion from tdT to EGFP expression specifically in CMs. The mice were subjected to Sham or TAC operation. After two weeks, the mice were injected twice with αNRR1 or αNRR2 antibody at four days interval. Mice were sacrificed and analyzed after 4 weeks of TAC. (B) Quantification of new tdT+ CMs in WT and TGJ1 mice subjected to Sham or TAC operation and treated with αNRR1, αNRR2 antibodies or none. The data show percentage of tdT+ CMs per heart section. The proportions of tdT+ CMs in the endocardium region are shown in Gray. *, p < 0.05 in TAC vs. Sham; †, p < 0.05 in αNRR vs. None; ‡, p < 0.05 in TGJ1 vs. WT (n = 4–8 mice per group). (C) Representative whole heart tissue section showing the three main locations of tdT+ CMs (Red). The rectangles denote: (a) a perivascular region, (b), a ventricular myocardium region and (c) a endocardial region. The tdT+ CMs (arrowheads) in the three different localizations are shown at higher magnification in (D). (E) Cluster of tdT+ (Red) α-actinin+ (Gray) CMs and adjacent pre-existing EGFP+ (Green) CMs (F). Wholemount confocal serial sections in the endocardium to myocardium axis showing tdT+ CMs (Red) as a one-cell deep layer. (G) Characterization of the tdT+ CMs. Heart tissue sections were stained (Gray) with antibodies against α-actinin, to mark CM cytoplasm, N-Cadherin to mark intercalated disks, and against Connexin-43 to label gap junctions. Representative areas with new tdT+ CMs (Red) are shown, in the myocardium and in the subendocardium, adjacent to pre-existing CMs (Green). Scale bars in (C) = 0.5 mm, in (D) = 200 μm (right) and in (EG) = 50 μm.
Figure 6
Figure 6
Wisper lncRNA knockdown attenuates adverse cardiac remodeling. (A) Experimental protocol. Mice were subjected to transaortic constriction and 2 weeks post-surgery, they received Wisper or Control GapmeRs once a week, for 4 weeks. Hearts were harvested 6 weeks after TAC. (B) Cardiac hypertrophy expressed as heart weight-to-tibia length ratio (mg/mm) measured at sacrifice. (C) Left ventricle (LV) hypertrophy (LV mass, in mg) measured by echocardiography at 2, 4 and 6 weeks post-TAC. (D) Remodeling of LV dimensions (in mm) in diastole and systole (LVID; d and -; s). (E) Functional remodeling expressed as percent ejection fraction (%EF) measured by echocardiography at 2, 4 and 6 weeks. (F,G) Wisper knockdown attenuates TAC-induced cardiac fibrosis. (F) Quantitative RT-PCR analysis of cardiac fibrosis markers Col1a1, Col3a1 and Postn. (G) Masson Trichrome staining of heart tissue sections showing interstitial fibrosis (blue) and quantification of fibrosis areas expressed as a percentage of areas of whole heart tissue sections. (H) RT-PCR analysis of cardiac stress markers Nppa, Nppb, Myh7 and Myh7/Myh6 ratio. In (F,H), expression level is relative to Sham-operated, Control GapmeR-treated group. *, p < 0.05 in TAC vs. Sham; †, p < 0.05 in Wisper GapmeR vs. Control GapmeR. (Sham Control-GapmeR, n = 6; Sham Wisper-GapmeR, n = 5; TAC-Control-GapmeR-4w; n = 6; TAC-Wisper-GapmeR-4w, n = 7; TAC- Control-GapmeR-6w, n = 9; TAC-Wisper-GapmeR-6w, n = 10). (I,J) Activation of Wisper expression induces fibrosis and Notch pathway genes. The P19Cl6 embryonal carcinoma cell line was transfected with a plasmid encoding dCAs9-vp16-MS2-p65-Hsf1 and a plasmid expressing guide RNA targeting Wisper promoter region to force Wisper expression. Activation of Wisper expression induces fibrosis marker genes (I) and Notch pathway genes (J), as evaluated by quantitative RT-PCR analysis. Mean ± SEM *, p < 0.05 in P19Cl6-Wisper sgRNA vs. P19Cl6 (n = 3).
Figure 7
Figure 7
Concerted expression and action of Wisper and NOTCH1 signaling on cardiac fibrosis and new myocyte formation. (A) Experimental protocol. Tamoxifen-treated (5 consecutive days) Myh6-MerCreMer;ROSA26-mTmG reporter mice were subjected to transaortic constriction or Sham operation and 2 and 9 days post-surgery, they received Wisper-GapmeR or Control (Cont.)-GapmeR. Two weeks after TAC, they were treated twice with αNRR1 antibody at 4 days interval or left untreated (None). The hearts were harvested 4 weeks after TAC and analyzed. (B) Masson Trichrome of heart tissue sections showing collagen deposition (blue). (C) Quantitative analysis of cardiac fibrosis expressed as percent of whole-heart sectional area. (D,E) Wisper knockdown stimulates formation of new CMs. (D) Fluorescence photomicrograph of a whole heart section showing tdT+ CMs in the endocardium and myocardium regions. The areas within squares are displayed at higher magnifications demonstrating the presence of α-actinin+ (gray), tdT+ CMs (red) in the endocardium (a) and myocardium (b) in contact with pre-existing EGFP+ CMs (green). (E) Quantification of new tdT+ CM formation expressed as percent of total number of CMs per whole heart tissue section. The graphs in (E) show mean ± SEM. *, p < 0.05 in TAC vs. Sham; †, p < 0.05 in Wisper-GapmeR vs. Control-GapmeR; ‡, p < 0.05 in αNRR1 vs. None and n.s., not significant (Sham Control-GapmeR αNRR1, n = 3; Sham Wisper-GapmeR αNRR1, n = 3; TAC Control-GapmeR αNRR1, n = 5; TAC Control-GapmeR None, n = 3; TAC-Control-GapmeR αNRR1, n = 6; TAC Wisper-GapmeR None, n = 6; TAC Wisper-GapmeR αNRR1, n = 7). Scale bars in (B) = 100 μm; in (D) = 1 mm, insets = 50 μm.

Similar articles

Cited by

References

    1. Ali S.R., Ranjbarvaziri S., Talkhabi M., Zhao P., Subat A., Hojjat A., Kamran P., Muller A.M., Volz K.S., Tang Z., et al. Developmental heterogeneity of cardiac fibroblasts does not predict pathological proliferation and activation. Circ. Res. 2014;115:625–635. doi: 10.1161/CIRCRESAHA.115.303794. - DOI - PubMed
    1. Bergmann O., Bhardwaj R.D., Bernard S., Zdunek S., Barnabe-Heider F., Walsh S., Zupicich J., Alkass K., Buchholz B.A., Druid H., et al. Evidence for cardiomyocyte renewal in humans. Science. 2009;324:98–102. doi: 10.1126/science.1164680. - DOI - PMC - PubMed
    1. Senyo S.E., Steinhauser M.L., Pizzimenti C.L., Yang V.K., Cai L., Wang M., Wu T.D., Guerquin-Kern J.L., Lechene C.P., Lee R.T. Mammalian heart renewal by pre-existing cardiomyocytes. Nature. 2013;493:433–436. doi: 10.1038/nature11682. - DOI - PMC - PubMed
    1. Kamo T., Akazawa H., Komuro I. Cardiac nonmyocytes in the hub of cardiac hypertrophy. Circ. Res. 2015;117:89–98. doi: 10.1161/CIRCRESAHA.117.305349. - DOI - PubMed
    1. Senyo S.E., Lee R.T., Kuhn B. Cardiac regeneration based on mechanisms of cardiomyocyte proliferation and differentiation. Stem Cell Res. 2014;13:532–541. doi: 10.1016/j.scr.2014.09.003. - DOI - PMC - PubMed

LinkOut - more resources