. 2022 Mar 31;12(4):208.
doi: 10.3390/bios12040208.

Visualising the Emerging Platform of Using Microalgae as a Sustainable Bio-Factory for Healthy Lipid Production through Biocompatible AIE Probes

Affiliations

Visualising the Emerging Platform of Using Microalgae as a Sustainable Bio-Factory for Healthy Lipid Production through Biocompatible AIE Probes

Ahm Mohsinul Reza et al. Biosensors (Basel). .

Abstract

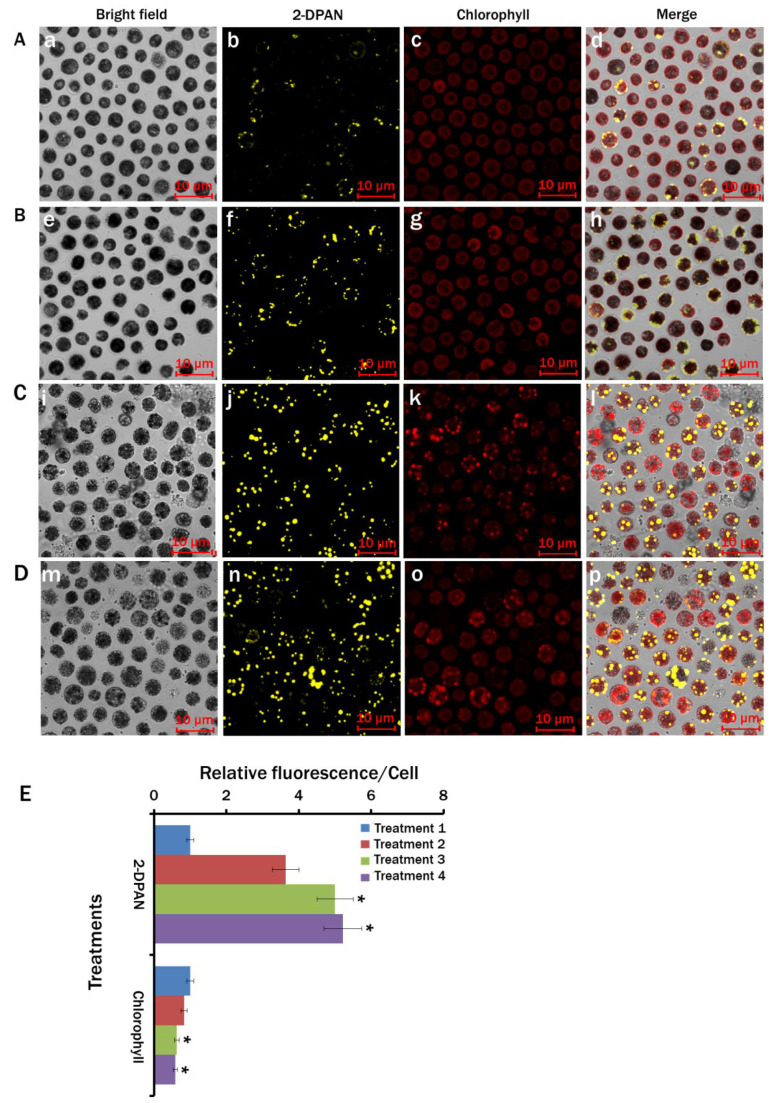
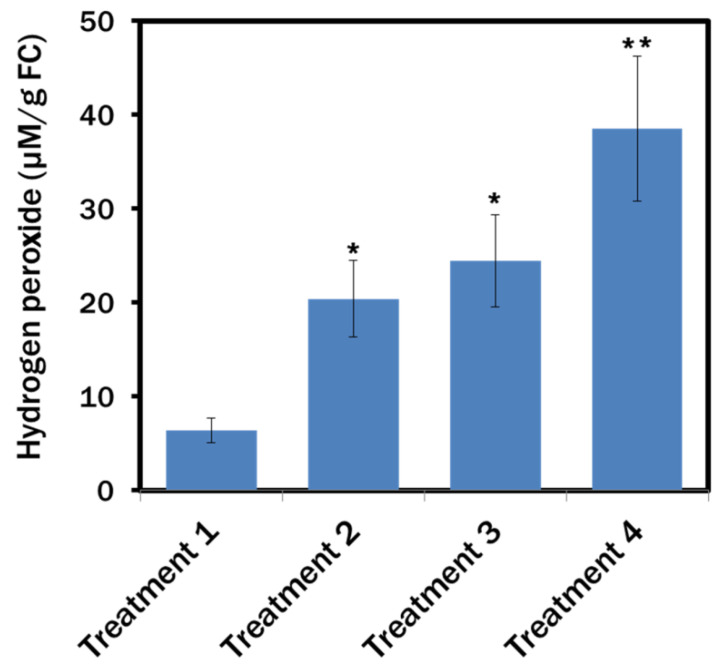
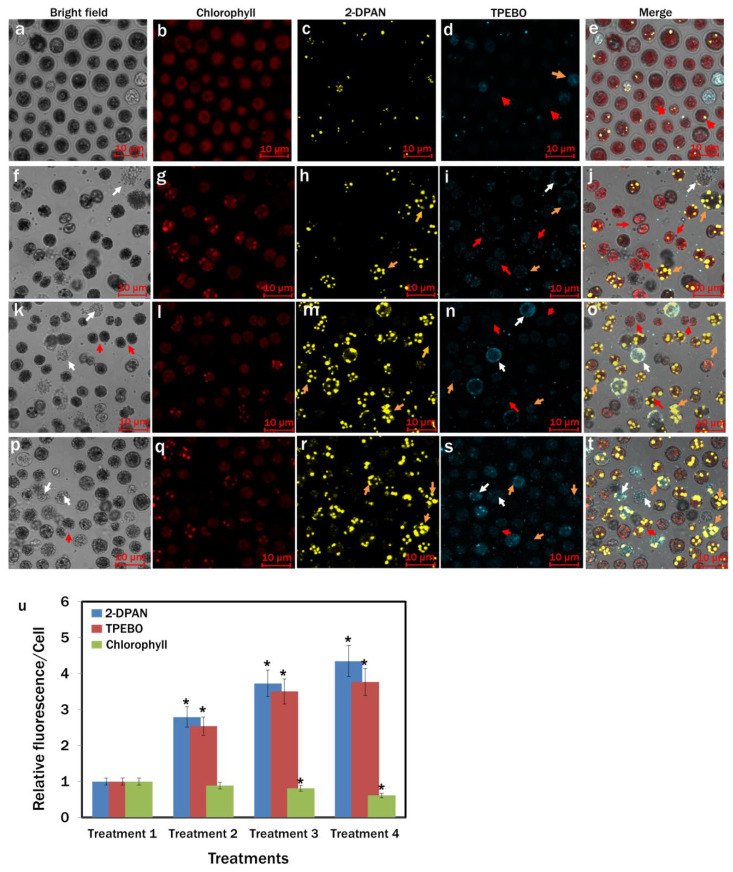
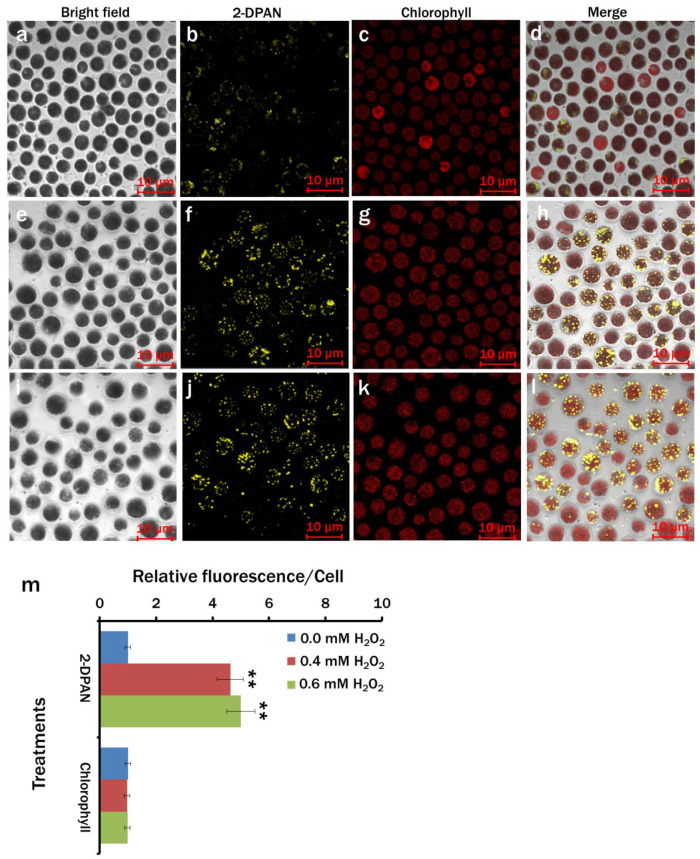
Nowadays, a particular focus is using microalgae to get high-valued health beneficiary lipids. The precise localisation of the lipid droplets (LDs) and biochemical changes are crucial to portray the lipid production strategy in algae, but it requires an in vivo tool to rapidly visualise LD distribution. As a novel strategy, this study focuses on detecting lipid bioaccumulation in a green microalga, Chlamydomonas reinhardtii using the aggregation-induced emission (AIE) based probe, 2-DPAN (C24H18N2O). As the messenger molecule and stress biomarker, hydrogen peroxide (H2O2) activity was detected in lipid synthesis with the AIE probe, TPE-BO (C38H42B2O4). Distinctive LDs labelled with 2-DPAN have elucidated the lipid inducing conditions, where more health beneficiary α-linolenic acid has been produced. TPE-BO labelled H2O2 have clarified the involvement of H2O2 during lipid biogenesis. The co-staining procedure with traditional green BODIPY dye and red chlorophyll indicates that 2-DPAN is suitable for multicolour LD imaging. Compared with BODIPY, 2-DPAN was an efficient sample preparation technique without the washing procedure. Thus, 2-DPAN could improve traditional fluorescent probes currently used for lipid imaging. In addition, the rapid, wash-free, multicolour AIE-based in vivo probe in the study of LDs with 2-DPAN could advance the research of lipid production in microalgae.

Keywords: aggregation-induced emission; green microalgae; health beneficiaries; healthy lipid; visualisation.


Conflict of interest statement

The authors declare no conflict of interest.

Figures

Figure 1
Figure 1
Effects of nutrient and light manipulation on the growth of Chlamydomonas reinhardtii at different time intervals. Treatment 1: MBL medium; Treatment 2: MBL, (−) N2; Treatment 3: MBL, (−) N2, (−) Ca2+; Treatment 4: MBL, (−) N2, (−) Ca2 +, (+) Sodium acetate (2.0 g/L) (24 h light) and Treatment 5: MBL, (−) N2, (−) Ca2+, (+) Sodium acetate (2.0 g/L) (24 h dark) conditions.
Figure 2
Figure 2
Fluorescence properties of 2-DPAN. Absorption spectra (a) and fluorescence spectra (b,c) of 2-DPAN (10 µM) in 90% water fraction and DMSO-water mixtures, respectively.
Figure 3
Figure 3
Confocal images of lipid drops in Chlamydomonas reinhardtii cells of Treatment 4 (MBL medium, (−) N2, (+) Sodium Acetate (2.0 g/L), (−) Ca2+, (24 h light condition)). Cells were labelled with traditional BODIPY™ 505/515 (5 μM; incubation-5 min) (c) and AIE probe, 2-DPAN (20 μM; incubation-30 min) (d). (Bright-field images: (a); Fluorescence images—Chlorophyll: (b) (λex: 488 nm, λem: 685–758 nm); BODIPY: (c) (λex: 488 nm, λem: 490–517 nm); 2-DPAN: (d) (λex: 488 nm, λem: 570–650 nm); Merged image: (ei) and (j) are the enlarged regions of a–d respectively); (k) intensity profile of BODIPY and 2-DPAN in green and yellow channels, respectively; (l) intensity scatter plot for the colocalised channels; Pearson correlation coefficient and Mander’s overlap coefficient were calculated as 0.91 and 0.92, respectively; (m) Relative fluorescence intensity/cell for lipid-specific probes. Values are relative to the control BODIPY dye. Averages shown as mean ±SE; * p < 0.05. Images were taken with Zeiss LSM 880 Airyscan confocal microscope.
Figure 4
Figure 4
Flow cytometry measurements for lipid in Chlamydomonas reinhardtii cells in different treatments labelled with BODIPY™ 505/515 and AIE probe, 2-DPAN. (ae) Flow cytogram of FITC-A vs. SSC-A for BODIPY fluorescence in different treatments; (gk) Flow cytogram of KO525-A vs. SSC-A for 2-DPAN fluorescence. Cells were cultured in Treatment 1: modified Woods Hole (MBL) medium; Treatment 2: MBL, (−) N2; Treatment 3: MBL, (−) N2, (−) Ca2+; Treatment 4: MBL, (−) N2, (−) Ca2+, (+) sodium acetate (2.0 g/L) (24 h light); and Treatment 5: MCM, (−) N2, (−) Ca2+, (+) sodium acetate (2.0 g/L) (24 h Dark) conditions. Histogram of BODIPY™ 505/515 (f) and 2-DPAN (l) fluorescence for cells. (m) Relative fluorescence of BODIPY™ 505/515 and 2-DPAN / cell for different treatments. Values are relative to the control condition of Treatment 1. Averages shown as mean ± SE; * p < 0.05; ** p < 0.01. All plots are in the logarithmic scale for both axes.
Figure 5
Figure 5
Labelling lipid drops with lipid-specific AIE nanoprobe, 2-DPAN (20 μM; incubation-30 min) in Chlamydomonas reinhardtii. Cells were cultured in (A) Treatment 1: modified Woods Hole (MBL) medium; (B) Treatment 2: MBL, (−) N2; (C) Treatment 3: MBL, (−) N2, (−) Ca2+; (D) Treatment 4: MBL, (−) N2, (−) Ca2+, (+) sodium acetate (2.0 g/L) (all the treatments were in 24 h light condition). Bright-field images: Aa,Be,Ci,Dm Fluorescence images-2-DPAN: Ab,Bf,Cj,Dn (λex: 488 nm, λem: 570–650 nm),and Chlorophyll: Ac,Bg,Ck,Do (λex: 488 nm, λem: 685–758 nm); Merged images: Ad,Bn,Cr,Dp. (E) Relative fluorescence intensity/cell for different treatments. Values are relative to the control condition (Treatment 1: modified Cramer–Myers medium (MCM)). Averages shown as mean ±SE; * p < 0.05; Images were taken with Zeiss LSM 880 Airyscan confocal microscope.
Figure 6
Figure 6
Hydrogen peroxide content in the Chlamydomonas reinhardtii cells of different treatments. Treatment 1: modified Woods Hole (MBL) medium; Treatment 2: MBL, (−) N2; Treatment 3: MBL, (−) N2, (−) Ca2+; Treatment 4: MBL, (−) N2, (−) Ca2 +, (+) sodium acetate (2.0 g/L) (all the treatments were in 24 h light condition). Data represented as mean ± SE, n = 3, * p < 0.05; ** p < 0.01.
Figure 7
Figure 7
Confocal images of H2O2 activities in Chlamydomonas reinhardtii cells during lipid induction. H2O2 and lipid drops were labelled with AIE-probes, TPE-BO (100 μM; incubation-15 min) and 2-DPAN (20 μM; incubation-30 min), respectively. (ae) Treatment 1: modified Woods Hole (MBL) medium; (fj) Treatment 2: MBL, (−) N2; (ko) Treatment 3: MBL, (−) N2, (−) Ca2+; (pt) Treatment 4: MBL, (−) N2, (−) Ca2 +, (+) sodium acetate (2.0 g/L) (all the treatments were in 24 hr light condition). Bright-field images: a, f, k and p; Fluorescence images—Chlorophyll: b, g I and q (λex: 488 nm, λem: 685−758 nm); 2-DPAN: (c,h,m,r) (λex: 488 nm, λem: 570–650 nm); TPE-BO: (d,i,n,s) (λex: 405 nm, λem: 428–499 nm); Merged image: (e,j,o,) and (t,u) Relative fluorescence intensity/cell for different treatments. The red arrow indicates H2O2 activity in normal cells and during cell division; the orange arrow indicates H2O2 activity in lipid accumulated cells; The white arrow indicates H2O2 activity in autophagic cells. Averages are shown as mean ±SE; * p < 0.05; Images were taken with Zeiss LSM 880 Airyscan confocal microscope.
Figure 8
Figure 8
Imaging of lipid drops in H2O2 treated Chlamydomonas reinhardtii. Lipids were labelled with lipid-specific AIE nanoprobe, 2-DPAN (20 μM; incubation-30 min). Cells were cultured in 0.0 mM (ad), 0.4 mM (eh) and 0.6 mM (il) H2O2 supplemented MBL medium. Bright-field images: (a,e,i); Fluorescence images—2-DPAN: (b,f,j) (λex: 488 nm, λem: 570–650 nm) and Chlorophyll: (c,g,k) (λex: 488 nm, λem: 685–758 nm); Merged images: (d,h,l). (m) Relative fluorescence intensity/cell for different treatments. Values are relative to the control condition (0.0 mM H2O2). Averages shown as mean ± SE; ** p < 0.01; Images were taken with Zeiss LSM 880 Airyscan confocal microscope.

Similar articles

Cited by

  • Aggregation-Induced Emission (AIE), Life and Health.
    Wang H, Li Q, Alam P, Bai H, Bhalla V, Bryce MR, Cao M, Chen C, Chen S, Chen X, Chen Y, Chen Z, Dang D, Ding D, Ding S, Duo Y, Gao M, He W, He X, Hong X, Hong Y, Hu JJ, Hu R, Huang X, James TD, Jiang X, Konishi GI, Kwok RTK, Lam JWY, Li C, Li H, Li K, Li N, Li WJ, Li Y, Liang XJ, Liang Y, Liu B, Liu G, Liu X, Lou X, Lou XY, Luo L, McGonigal PR, Mao ZW, Niu G, Owyong TC, Pucci A, Qian J, Qin A, Qiu Z, Rogach AL, Situ B, Tanaka K, Tang Y, Wang B, Wang D, Wang J, Wang W, Wang WX, Wang WJ, Wang X, Wang YF, Wu S, Wu Y, Xiong Y, Xu R, Yan C, Yan S, Yang HB, Yang LL, Yang M, Yang YW, Yoon J, Zang SQ, Zhang J, Zhang P, Zhang T, Zhang X, Zhang X, Zhao N, Zhao Z, Zheng J, Zheng L, Zheng Z, Zhu MQ, Zhu WH, Zou H, Tang BZ. Wang H, et al. ACS Nano. 2023 Aug 8;17(15):14347-14405. doi: 10.1021/acsnano.3c03925. Epub 2023 Jul 24. ACS Nano. 2023. PMID: 37486125 Free PMC article. Review.
  • The need for smart microalgal bioprospecting.
    Labara Tirado J, Herdean A, Ralph PJ. Labara Tirado J, et al. Nat Prod Bioprospect. 2025 Jan 16;15(1):7. doi: 10.1007/s13659-024-00487-3. Nat Prod Bioprospect. 2025. PMID: 39815030 Free PMC article. Review.
  • Aggregation-Induced Emission Photosensitizer Boosting Algal Growth and Lipid Accumulation.
    Rakhi S, Reza AM, Davies B, Wang J, Tang Y, Qin J. Rakhi S, et al. Small. 2024 Nov;20(47):e2402463. doi: 10.1002/smll.202402463. Epub 2024 Aug 19. Small. 2024. PMID: 39161188 Free PMC article.

References

    1. de Carvalho M.J.C.R., Caramujo M.J. The various roles of fatty acids. Molecules. 2018;23:2583. doi: 10.3390/molecules23102583. - DOI - PMC - PubMed
    1. Shahidi F., Ambigaipalan P. Omega-3 polyunsaturated fatty acids and their health benefits. Annu. Rev. Food Sci. Technol. 2018;9:345–381. doi: 10.1146/annurev-food-111317-095850. - DOI - PubMed
    1. Orešič M., Hänninen V.A., Vidal-Puig A. Lipidomics: A new window to biomedical frontiers. Trends Biotechnol. 2008;26:647–652. doi: 10.1016/j.tibtech.2008.09.001. - DOI - PubMed
    1. Fasano E., Serini S., Cittadini A., Calviello G. Long-chain n-3 PUFA against breast and prostate cancer: Which are the appropriate doses for intervention studies in animals and humans? Crit. Rev. Food Sci. Nutr. 2015;57:2245–2262. doi: 10.1080/10408398.2013.850060. - DOI - PubMed
    1. Coelho O.G.L., Silva B., Rocha D.M., Lopes L., Alfenas R.D.C.G. Polyunsaturated fatty acids and type 2 diabetes: Impact on the glycemic control mechanism. Crit. Rev. Food Sci. Nutr. 2017;57:3614–3619. doi: 10.1080/10408398.2015.1130016. - DOI - PubMed