Near-Infrared Transflectance Spectroscopy Discriminates Solutions Containing Two Commercial Formulations of Botulinum Toxin Type A Diluted at Recommended Volumes for Clinical Reconstitution
- PMID: 35448275
- PMCID: PMC9032888
- DOI: 10.3390/bios12040216
Near-Infrared Transflectance Spectroscopy Discriminates Solutions Containing Two Commercial Formulations of Botulinum Toxin Type A Diluted at Recommended Volumes for Clinical Reconstitution
Abstract
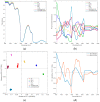
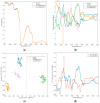
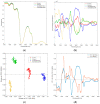
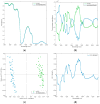
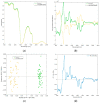
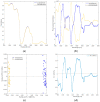
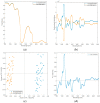
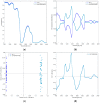
Botulinum neurotoxin type A (BoNT-A) is the active substance in pharmaceutical preparations widely used worldwide for the highly effective treatment of various disorders. Among the three commercial formulations of BoNT-A currently available in Italy for neurological indications, abobotulinum A toxin (Dysport®, Ipsen SpA, Milano, Italy) and incobotulinum A toxin (Xeomin®, Merz Pharma Italia srl, Milano, Italy) differ in the content of neurotoxin, non-toxic protein, and excipients. Clinical applications of BoNT-A adopt extremely diluted solutions (10-6 mg/mL) for injection in the target body district. Near-infrared spectroscopy (NIRS) and chemometrics allow rapid, non-invasive, and non-destructive methods for qualitative and quantitative analysis. No data are available to date on the chemometric analysis of the spectral fingerprints acquired from the diluted commercial formulations of BoNT-A. In this proof-of-concept study, we tested whether NIRS can categorize solutions of incobotulinum A toxin (lacking non-toxic proteins) and abobotulinum A toxin (containing non-toxic proteins). Distinct excipients in the two formulations were also analyzed. We acquired transmittance spectra in the visible and short-wave infrared regions (350-2500 nm) by an ASD FieldSpec 4™ Standard-Res Spectrophotoradiometer, using a submerged dip probe designed to read spectra in transflectance mode from liquid samples. After preliminary spectra pre-processing, principal component analysis was applied to characterize the spectral features of the two BoNT-A solutions and those of the various excipients diluted according to clinical standards. Partial least squares-discriminant analysis was used to implement a classification model able to discriminate the BoNT-A solutions and excipients. NIRS distinguished solutions containing distinct BoNT-A commercial formulations (abobotulinum A toxin vs. incobotulinum A toxin) diluted at recommended volumes for clinical reconstitution, distinct proteins (HSA vs. incobotulinum A toxin), very diluted solutions of simple sugars (lactose vs. sucrose), and saline or water. Predictive models of botulinum toxin formulations were also performed with the highest precision and accuracy.
Keywords: NIR spectroscopy; botulinum neurotoxin type A; chemometrics; partial least squares-discriminant analysis; transflectance spectroscopy.
Conflict of interest statement
The authors declare that they have no known competing financial interests or personal relationships that could appear to influence the work reported in this paper.
Figures



Similar articles
-
The science and manufacturing behind botulinum neurotoxin type A-ABO in clinical use.Aesthet Surg J. 2009 Nov;29(6 Suppl):S34-42. doi: 10.1016/j.asj.2009.09.014. Aesthet Surg J. 2009. PMID: 19945003 Review.
-
Conversion Ratio between Botox®, Dysport®, and Xeomin® in Clinical Practice.Toxins (Basel). 2016 Mar 4;8(3):65. doi: 10.3390/toxins8030065. Toxins (Basel). 2016. PMID: 26959061 Free PMC article. Review.
-
Content of botulinum neurotoxin in Botox®/Vistabel®, Dysport®/Azzalure®, and Xeomin®/Bocouture®.Drugs R D. 2010;10(2):67-73. doi: 10.2165/11584780-000000000-00000. Drugs R D. 2010. PMID: 20698714 Free PMC article.
-
Complexing Protein-Free Botulinum Neurotoxin A Formulations: Implications of Excipients for Immunogenicity.Toxins (Basel). 2024 Feb 10;16(2):101. doi: 10.3390/toxins16020101. Toxins (Basel). 2024. PMID: 38393178 Free PMC article. Review.
-
AbobotulinumtoxinA (Dysport®), OnabotulinumtoxinA (Botox®), and IncobotulinumtoxinA (Xeomin®) Neurotoxin Content and Potential Implications for Duration of Response in Patients.Toxins (Basel). 2018 Dec 13;10(12):535. doi: 10.3390/toxins10120535. Toxins (Basel). 2018. PMID: 30551641 Free PMC article.
Cited by
-
Photonic Sensors in Chemical and Biological Applications.Biosensors (Basel). 2022 Nov 15;12(11):1021. doi: 10.3390/bios12111021. Biosensors (Basel). 2022. PMID: 36421139 Free PMC article.
References
MeSH terms
Substances
LinkOut - more resources
Full Text Sources
Medical
Miscellaneous

