

Changes in the Cerebrospinal Fluid and Plasma Lipidome in Patients with Rett Syndrome
- PMID: 35448478
- PMCID: PMC9026385
- DOI: 10.3390/metabo12040291
Changes in the Cerebrospinal Fluid and Plasma Lipidome in Patients with Rett Syndrome
Abstract
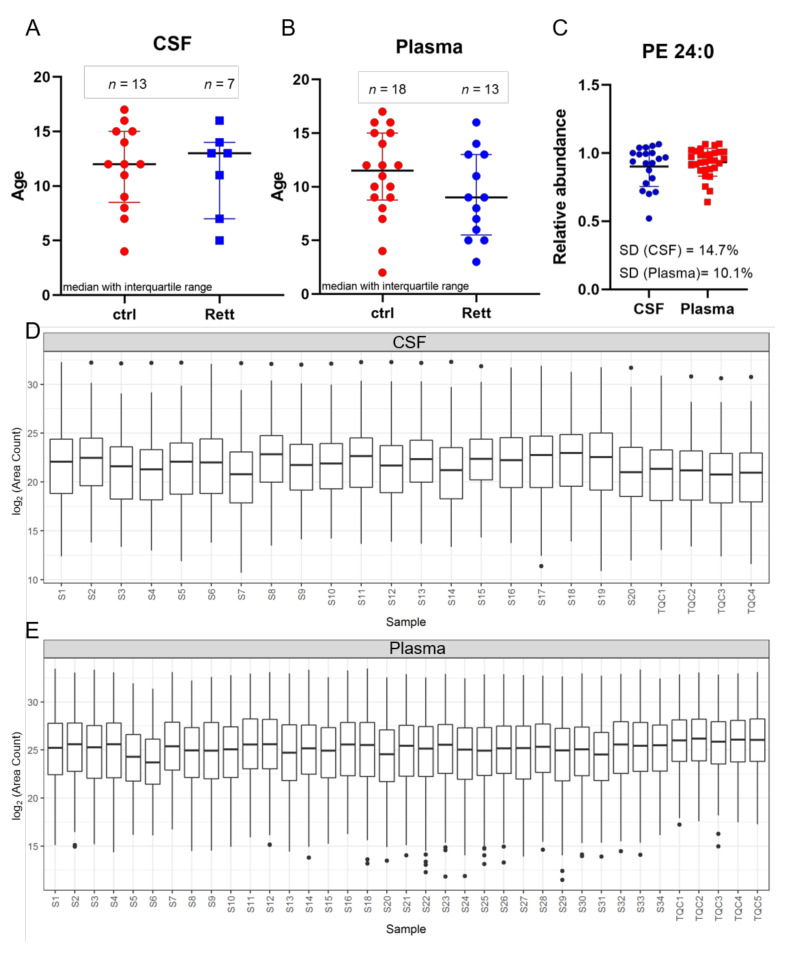
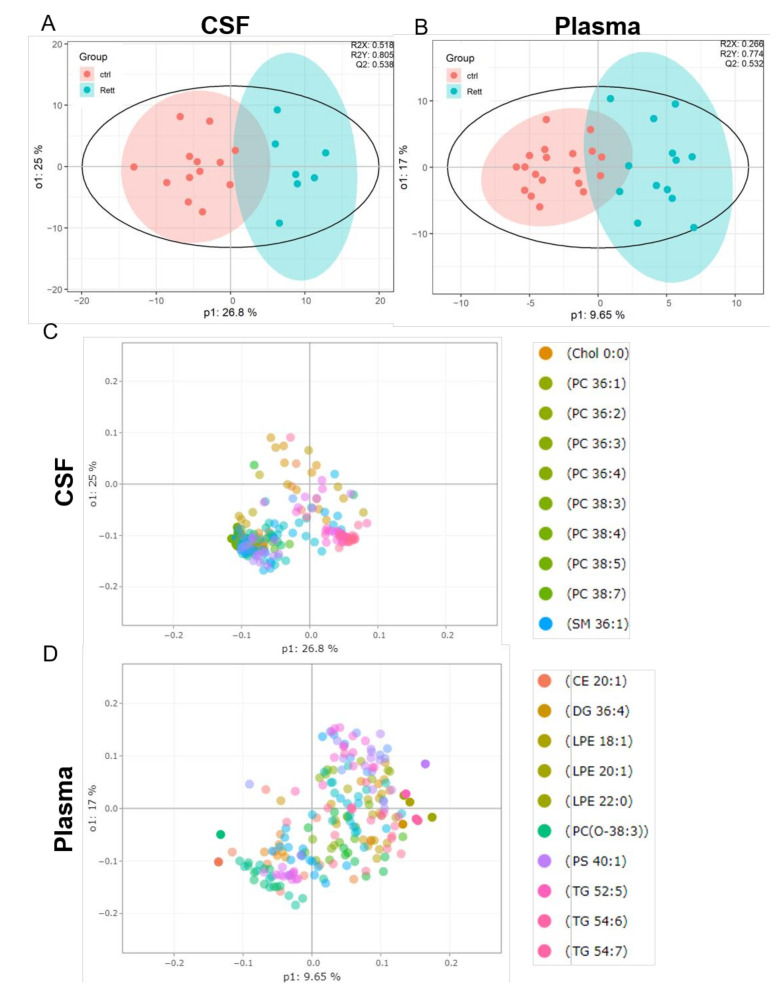
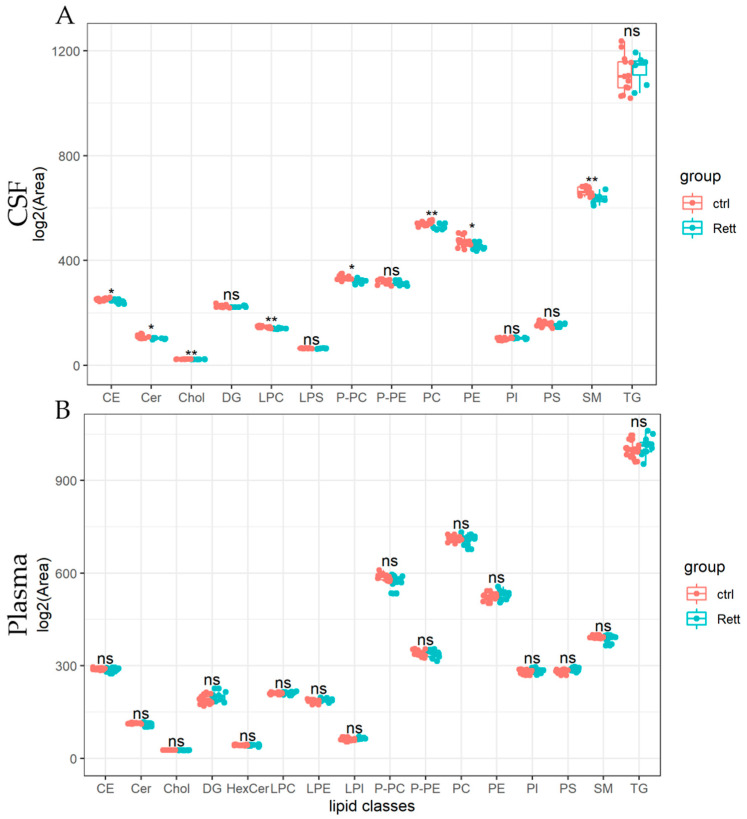
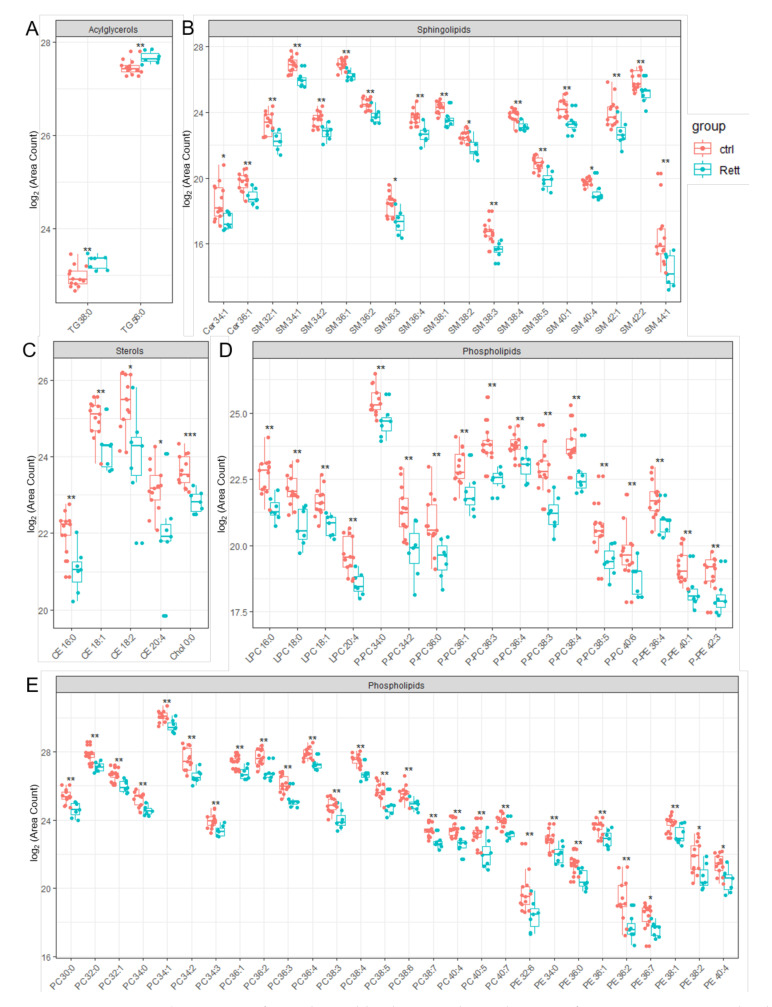
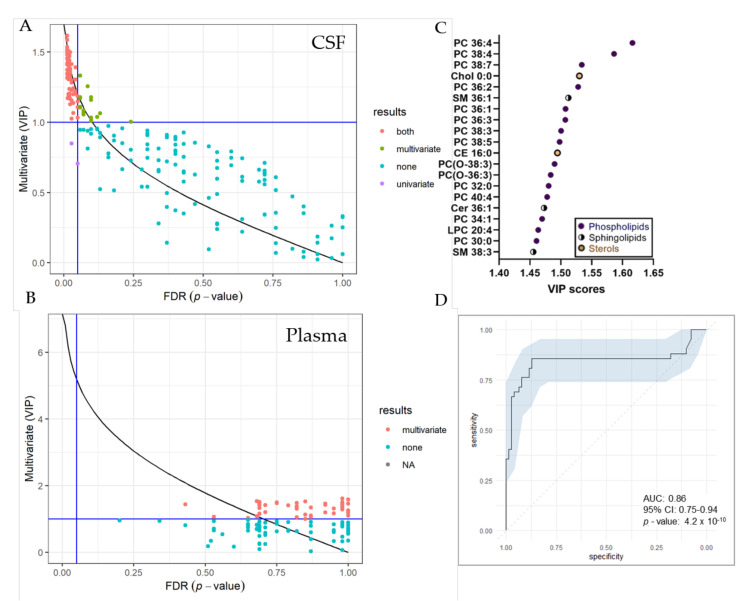
Rett syndrome (RTT) is defined as a rare disease caused by mutations of the methyl-CpG binding protein 2 (MECP2). It is one of the most common causes of genetic mental retardation in girls, characterized by normal early psychomotor development, followed by severe neurologic regression. Hitherto, RTT lacks a specific biomarker, but altered lipid homeostasis has been found in RTT model mice as well as in RTT patients. We performed LC-MS/MS lipidomics analysis to investigate the cerebrospinal fluid (CSF) and plasma composition of patients with RTT for biochemical variations compared to healthy controls. In all seven RTT patients, we found decreased CSF cholesterol levels compared to age-matched controls (n = 13), whereas plasma cholesterol levels were within the normal range in all 13 RTT patients compared to 18 controls. Levels of phospholipid (PL) and sphingomyelin (SM) species were decreased in CSF of RTT patients, whereas the lipidomics profile of plasma samples was unaltered in RTT patients compared to healthy controls. This study shows that the CSF lipidomics profile is altered in RTT, which is the basis for future (functional) studies to validate selected lipid species as CSF biomarkers for RTT.
Keywords: LC-MS; Rett syndrome; biomarker; lipidomics; metabolomics; rare diseases.
Conflict of interest statement
The authors declare no conflict of interest.
Figures
Similar articles
-
MECP2 mutations and clinical correlations in Greek children with Rett syndrome and associated neurodevelopmental disorders.Brain Dev. 2012 Jun;34(6):487-95. doi: 10.1016/j.braindev.2011.09.002. Epub 2011 Oct 6. Brain Dev. 2012. PMID: 21982064
-
Exploring the possible link between MeCP2 and oxidative stress in Rett syndrome.Free Radic Biol Med. 2015 Nov;88(Pt A):81-90. doi: 10.1016/j.freeradbiomed.2015.04.019. Epub 2015 May 8. Free Radic Biol Med. 2015. PMID: 25960047 Review.
-
Surface- and voxel-based brain morphologic study in Rett and Rett-like syndrome with MECP2 mutation.Int J Dev Neurosci. 2019 Apr;73:83-88. doi: 10.1016/j.ijdevneu.2019.01.005. Epub 2019 Jan 25. Int J Dev Neurosci. 2019. PMID: 30690146 Free PMC article.
-
Thyroid function in Rett syndrome.Horm Res Paediatr. 2015;83(2):118-25. doi: 10.1159/000370066. Epub 2015 Jan 21. Horm Res Paediatr. 2015. PMID: 25614013 Clinical Trial.
-
Rett syndrome: methyl-CpG-binding protein 2 mutations and phenotype-genotype correlations.Am J Med Genet. 2000 Summer;97(2):147-52. doi: 10.1002/1096-8628(200022)97:2<147::aid-ajmg6>3.0.co;2-o. Am J Med Genet. 2000. PMID: 11180222 Review.
Cited by
-
Convergent cerebrospinal fluid proteomes and metabolic ontologies in humans and animal models of Rett syndrome.iScience. 2022 Aug 17;25(9):104966. doi: 10.1016/j.isci.2022.104966. eCollection 2022 Sep 16. iScience. 2022. PMID: 36060065 Free PMC article.
-
Rett Syndrome and the Role of MECP2: Signaling to Clinical Trials.Brain Sci. 2024 Jan 24;14(2):120. doi: 10.3390/brainsci14020120. Brain Sci. 2024. PMID: 38391695 Free PMC article. Review.
-
Associations of the Lipidome with Ageing, Cognitive Decline and Exercise Behaviours.Metabolites. 2022 Aug 31;12(9):822. doi: 10.3390/metabo12090822. Metabolites. 2022. PMID: 36144226 Free PMC article. Review.
-
Phospholipidomics in Clinical Trials for Brain Disorders: Advancing our Understanding and Therapeutic Potentials.Mol Neurobiol. 2024 Jun;61(6):3272-3295. doi: 10.1007/s12035-023-03793-y. Epub 2023 Nov 20. Mol Neurobiol. 2024. PMID: 37981628 Free PMC article. Review.
-
Ultraviolet exposure regulates skin metabolome based on the microbiome.Sci Rep. 2023 May 3;13(1):7207. doi: 10.1038/s41598-023-34073-3. Sci Rep. 2023. PMID: 37137992 Free PMC article.
References
Grants and funding
LinkOut - more resources
Full Text Sources
