. 2022 Mar 29;12(4):301.
doi: 10.3390/metabo12040301.

Camu-Camu Reduces Obesity and Improves Diabetic Profiles of Obese and Diabetic Mice: A Dose-Ranging Study

Affiliations

Camu-Camu Reduces Obesity and Improves Diabetic Profiles of Obese and Diabetic Mice: A Dose-Ranging Study

Anne Abot et al. Metabolites. .

Abstract

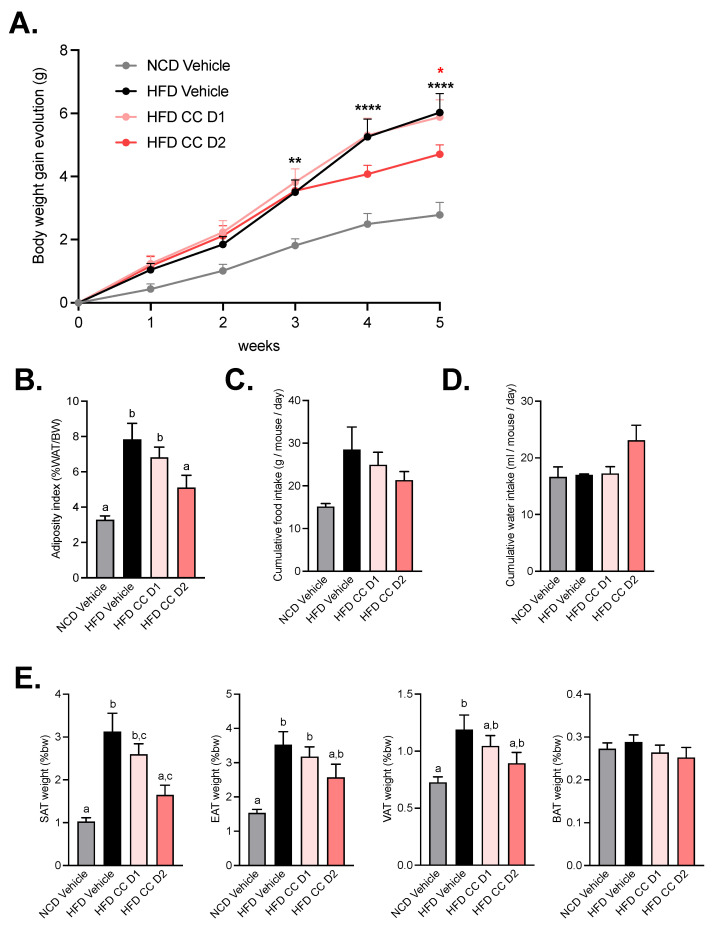
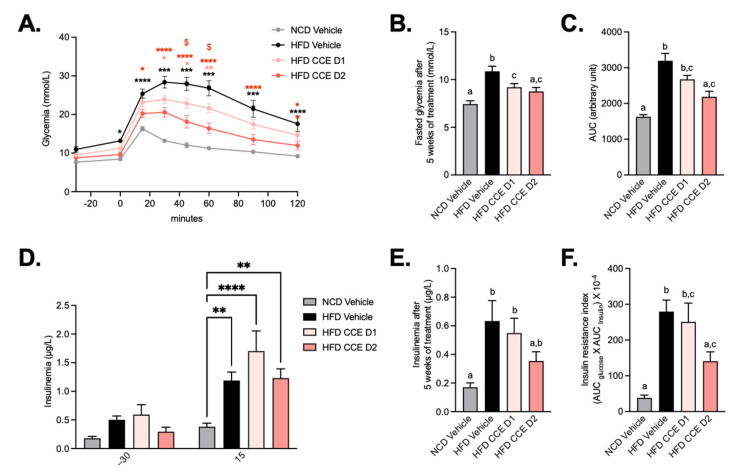
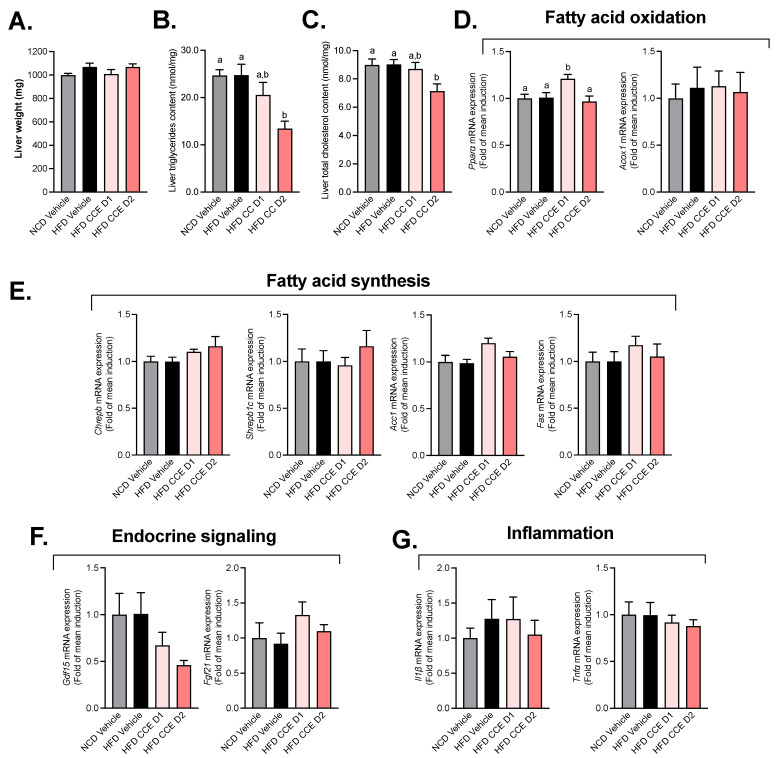
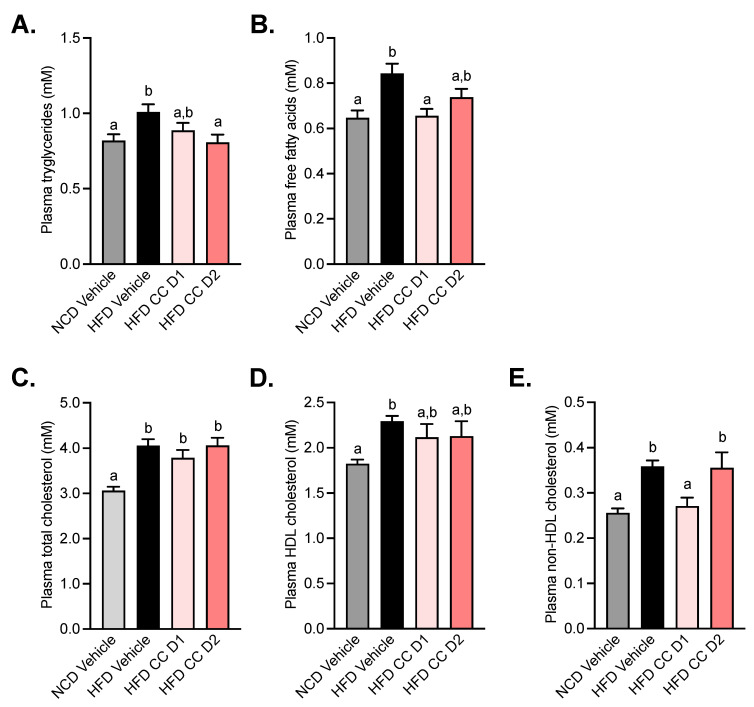
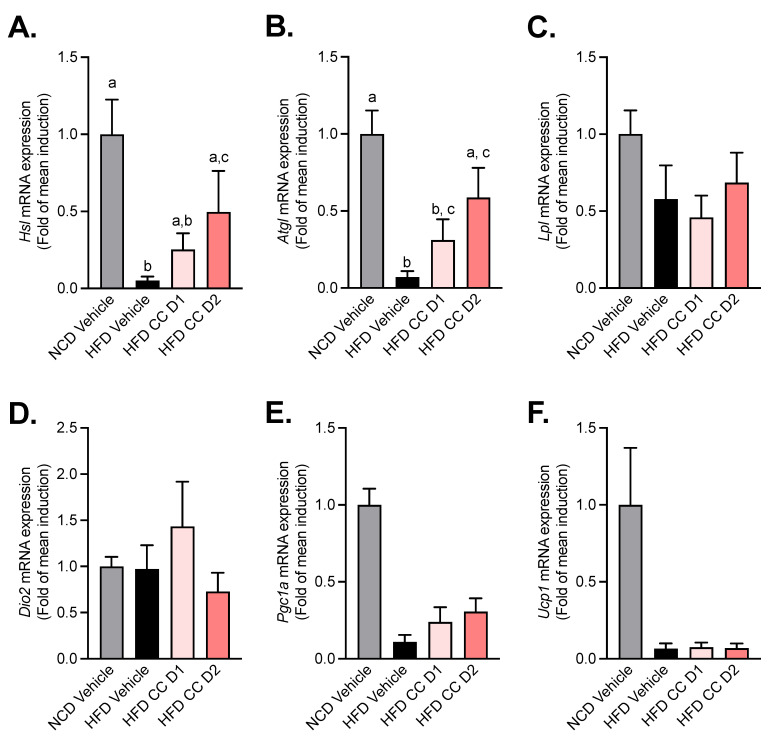
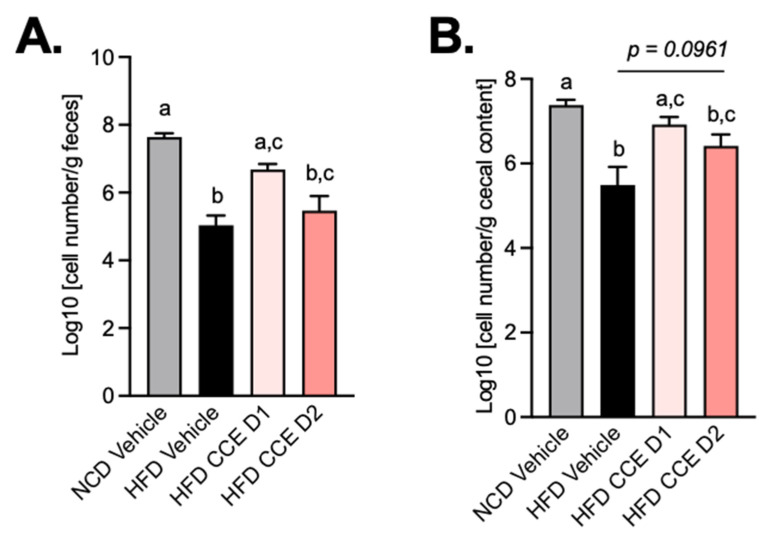
Overweight, obesity, and their comorbidities are currently considered a major public health concern. Today considerable efforts are still needed to develop efficient strategies able to attenuate the burden of these diseases. Nutritional interventions, some with plant extracts, present promising health benefits. In this study, we evaluated the action of Camu-Camu (Myrciaria dubia), an Amazonian fruit rich in polyphenols and vitamin C, on the prevention of obesity and associated disorders in mice and the abundance of Akkermansia muciniphila in both cecum and feces. Methods: We investigated the dose-response effects of Camu-Camu extract (CCE) in the context of high-fat-diet (HFD)-induced obesity. After 5 weeks of supplementation, we demonstrated that the two doses of CCE differently improved glucose and lipid homeostasis. The lowest CCE dose (62.5 mg/kg) preferentially decreased non-HDL cholesterol and free fatty acids (FFA) and increased the abundance of A. muciniphila without affecting liver metabolism, while only the highest dose of CCE (200 mg/kg) prevented excessive body weight gain, fat mass gain, and hepatic steatosis. Both doses decreased fasting hyperglycemia induced by HFD. In conclusion, the use of plant extracts, and particularly CCE, may represent an additional option in the support of weight management strategies and glucose homeostasis alteration by mechanisms likely independent from the modulation of A. muciniphila abundance.

Keywords: Camu-Camu extract; antioxidant; diabetes; nutraceuticals; obesity.


Conflict of interest statement

P.D.C. and C.K. are co-founders of Enterosys S.A.S (Labège, France). A.A. and N.P. are employed by Enterosys S.A. (Labège, France). P.D.C. and W.M.d.V. are co-founders of A-Mansia Biotech SA (Mont-Saint-Guibert, Belgium). P.D.C., C.D. and W.M.d.V. are owners of several patents concerning the use of microbiota and health. A.B. is employed by A-Mansia Biotech SA (Mont-Saint-Guibert, Belgium), C.D. is former employee of A-Mansia Biotech SA (Mont-Saint-Guibert, Belgium).

Figures

Figure 1
Figure 1
Camu-Camu prevents obesity in diet-induced obese mice only at high dose of treatment. Effects of oral administration of vehicle or CCE on (A) body weight gain evolution, * p < 0.05, ** p < 0.01, **** p < 0.0001 vs. HFD vehicle based on 2-way ANOVA followed by Bonferroni’s post hoc test, (B) adiposity index (% of total white adipose tissue mass divided by the body weight), (C) cumulative food intake, (D) cumulative water intake, (E) relative fat-mass distribution (% of body weight) of subcutaneous adipose tissue (SAT), epididymal adipose tissue (EAT), visceral adipose tissue (VAT), and brown adipose tissue (BAT). Per group, n = 9–10. In figures (B,E) data with different superscript letters are significantly different (p < 0.05) according to post hoc ANOVA one-way statistical analysis (Bonferroni’s post hoc test). In panel (A), only statistics vs. HFD vehicle were presented in the graph. The significant comparisons were: ** p < 0.01 at week 3, and **** p < 0.0001 at week 4 and 5 for HFD vs. NCD vehicle. and * p < 0.05 at week 5 for HFD CCE D2 vs. HFD vehicle.
Figure 2
Figure 2
Camu-Camu improves glucose tolerance in diet-induced obese mice in a dose-dependent manner. Effects of oral administration of vehicle or CCE in 6-hour-fasted mice on (A) oral glucose tolerance test (OGTT), glycemia before and after an oral load of glucose (2 g/kg of body weight) after 4 weeks of treatment * p < 0.05, ** p < 0.01, **** p < 0.0001 vs. HFD vehicle and $ p < 0.05 HFD CCE D1 vs. HFD CCE D2 based on 2-way ANOVA followed by Bonferroni’s post hoc test, (B) fasted glycemia at the necropsy after 5 weeks of treatment, (C) glucose area-under-the-curve (AUC) measured during the OGTT after 4 weeks of treatment, (D) insulinemia 30 min before and 15 min after an oral load of glucose after 4 weeks of treatment, ** p < 0.01, **** p < 0.0001 vs. HFD vehicle based on 2-way ANOVA followed by Bonferroni’s post hoc test, (E) insulinemia at the necropsy after 5 weeks of treatment, (F) insulin resistance index determined by multiplying the AUC of blood glucose by the AUC of insulin between 30 min before and 15 min after glucose loading after 4 weeks of treatment, n = 9–10 per group. In figures (B,C,E,F), data with different superscript letters are significantly different (p < 0.05) according to post hoc ANOVA one-way statistical analysis (Bonferroni’s post hoc test). In panel (A), only statistics vs. HFD vehicle were presented in the graph. The other significant comparisons were: *** p < 0.001 after 15 min, **** p < 0.0001 after 30 min, **** p < 0.0001 after 45 min, **** p < 0.0001 after 60 min, **** p < 0.0001 after 90 min, and ** p < 0.01 after 120 min for HFD CCE D1 vs. NCD vehicle and **** p < 0.0001 after 30 min, ** p < 0.01 after 45 min, and * p < 0.05 after 60 min for HFD CCE D2 vs. NCD vehicle.
Figure 3
Figure 3
Effect of Camu-Camu on hepatic metabolism in DIO mice. Effects of oral administration of vehicle or CCE in 6-hour-fasted mice after 5 weeks of treatment on (A) liver weight, (B) liver triglycerides, and (C) cholesterol content and the gene expression of hepatic biomarkers involved in (D) fatty acid oxidation (no significant difference was observed), (E) fatty acid synthesis, (F) endocrine signaling (no significant difference was observed), (G) inflammation (no significant difference was observed); n = 9–10 per group. In figure (BD), data with different superscript letters are significantly different (p < 0.05) according to post hoc ANOVA one-way statistical analysis (Bonferroni’s post hoc test).
Figure 4
Figure 4
Camu-Camu improves plasma lipid profile in diet-induced obese mice. Effects of oral administration of vehicle or CCE in 6-hour-fasted mice after 5 weeks of treatment on (A) plasma triglycerides, (B) plasma free fatty acids, (C) plasma total cholesterol, (D) plasma HDL cholesterol, (E) plasma non-HDL cholesterol; n = 9–10 per group. In figures (AE) data with different superscript letters are significantly different (p < 0.05) according to post hoc ANOVA one-way statistical analysis (Bonferroni’s post hoc test).
Figure 5
Figure 5
Camu-Camu reduces HFD-induced decrease in markers of triglyceride hydrolases without affecting markers of browning in the subcutaneous adipose tissue. Effects of oral administration of vehicle or CCE in 6-hour-fasted mice after 5 weeks of treatment on the mRNA expression of (A) hormone-sensitive lipase (Hsl) and (B) adipose triglyceride lipase (Atgl). (C) Lipoprotein lipase (lpl) and (DF) the gene expression of markers of browning (Dio2, Pgc1a, Ucp1) (no significant difference was observed); n = 5–9 per group. In figure (A,B), data with different superscript letters are significantly different (p < 0.05) according to post hoc ANOVA one-way statistical analysis (Bonferroni’s posthoc test).
Figure 6
Figure 6
Camu-Camu prevents A. muciniphila decrease induced by HFD. Effects of oral administration of vehicle or CCE on quantification of A. muciniphila (A) in feces, (B) in cecal content.; n = 9–10 per group. In figures (A,B), data with different superscript letters are significantly different (p < 0.05) according to post hoc ANOVA one-way statistical analysis (Bonferroni’s post hoc test).

References

    1. Piche M.E., Tchernof A., Despres J.P. Obesity Phenotypes, Diabetes, and Cardiovascular Diseases. Circ. Res. 2020;126:1477–1500. doi: 10.1161/CIRCRESAHA.120.316101. - DOI - PubMed
    1. Federation W.O. Obesity: Missing the 2025 Global Targets. Trends, Costs and Country Reports. World Obesity Federation; London, UK: 2020.
    1. Federation I.D. IDF Diabetes Atlas. 9th ed. International Diabetes Federation; Brussels, Belgium: 2019.
    1. Joslin E. The prevention of diabetes mellitus. J. Am. Med. Assoc. 1921;76:79–84. doi: 10.1001/jama.1921.02630020001001. - DOI
    1. Haffner S.M., Valdez R.A., Hazuda H.P., Mitchell B.D., Morales P.A., Stern M.P. Prospective analysis of the insulin-resistance syndrome (syndrome X) Diabetes. 1992;41:715–722. doi: 10.2337/diab.41.6.715. - DOI - PubMed

LinkOut - more resources