. 2022 Mar 31;12(4):308.
doi: 10.3390/metabo12040308.

NMR Metabolomics Reveal Urine Markers of Microbiome Diversity and Identify Benzoate Metabolism as a Mediator between High Microbial Alpha Diversity and Metabolic Health

Affiliations

NMR Metabolomics Reveal Urine Markers of Microbiome Diversity and Identify Benzoate Metabolism as a Mediator between High Microbial Alpha Diversity and Metabolic Health

Johannes Hertel et al. Metabolites. .

Abstract

Microbial metabolites measured using NMR may serve as markers for physiological or pathological host-microbe interactions and possibly mediate the beneficial effects of microbiome diversity. Yet, comprehensive analyses of gut microbiome data and the urine NMR metabolome from large general population cohorts are missing. Here, we report the associations between gut microbiota abundances or metrics of alpha diversity, quantified from stool samples using 16S rRNA gene sequencing, with targeted urine NMR metabolites measures from 951 participants of the Study of Health in Pomerania (SHIP). We detected significant genus-metabolite associations for hippurate, succinate, indoxyl sulfate, and formate. Moreover, while replicating the previously reported association between hippurate and measures of alpha diversity, we identified formate and 4-hydroxyphenylacetate as novel markers of gut microbiome alpha diversity. Next, we predicted the urinary concentrations of each metabolite using genus abundances via an elastic net regression methodology. We found profound associations of the microbiome-based hippurate prediction score with markers of liver injury, inflammation, and metabolic health. Moreover, the microbiome-based prediction score for hippurate completely mediated the clinical association pattern of microbial diversity, hinting at a role of benzoate metabolism underlying the positive associations between high alpha diversity and healthy states. In conclusion, large-scale NMR urine metabolomics delivered novel insights into metabolic host-microbiome interactions, identifying pathways of benzoate metabolism as relevant candidates mediating the beneficial health effects of high microbial alpha diversity.

Keywords: NMR metabolomics; alpha diversity; benzoate metabolism; large cohort data; microbiome.


Conflict of interest statement

The authors declare no conflict of interest. The funders had no role in the design of the study; in the collection, analyses, or interpretation of data; in the writing of the manuscript; or in the decision to publish the results. H.J.G. has received travel grants and speakers honoraria from Fresenius Medical Care, Neuraxpharm, Servier, and Janssen Cilag. A.P. has received lecturer honoraria from Technopath Clinical Diagnostics, Tosoh Bioscience, Roche Diagnostics, Beckmann Coulter GmbH, and Radiometer. M.N. has received travel grants by German Medical Association, German Centre for Cardiovascular Research, German Society for Clinical Chemistry and Laboratory Medicine, German National Cohort, German Research Foundation, Deutsche Akkreditierungsstelle, Sysmex, MDI Limbach, medpoint GmbH and Diasys; speaker’s honoraria from Novartis Pharma, Radiometer, AstraZeneca, Technopath Clinical Diagnostics, Sysmex, MDI Limbach, and medpoint Medizinkommunikations GmbH; and research funding from Aerocom GmbH and Profil Institut für Stoffwechselforschung GmbH.

Figures

Figure 1
Figure 1
Overview of the significant metabolite–genus associations. (A) Boxplots for genus presence metabolite association with a false discovery rate < 0.05. The Y-axis denotes the log-transformed and regression-normalised urinary concentrations. (B) Table displaying the genus presence metabolite associations with FDR < 0.05. (C) Scatter plots of selected genus abundances against urinary metabolite levels after log-transformation and regression-based normalisation. The red line indicates the linear regression line, where the dashed red lines display the 95% confidence interval. (D) Table displaying the genus abundance metabolite associations with FDR < 0.05. FDR—false discovery rate; b—unstandardised regression coefficients; 95% CI—95% confidence intervals.
Figure 2
Figure 2
Overview of microbiome alpha diversity–metabolite associations. (A) Scatter plots of Shannon diversity or species richness against urinary metabolite levels after log-transformation and regression-based normalisation. A red line indicates the linear regression line, where the dashed red lines display the 95% confidence interval. All shown associations have an FDR < 0.05. (B) Table displaying the alpha diversity metabolite associations with an FDR < 0.05. (C) Scatter plots of Shannon diversity or urinary hippurate concentrations (log-transformed and regression-based normalised) against the microbiome-based hippurate prediction score from elastic net regressions. A red line indicates the linear regression line, where the dashed red lines display the 95% confidence interval. FDR—false discovery rate; b—unstandardised regression coefficients; 95% CI—95% confidence intervals.
Figure 3
Figure 3
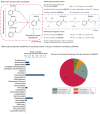
Microbe–host interactions regarding benzoate metabolism. (A) Microbe–host benzoate co-metabolism, as noted in AGORA2 and the Virtual Metabolic Human database (https://www.vmh.life, accessed on 28 January 2022). The reaction naming follows the AGORA2 nomenclature. (B) Benzoate production capabilities across phyla, as noted in AGORA2 as a share within phyla (left panel) and absolute number (right panel).
Figure 4
Figure 4
Overview of the results regarding reaction abundances after functional annotation of the Yachida et al. dataset using AGORA2. (A) Scatter plots of reaction abundances against the Shannon entropy of metagenomes after mapping onto AGORA2. A red line indicates the linear regression line, where the dashed red lines display the 95% confidence interval. All displayed associations had a false discovery rate < 0.05. (B) Table displaying the reaction abundance Shannon entropy associations for benzoate-producing, -degrading, or -transporting reactions noted in AGORA2. OR—odds ratio; 95% CI—95% confidence interval.

Similar articles

Cited by

References

    1. Nicholson J.K., Holmes E., Kinross J., Burcelin R., Gibson G., Jia W., Pettersson S. Host-Gut Microbiota Metabolic Interactions. Science. 2012;336:1262–1267. doi: 10.1126/science.1223813. - DOI - PubMed
    1. Cho I., Blaser M.J. The Human Microbiome: At the Interface of Health and Disease. Nat. Rev. Genet. 2012;13:260–270. doi: 10.1038/nrg3182. - DOI - PMC - PubMed
    1. Lynch S.V., Pedersen O. The Human Intestinal Microbiome in Health and Disease. N Engl. J. Med. 2016;375:2369–2379. doi: 10.1056/NEJMra1600266. - DOI - PubMed
    1. Hollister E.B., Gao C., Versalovic J. Compositional and Functional Features of the Gastrointestinal Microbiome and Their Effects on Human Health. Gastroenterology. 2014;146:1449–1458. doi: 10.1053/j.gastro.2014.01.052. - DOI - PMC - PubMed
    1. Visconti A., Le Roy C.I., Rosa F., Rossi N., Martin T.C., Mohney R.P., Li W., de Rinaldis E., Bell J.T., Venter J.C., et al. Interplay between the Human Gut Microbiome and Host Metabolism. Nat. Commun. 2019;10:4505. doi: 10.1038/s41467-019-12476-z. - DOI - PMC - PubMed

LinkOut - more resources