. 2022 Apr 21;22(1):197.
doi: 10.1186/s12876-022-02268-z.

CD10 and Das1: a biomarker study using immunohistochemistry to subtype gastric intestinal metaplasia

Affiliations

CD10 and Das1: a biomarker study using immunohistochemistry to subtype gastric intestinal metaplasia

Athanasios Koulis et al. BMC Gastroenterol. .

Abstract

Background: Intestinal metaplasia (IM) is considered a key pivot point in the Correa model of gastric cancer (GC). It is histologically subtyped into the complete and incomplete subtypes, the latter being associated with a greater risk of progression. However, the clinical utility of IM subtyping remains unclear, partially due to the absence of reliable defining biomarkers.

Methods: Based on gene expression data and existing literature, we selected CD10 and Das1 as candidate biomarkers to distinguish complete and incomplete IM glands in tissues from patients without GC (IM-GC) and patients with GC (IM + GC). Immunohistochemical staining of individually subtyped IM glands was scored after blinding by two researchers using tissue belonging to both IM-GC and IM + GC patients. Whole tissue Das1 staining was further assessed using digital image quantification (cellSens Dimension, Olympus).

Results: Across both cohorts CD10 stained the IM brush border and was shown to have a high sensitivity (87.5% and 94.9% in IM-GC and IM + GC patients respectively) and specificity (100.0% and 96.7% respectively) with an overall AUROC of 0.944 for complete IM glands. By contrast Das1 stained mainly goblet cells and the apical membrane of epithelial cells, mostly of incomplete IM glands with a low sensitivity (28.6% and 29.3% in IM-GC and IM + GC patients respectively) but high specificity (98.3% and 85.1% respectively) and an overall AUROC of 0.603 for incomplete IM glands. A combined logistic regression model showed a significant increase in AUROC for detecting complete IM glands (0.955 vs 0.970). Whole tissue digital quantification of Das1 staining showed a significant association with incomplete IM compared to complete IM, both in IM-GC and in IM + GC patients (p = 0.016 and p = 0.009 respectively, Mann-Whitney test and unpaired t test used). Additionally, complete IM in IM + GC patients exhibited significantly more Das1 staining than in IM-GC patients (p = 0.019, Mann-Whitney test).

Conclusions: These findings suggest that CD10 is an outstanding biomarker for complete IM and Das1 may be useful as a secondary biomarker for IM glands at greater risk of progression irrespective of IM subtype. Overall, the clinical use of these biomarkers could lead to improved patient stratification and targeted surveillance.

Keywords: Biomarkers; CD10; Das1; Digital quantification; Gastric cancer; Gene expression profiling; Immunohistochemistry; Intestinal metaplasia subtypes; Logistic regression model; Risk of progression.


Conflict of interest statement

The authors declare no potential conflict of interest.

Figures
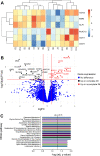
Fig. 1
Fig. 1
Gene expression analysis of IM samples in patients without cancer (IM-GC). A Heatmap showing unsupervised clustering of samples using ALPI, CD24, CDX1, CDX2, MME, and MUC12 to subgroup samples (n = 14). Expression levels have been standardised (centered and scaled) within rows for visualization. Legend shows z score. Cluster 1 represents complete IM and cluster 2 represents incomplete IM samples. Samples S8 and S12 were removed from these 2 clusters as they likely represent mixed IM. B Volcano plot showing differentially expressed genes (logFC > 0.6 or < − 0.6 with FDR adjusted p < 0.05) between complete and incomplete IM. Probes with no gene names and differentially expressed probes/genes with duplicates removed. C Bar plot showing KEGG pathways [34] enriched in molecularly subtyped complete IM using single sample gene set enrichment analysis (ssGSEA). To calculate statistical significance, the Wilcoxon rank sum test followed by multiple test correction (Benjamini–Hochberg method) was used. No enriched pathways were detected in incomplete IM. Differential gene expression and ssGSEA were performed using the limma and GSVA packages in R
Fig. 2
Fig. 2
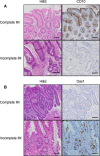
Representative Anti-CD10 and Das1 staining on complete and incomplete intestinal metaplasia tissue. A Complete IM tissue stained positive for CD10 but incomplete IM tissue was negative for CD10. B Complete IM tissue was negative for Das1 whereas incomplete IM tissue was positive for Das1 staining. Scale bar: 100 μm
Fig. 3
Fig. 3
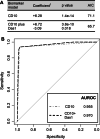
Logistic regression models comparing CD10 with combined CD10 and Das1 staining for complete IM glands. A Comparison of CD10 IHC staining on its own and CD10 combined with Das1 IHC staining for complete IM glands using a logistic regression model. 1Coefficient shows direction and relative change per unit increase. AIC: Akaike Information Criterion. B Receiver Operating Characteristic curves and Areas Under Receiver Operating Characteristic (AUROC) of the logistic regression models. A total of 185 glands with known CD10 and Das1 status from IM-GC and IM + GC patient samples were used together with the glm function in R to create the logistic regression models. The pROC package in R was used to create the graph
Fig. 4
Fig. 4
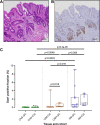
Das1 staining in IM-GC and IM + GC samples. A H&E stain of IM tissue, B Das1 stains the lower parts of IM glands and C digital quantification of Das1 staining for IM-GC (ChG-GC, n = 14; CIM-GC, n = 10; IIM-GC, n = 11) and IM + GC (ChG + GC, n = 11; CIM + GC, n = 10; IIM + GC, n = 7) tissue samples. Statistical analysis carried out using Mann–Whitney test with exception the comparison of CIM + GC with IIM + GC samples where an unpaired t test was used. Scale bars: 100 μm
Fig. 5
Fig. 5
Schematic representation showing combined use of CD10 and Das1 to identify high risk intestinal metaplasia. Schematic model combining CD10 and Das1 staining on IM glands with differing risk of progression. Low risk complete IM is CD10 high in the upper part of the gland and CD10 low in the lower part that includes the stem cell compartment. High risk complete IM is CD10 high in the upper of the gland, CD10 low but also Das1 positive in the lower part of the gland. Incomplete IM is overall CD10 negative but often Das1 positive in the lower part of the gland

Similar articles

Cited by

References

    1. Bray F, Ferlay J, Soerjomataram I, Siegel RL, Torre LA, Jemal A. Global cancer statistics 2018: GLOBOCAN estimates of incidence and mortality worldwide for 36 cancers in 185 countries. CA Cancer J Clin. 2018;68(6):394–424. - PubMed
    1. Maconi G, Manes G, Porro GB. Role of symptoms in diagnosis and outcome of gastric cancer. World J Gastroenterol. 2008;14(8):1149–1155. doi: 10.3748/wjg.14.1149. - DOI - PMC - PubMed
    1. Zheng L, Wu C, Xi P, Zhu M, Zhang L, Chen S, et al. The survival and the long-term trends of patients with gastric cancer in Shanghai, China. BMC Cancer. 2014;14:300. doi: 10.1186/1471-2407-14-300. - DOI - PMC - PubMed
    1. Rawla P, Barsouk A. Epidemiology of gastric cancer: global trends, risk factors and prevention. Prz Gastroenterol. 2019;14(1):26–38. - PMC - PubMed
    1. Matsuda T, Ajiki W, Marugame T, Ioka A, Tsukuma H, Sobue T, et al. Population-based survival of cancer patients diagnosed between 1993 and 1999 in Japan: a chronological and international comparative study. Jpn J Clin Oncol. 2011;41(1):40–51. doi: 10.1093/jjco/hyq167. - DOI - PubMed