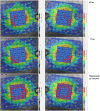
The retinal ganglion cell layer reflects neurodegenerative changes in cognitively unimpaired individuals
- PMID: 35449033
- PMCID: PMC9022357
- DOI: 10.1186/s13195-022-00998-6
The retinal ganglion cell layer reflects neurodegenerative changes in cognitively unimpaired individuals
Abstract
Background: To evaluate a wide range of optical coherence tomography (OCT) parameters for possible application as a screening tool for cognitively healthy individuals at risk of Alzheimer's disease (AD), assessing the potential relationship with established cerebrospinal fluid (CSF) core AD biomarkers and magnetic resonance imaging (MRI).
Methods: We studied 99 participants from the Valdecilla Study for Memory and Brain Aging. This is a prospective cohort for multimodal biomarker discovery and validation that includes participants older than 55 years without dementia. Participants received a comprehensive neuropsychological battery and underwent structural 3-T brain MRI, lumbar puncture for CSF biomarkers (phosphorylated-181-Tau (pTau), total Tau (tTau), beta-amyloid 1-42 (Aβ 1-42), and beta-amyloid 1-40 (Aβ 1-40)). All individuals underwent OCT to measure the retinal ganglion cell layer (GCL), the retinal nerve fiber layer (RFNL), the Bruch's membrane opening-minimum rim width (BMO-MRW), and choroidal thickness (CT). In the first stage, we performed a univariate analysis, using Student's t-test. In the second stage, we performed a multivariate analysis including only those OCT parameters that discriminated at a nominal level, between positive/negative biomarkers in stage 1.
Results: We found significant differences between the OCT measurements of pTau- and tTau-positive individuals compared with those who were negative for these markers, most notably that the GCL and the RNFL were thinner in the former. In stage 2, our dependent variables were the quantitative values of CSF markers and the hippocampal volume. The Aβ 1-42/40 ratio did not show a significant correlation with OCT measurements while the associations between pTau and tTau with GCL were statistically significant, especially in the temporal region of the macula. Besides, the multivariate analysis showed a significant correlation between hippocampal volume with GCL and RNFL. However, after false discovery rate correction, only the associations with hippocampal volume remained significant.
Conclusions: We found a significant correlation between Tau (pTau) and neurodegeneration biomarkers (tTau and hippocampus volume) with GCL degeneration and, to a lesser degree, with damage in RFNL. OCT analysis constitutes a non-invasive and unexpensive biomarker that allows the detection of neurodegeneration in cognitively asymptomatic individuals.
Keywords: Alzheimer’s disease; Amyloid; Ganglion cell layer; Hippocampal volume; Neurodegeneration; Optical coherence tomography; Retinal nerve fiber layer; Tau.
© 2022. The Author(s).
Conflict of interest statement
The authors declare that they have no competing interests.
Figures


References
-
- Tolar M, Abushakra S, Sabbagh M. The path forward in Alzheimer’s disease therapeutics: reevaluating the amyloid cascade hypothesis. Alzheimer’s Dementia. 2020;16(11):1553–60. - PubMed
-
- Visser PJ, Verhey F, Knol DL, Scheltens P, Wahlund L-O, Freund-Levi Y, et al. Prevalence and prognostic value of CSF markers of Alzheimer’s disease pathology in patients with subjective cognitive impairment or mild cognitive impairment in the DESCRIPA study: a prospective cohort study. Lancet Neurol. 2009;8(7):619–27. - PubMed
-
- Fagan AM, Roe CM, Xiong C, Mintun MA, Morris JC, Holtzman DM. Cerebrospinal fluid Tau/β-amyloid42 ratio as a prediction of cognitive decline in nondemented older adults. Arch Neurol. 2007;64(3):343–9. - PubMed
-
- Mattsson N, Henrik Z, Hansson O, Andreasen N, Parnetti L, Jonsson M, et al. CSF biomarkers and incipient Alzheimer disease in patients with mild cognitive impairment. JAMA. 2009;302(4):385–93. - PubMed
Publication types
MeSH terms
Substances
LinkOut - more resources
Full Text Sources
Medical

