Identification of unhealthy alcohol use by self-report and phosphatidylethanol (PEth) blood concentrations in an acute psychiatric department
- PMID: 35449039
- PMCID: PMC9026645
- DOI: 10.1186/s12888-022-03934-y
Identification of unhealthy alcohol use by self-report and phosphatidylethanol (PEth) blood concentrations in an acute psychiatric department
Abstract
Background: The use of standard screening methods could improve the detection rate of unhealthy alcohol use in patients admitted to psychiatric acute and emergency departments. The aim of the present study was to investigate the ability of the alcohol biomarker phosphatidylethanol (PEth) to identify patients with high levels of alcohol consumption prior to admission.
Methods: The data were prospectively collected at admittance to an acute psychiatric department in the period January 2016 to June 2017. A blood sample for the analysis of PEth was available from 177 patients. We compared the PEth concentrations with the Alcohol Use Disorders Identification Test (AUDIT) scores during the hospital stay, and psychiatric diagnoses at discharge.
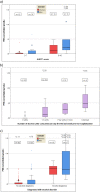
Results: A total of 45.8% of the patients had a PEth concentration ≥ 0.03 μmol/L, indicating significant alcohol consumption. AUDIT scores consistent with unhealthy alcohol use were present in 51.7%. There was a significant positive correlation between PEth concentrations and AUDIT scores (r = 0.631, p < 0.001). PEth was above the detection limit of 0.03 μmol/L in 19% of those reporting an average daily intake of zero alcohol units per day during the last week before admission. PEth concentrations were significantly higher among those with an alcohol diagnosis than among those without such a diagnosis (0.82 μmol/L vs. 0.09 μmol/L, p = 0.001).
Conclusion: PEth provides supplementary information on recent alcohol consumption in a psychiatric population and would be particularly helpful in patients unable or unwilling to give such information at admission.
Keywords: Alcohol use disorder; Mental health; Phosphatidylethanol; Psychiatry.
© 2022. The Author(s).
Conflict of interest statement
The authors declare that they have no competing interests.
Figures


Similar articles
-
Screening for hazardous alcohol use in the Emergency Department: Comparison of phosphatidylethanol with the Alcohol Use Disorders Identification Test and the Timeline Follow-back.Alcohol Clin Exp Res. 2022 Dec;46(12):2225-2235. doi: 10.1111/acer.14958. Epub 2022 Dec 15. Alcohol Clin Exp Res. 2022. PMID: 36520053 Free PMC article.
-
Validating Self-Reported Unhealthy Alcohol Use With Phosphatidylethanol (PEth) Among Patients With HIV.Alcohol Clin Exp Res. 2020 Oct;44(10):2053-2063. doi: 10.1111/acer.14435. Epub 2020 Sep 19. Alcohol Clin Exp Res. 2020. PMID: 33460225 Free PMC article.
-
Comparison of self-reported alcohol use with the alcohol biomarker phosphatidylethanol among young people in northern Tanzania.Drug Alcohol Depend. 2015 Nov 1;156:289-296. doi: 10.1016/j.drugalcdep.2015.09.027. Epub 2015 Oct 1. Drug Alcohol Depend. 2015. PMID: 26455816
-
Phosphatidylethanol in blood (B-PEth): a marker for alcohol use and abuse.Drug Test Anal. 2011 Apr;3(4):195-200. doi: 10.1002/dta.278. Epub 2011 Mar 25. Drug Test Anal. 2011. PMID: 21438164 Review.
-
[Phosphatidylethanol blood analysis].Ann Biol Clin (Paris). 2019 Dec 1;77(6):638-644. doi: 10.1684/abc.2019.1499. Ann Biol Clin (Paris). 2019. PMID: 31859640 Review. French.
Cited by
-
Phosphatidylethanol levels and their association with withdrawal severity among individuals with severe alcohol use disorder seeking inpatient withdrawal management.Front Psychiatry. 2025 Jun 13;16:1567617. doi: 10.3389/fpsyt.2025.1567617. eCollection 2025. Front Psychiatry. 2025. PMID: 40585542 Free PMC article.
-
Prevalence and change in alcohol consumption in older adults over time, assessed with self-report and Phosphatidylethanol 16:0/18:1 -The HUNT Study.PLoS One. 2024 May 31;19(5):e0304714. doi: 10.1371/journal.pone.0304714. eCollection 2024. PLoS One. 2024. PMID: 38820445 Free PMC article.
-
A physiologically-based digital twin for alcohol consumption-predicting real-life drinking responses and long-term plasma PEth.NPJ Digit Med. 2024 May 3;7(1):112. doi: 10.1038/s41746-024-01089-6. NPJ Digit Med. 2024. PMID: 38702474 Free PMC article.
-
Alcohol Use Disorder and Dementia: A Review.Alcohol Res. 2024 May 23;44(1):03. doi: 10.35946/arcr.v44.1.03. eCollection 2024. Alcohol Res. 2024. PMID: 38812709 Free PMC article. Review.
-
Falsely low phosphatidylethanol may be associated with biomarkers of haemolytic disease.Basic Clin Pharmacol Toxicol. 2023 Feb;132(2):223-230. doi: 10.1111/bcpt.13814. Epub 2022 Nov 25. Basic Clin Pharmacol Toxicol. 2023. PMID: 36370095 Free PMC article.
References
Publication types
MeSH terms
Substances
LinkOut - more resources
Full Text Sources
Medical

