. 2022 Apr 21;13(1):2177.
doi: 10.1038/s41467-022-29824-1.

Single-cell transcriptomics identifies Mcl-1 as a target for senolytic therapy in cancer

Affiliations

Single-cell transcriptomics identifies Mcl-1 as a target for senolytic therapy in cancer

Martina Troiani et al. Nat Commun. .

Erratum in

Abstract

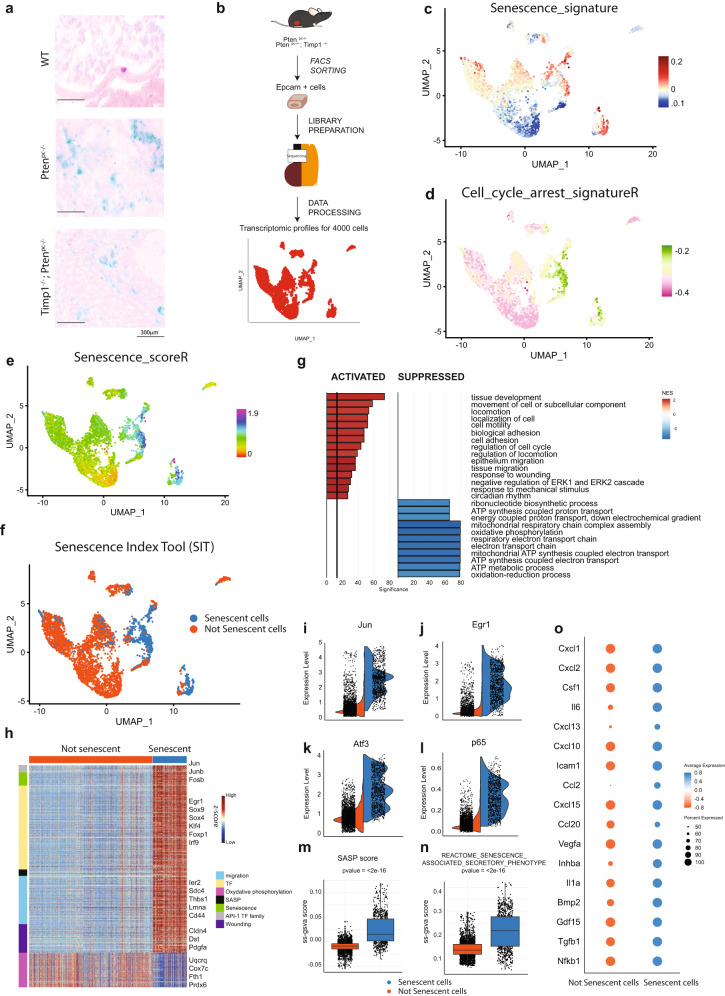
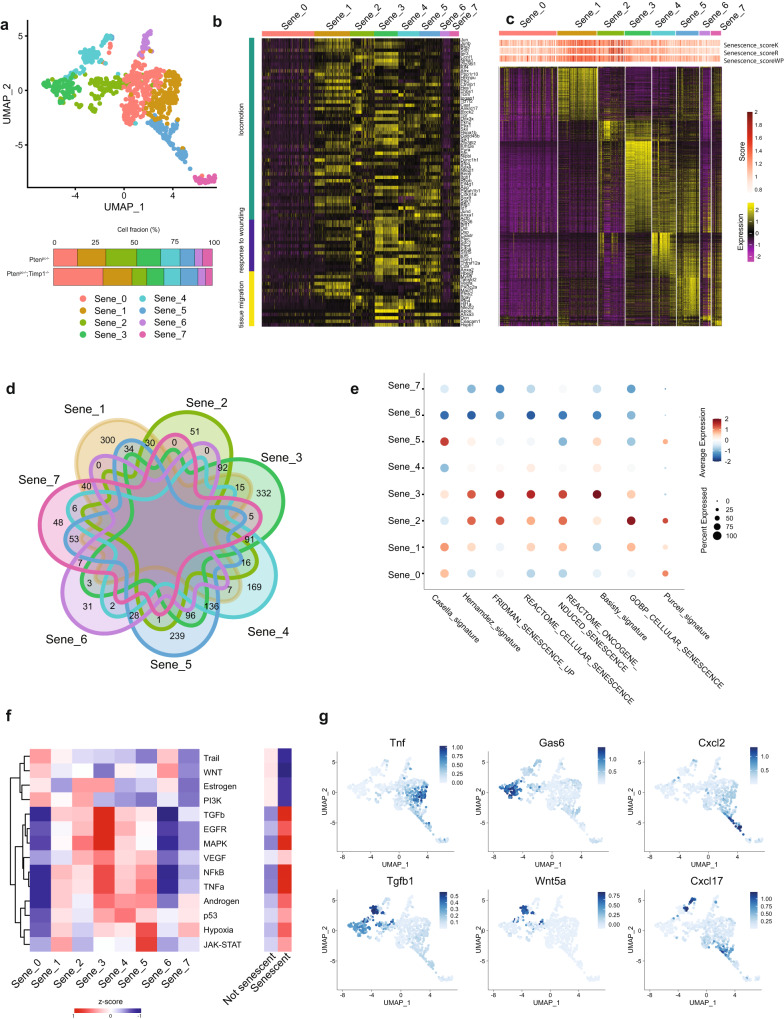
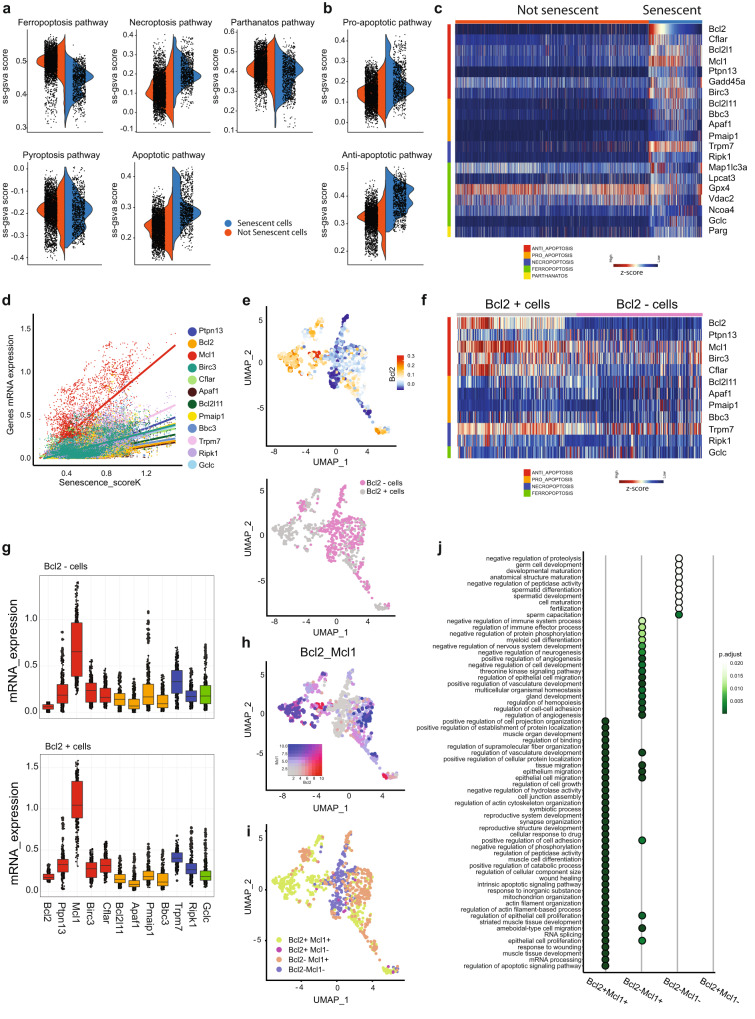
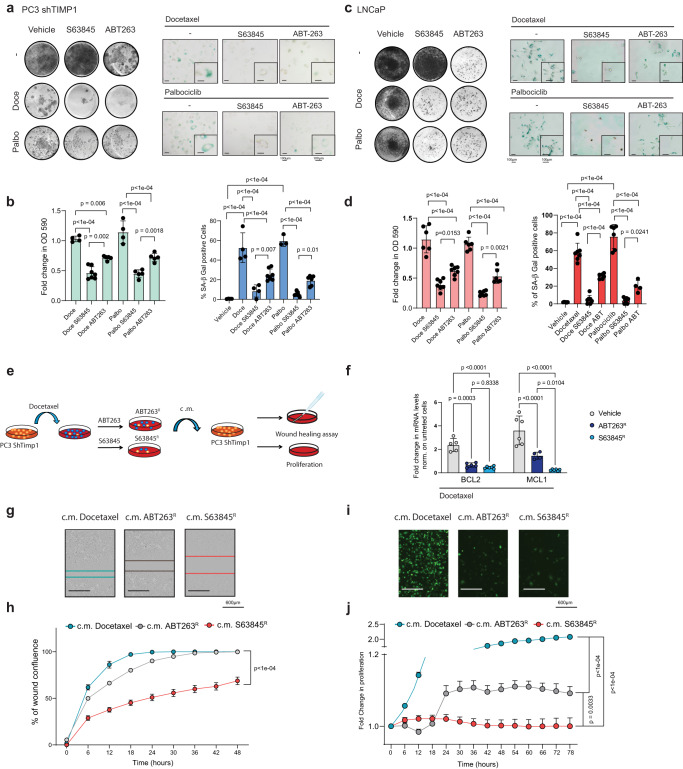
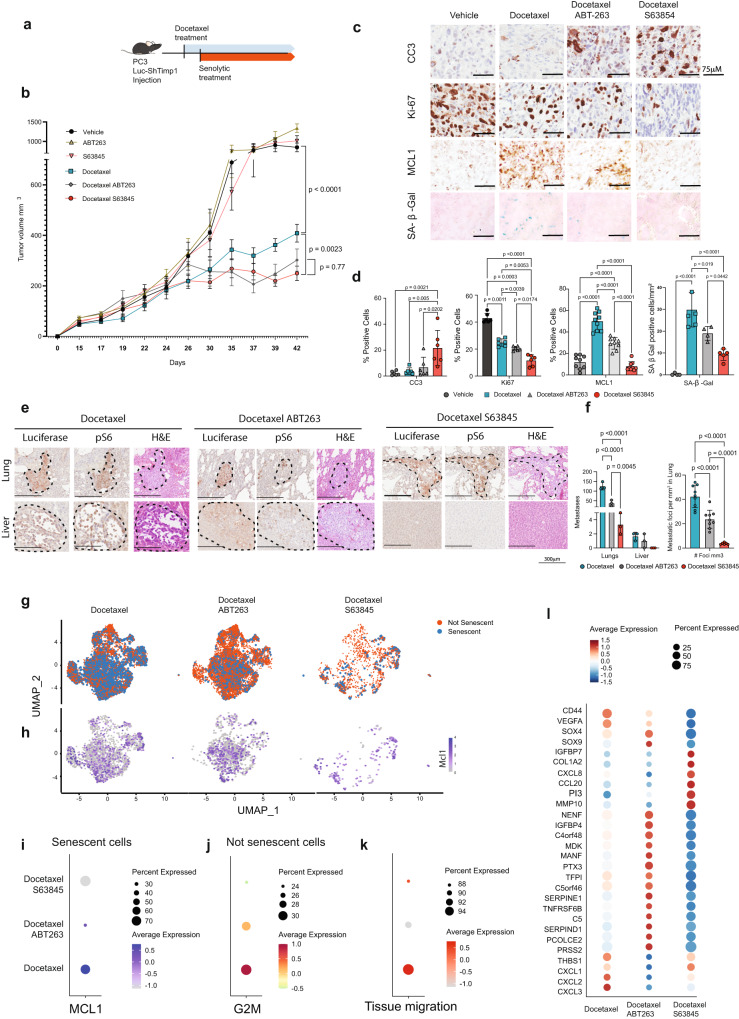
Cells subjected to treatment with anti-cancer therapies can evade apoptosis through cellular senescence. Persistent senescent tumor cells remain metabolically active, possess a secretory phenotype, and can promote tumor proliferation and metastatic dissemination. Removal of senescent tumor cells (senolytic therapy) has therefore emerged as a promising therapeutic strategy. Here, using single-cell RNA-sequencing, we find that senescent tumor cells rely on the anti-apoptotic gene Mcl-1 for their survival. Mcl-1 is upregulated in senescent tumor cells, including cells expressing low levels of Bcl-2, an established target for senolytic therapy. While treatment with the Bcl-2 inhibitor Navitoclax results in the reduction of metastases in tumor bearing mice, treatment with the Mcl-1 inhibitor S63845 leads to complete elimination of senescent tumor cells and metastases. These findings provide insights on the mechanism by which senescent tumor cells survive and reveal a vulnerability that can be exploited for cancer therapy.


Conflict of interest statement

A.A. is a cofounder of and owns stock in OncoSense and A.A., M.C., and A.R. are inventors of the patent WO2019142095A1 (Title: new alk inhibitor senolytic drugs). The remaining authors declare no competing interests.

Figures

Fig. 1
Fig. 1. Overview of the identification of senescent cells in prostate cancer.
a Representative images of SA-β-Gal in WT, Ptenpc−/− and Ptenpc−/−; Timp1−/− genotypes (Scale bar 300 μm). Data are representative of two independent experiments. b Schematic representation of single cells isolation and sequencing (n = 4 mice). c UMAP plot of cancer epithelial cells colored by Senescence_signature. d UMAP plot of cancer epithelial cells colored by Cell_cycle_arrest_signatureR. e UMAP plot of cancer epithelial cells colored by Senescence_scoreR. f UMAP plot of cancer epithelial cells showing senescent cells (blue) and not senescent cells (orange) found through SIT. g Bar plot showing enrichment pathway analysis of senescent cells compared to not senescent cells. gseGO function results: Weighted Kolmogorov Smirnov (WKS) test followed by FDR correction. h Heatmap of differentially expressed genes between senescent and not senescent cells. Row annotation showing the functions of different genes (migration, SASP, wounding, TF). Wilcoxon Rank Sum test followed by FDR correction. i Violin plot of the most upregulated gene in senescent cells: Jun. j, k Violin plot of key transcription factors involved in senescence transcriptional program: Egr1, and Atf3. l Violin plot showing expression of p65/RelA in senescent cells. m Boxplot showing the SASP score of senescent and not senescent cells (two sided Wilcox-test: p value < 2.2e−16; N = 3992 cells, Not senescent cells (left) minimum = −0.0537, lower-quartile = −0.0146, median = −0.0088, upper-quartile = −0.0039, maximum = 0.0408, Senescent cells (right) minimum = −0.0353, lower-quartile = 0.0018, median = 0.0154, upper-quartile = 0.0466, maximum = 0.1172). n Boxplot showing ss-gsva score of published gene set of Reactome collection (senescence_associated_secretory_phenotype) in senescent and not senescent cells (two sided Wilcox-test: p value < 2.2e−16; N = 3992 cells, Not senescent cells (left) minimum = 0.0634, lower-quartile = 0.1183, median = 0.1363, upper-quartile = 0.1607, maximum = 0.2952, Senescent cells (right) minimum = 0.0527, lower-quartile = 0.1527, median = 0.2183, upper-quartile = 0.2768, maximum = 0.4215). o Expression of fundamental SASP genes where dot size and color represent the percentage of cell expressing and the averaged scaled expression value, respectively. Source data are provided as a Source Data file.
Fig. 2
Fig. 2. Senescent cells are a heterogeneous population.
a UMAP view of only senescent cells, colored by clusters found with FindCluster function (res = 0.5) (top) and percentage of clusters in the two genotypes (bottom). b Heatmap showing expression of differentially expressed genes found in total senescent cells related to pathways activated in total senescent cells. c Heatmap showing differentially expressed genes between various senescent clusters (Sene_clusters) using FindAllMarker function. Wilcoxon Rank Sum test followed by FDR correction. d Venn diagrams showing the differentially expressed genes in each Sene_cluster. Overlapping areas indicate the number of genes commonly modulated among subpopulations. The numbers report only unique differentially expressed genes or transcripts common between two clusters. e Dotplot showing ssGSEA of previously published senescence signature (Casella_signature, Hernandez_signature, Fridman_senescence_up, Basisty_signature, Purcell_signature, Cellular senescence from Gene Ontology collection, Oncogene-induced senescence and Cellular senescence gene sets from Reactome collection) in all the senescent clusters. f Heatmap showing pathway activity of 14 relevant signaling pathways calculated using PROGENy between different senescent subpopulations (left) and between senescent and not senescent cells (right). g FeaturePlot showing expression levels of different secreted factors upregulated in specific Sene_clusters and not expressed in the other senescent cells. Source data are provided as a Source Data file.
Fig. 3
Fig. 3. Survival mechanisms of senescent cells.
a Violin plot showing ss-GSVA score activation of different cell death modalities between senescent and not senescent cells. b Violin plot showing ss-GSVA score activation of apoptosis between senescent and not senescent cells, separating in pro and anti-apoptotic genes. c Heatmap of 20 differentially expressed genes of different cell death modalities. FDR < 0.05. d Correlation plot between Senescence_scoreK and survival related-genes with Pearson correlation coefficient higher than 0.4 and FDR < 0.05. e UMAP plot showing Bcl2 expression levels in senescent cells (top) and classification of them in Bcl2+ or Bcl2- (bottom). f Heatmap showing z-score expression levels of 12 survival related-genes, positively correlated with Senescence_scoreK,WP,R, in Bcl2+ and Bcl2- senescent cells. g mRNA expression levels of 12 survival related-genes in Bcl2+ and Bcl2- senescent cells (N = 862 cells, Bcl2 - cells: Bcl2 median = 0.0596; Ptpn13 median = 0.1857; Mcl1 median = 0.654; Birc3 median = 0.234; Cflar median = 0.160; Bcl2l11 median = 0.140; Apaf1 median = 0.068; Pmaip1 median = 0.165; Bbc3 median = 0.091; Trpm7 median = 0.331; Ripk1 median = 0.169; Gclc median = 0.175. Bcl2 + cells: Bcl2 median = 0.169; Ptpn13 median = 0.324; Mcl1 median = 1.045; Birc3 median = 0.274; median = 0.314; Bcl2l11 median = 0.145; Apaf1 median = 0.083; median = 0.178; Bbc3 median = 0.113; Trpm7 median = 0.402; Ripk1 median = 0.261; Gclc median = 0.179). h Co-expression of Bcl2 and Mcl1 in senescent cells. i UMAP plot showing the classification of senescent cells based on Bcl2 and Mcl1 expression levels. j Dotplot showing over-representation results of biological process (GO) pathway analysis by considering senescent cell subclassification. Hypergeometric test followed by FDR correction. Source data are provided as a Source Data file.
Fig. 4
Fig. 4. Mcl-1 targeting as senolytic anti-migratory therapy.
a Representative pictures of crystal violet and SA-β Gal of PC3 shTIMP1 treated cells (Scale bar 100 μm). Data are representative of three independent experiments. b Cristal violet and SA-β Gal quantification (Cristal violet n = 4 for Docetaxel and Palbociclib, n = 5 for Docetaxel ABT263, Palbociclib S63845 and Palbociclib ABT263, n = 7 for Docetaxel S63846; SA-β Gal n = 4 for Vehicle, Docetaxel, Docetaxel S63845, n = 3 for Palbociclib, n = 6 for Palbociclib ABT263 and n = 7 for Docetaxel ABT263 and Palbociclib S63845, n = biological independent samples from three independent experiments). c Representative pictures of crystal violet and SA-β Gal of LNCaP treated cells (Scale bar 100 μm). Data are representative of three independent experiments. d Quantification of crystal violet and SA-β Gal staining (Cristal violet n = 6 for Docetaxel, Palbociclib and Palbociclib ABT263, n = 7 for Docetaxel S63845, Docetaxel ABT263 and Palbociclib S63845; n = biological independent samples, SA-β-Gal n = 6 for Vehicle, Docetaxel ABT263 and Palbociclib, n = 7 for Docetaxel, Docetaxel ABT263 and Palbociclib S63845, n = 4 for Palbociclib ABT263, n = biological independent samples from three independent experiments). e Schematic representation of the experimental design. f RT-qPCR analysis of Docetaxel treated cells and the remaining clones upon ABT263 (ABT263R) and S63845 (S63845R) treatment (for Bcl2 n = 5 for Vehicle and ABT263R, n = 6 for S63845R; for Mcl1 n = 6 for Vehicle and S63845R and n = 4 for ABT263R, n = biological independent samples from three experiments). The p values were determined by one way ANOVA followed by Tukey’s multiple comparison test. g Representative pictures of wound healing assay (Scale bar 600 μm). Data are representative of two independent experiments. h Percentage of wound confluence over time normalized to time 0 (for c.m. Docetaxel and c.m. ABT263R n = 8, for c.m. S63845R n = 6, n = biological independent samples from two independent experiments). i Representative pictures of proliferation assay (Scale bar 600 μm). Data are representative of two independent experiments. j Fold change in proliferation normalized to time 0 (for c.m. Docetaxel, c.m. ABT263R and c.m. S63845R n = 6, n = biological independent samples from two independent experiments). b, d, h, j The p values were determined by one way ANOVA followed by Tukey’s multiple comparison test. The whole Anova results were given in the Supplementary Data 4. b, d, f Data are represented as mean ± SD. h, j Data are represented as mean ± SEM. Source data are provided as a Source Data file.
Fig. 5
Fig. 5. S63845 is an efficient senolytic therapy in vivo.
a Schematic representation of the experimental design. b Growth curve of tumors in vivo in mm3 (n = 5 for Untreated, ABT263, S63845, Docetaxel, Docetaxel + ABT263, Docetaxel + S63845, n = independent animals from one experiment). The p values were determined by two-way ANOVA followed by Tukey’s multiple comparison test at time point 39 days post injection, separately for single treatment (Untreated, Docetaxel, ABT263, S63845) and Docetaxel treated groups (Docetaxel, Docetaxel + ABT263, Docetaxel + S63845). Data are represented as mean ± SEM. c Representative pictures of immunohistochemistry for Cleaved Caspase 3 (CC3), Ki67, MCL-1 and SA-β Gal. Data are representative of one experiment. d From left, quantification in percentage (CC3 n = 6, Ki67 n = 6, MCL-1 n = 9 and SA-β Gal n= 6; n = multiple areas of four animals from one experiment. The p values were determined by One-way ANOVA test followed by Tukey’s multiple comparisons test). Data are represented as mean ± SD. e H&E, Luciferase and phospho-S6 immunohistochemical staining in lung and liver metastases in Docetaxel, Docetaxel + ABT263 and Docetaxel + S63845 treated NRG mice. Data are representative of one experiment. f Bar graph representing metastases quantification (n = 9 for Docetaxel and Docetaxel ABT263, n = 6 for Docetaxel S63845; = multiple areas of 4 animals from one experiment). For metastases count the p values were determined by Two-way ANOVA followed by Šídák’s multiple comparisons, while for the count of metastases foci per mm3, the p values were determined by one Way ANOVA followed by Tukey’s multiple comparisons test. Data are represented as mean ± SD g UMAP plot of senescent and not senescent cells, defining using SIT, in xenograft PC3 shTIMP1 cells treated with Docetaxel alone or in combination with ABT263 or S63845 (Docetaxel % senescent cells = 35.5%, Docetaxel + ABT263 % senescent cells = 15.6%, Docetaxel + S63845 % senescent cells = 14%). h UMAP plot of senescent cells showing MCL-1 expression in xenograft PC3 shTIMP1 cells treated with Docetaxel alone or in combination with ABT263 or S63845. i MCL-1 expression for each treatment, where dot size and color represent the percentage of cells expressing the indicated gene and the average scaled expression value, respectively. j G2M signature for each treatment, where dot size and color represent percentage of cells expressing and the averaged scaled expression value, respectively. k ss-GSVA of tissue migration signature for each treatment, where dot size and color represent percentage of cell expressing and the averaged scaled expression value, respectively. l Marker genes expressions for each treatment, where dot size and color represent percentage of cell expressing and the average scaled expression value, respectively. Source data are provided as a Source Data file. The whole Anova results were given in the Supplementary Data 4.

References

    1. Hernandez-Segura A, Nehme J, Demaria M. Hallmarks of Cellular Senescence. Trends Cell Biol. 2018;28:436–453. - PubMed
    1. Calcinotto A, et al. Cellular senescence: aging, cancer, and injury. Physiol. Rev. 2019;99:1047–1078. - PubMed
    1. Scudellari M. To stay young, kill zombie cells. Nature. 2017;550:448–450. - PubMed
    1. Muñoz-Espín D, Serrano M. Cellular senescence: from physiology to pathology. Nat. Rev. Mol. Cell Biol. 2014;15:482–496. - PubMed
    1. Coppé J-P, Desprez P-Y, Krtolica A, Campisi J. The senescence-associated secretory phenotype: the dark side of tumor suppression. Ann. Rev. Pathol.: Mech. Dis. 2010;5:99–118. - PMC - PubMed

Publication types

MeSH terms

Substances