. 2022 Apr 21;13(1):2187.
doi: 10.1038/s41467-022-29846-9.

USP22 regulates lipidome accumulation by stabilizing PPARγ in hepatocellular carcinoma

Affiliations

USP22 regulates lipidome accumulation by stabilizing PPARγ in hepatocellular carcinoma

Zhen Ning et al. Nat Commun. .

Abstract

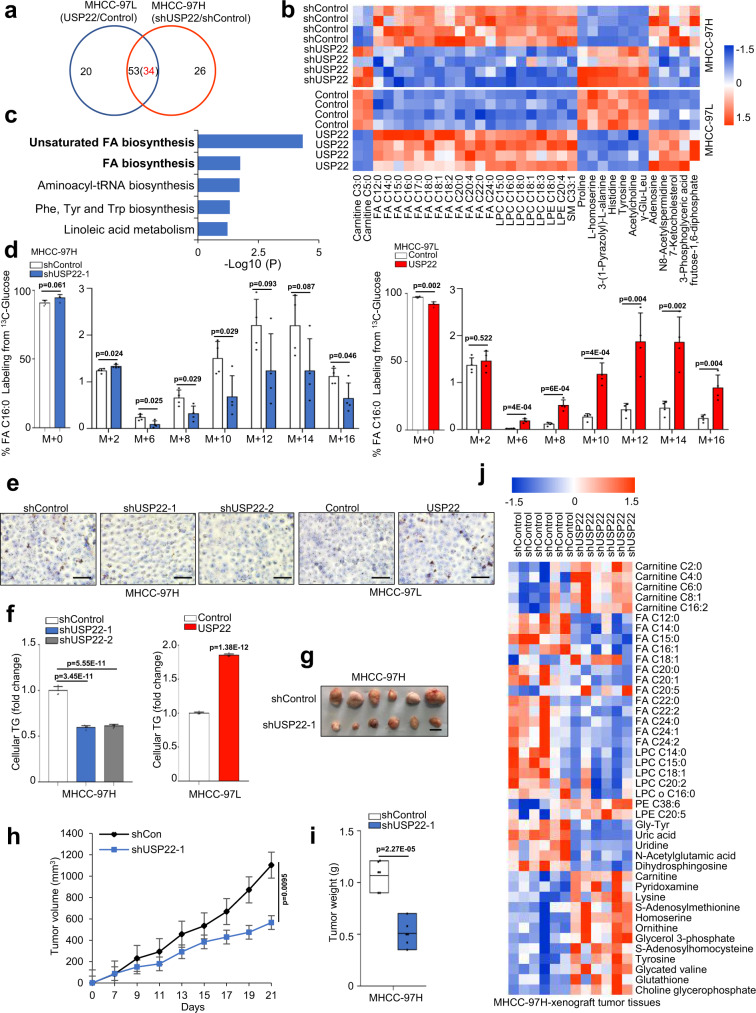
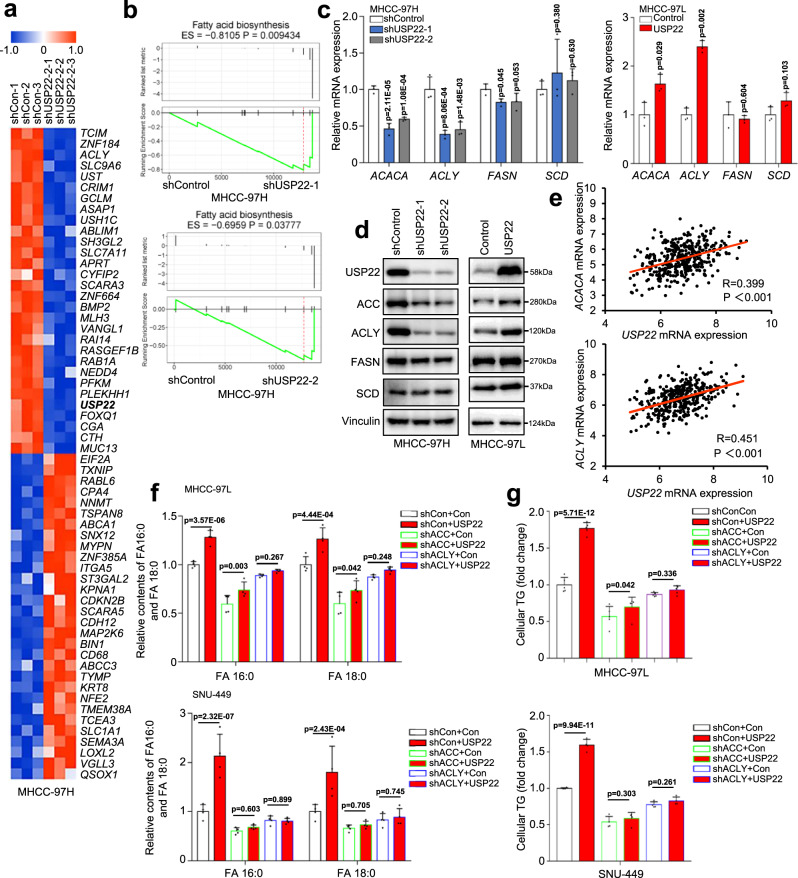
Elevated de novo lipogenesis is considered to be a crucial factor in hepatocellular carcinoma (HCC) development. Herein, we identify ubiquitin-specific protease 22 (USP22) as a key regulator for de novo fatty acid synthesis, which directly interacts with deubiquitinates and stabilizes peroxisome proliferator-activated receptor gamma (PPARγ) through K48-linked deubiquitination, and in turn, this stabilization increases acetyl-CoA carboxylase (ACC) and ATP citrate lyase (ACLY) expressions. In addition, we find that USP22 promotes de novo fatty acid synthesis and contributes to HCC tumorigenesis, however, this tumorigenicity is suppressed by inhibiting the expression of PPARγ, ACLY, or ACC in in vivo tumorigenesis experiments. In HCC, high expression of USP22 positively correlates with PPARγ, ACLY or ACC expression, and associates with a poor prognosis. Taken together, we identify a USP22-regulated lipogenesis mechanism that involves the PPARγ-ACLY/ACC axis in HCC tumorigenesis and provide a rationale for therapeutic targeting of lipogenesis via USP22 inhibition.


Conflict of interest statement

The authors declare no competing interests.

Figures

Fig. 1
Fig. 1. Abnormal lipid metabolism in human HCC with high USP22 expression.
a LC-MS–based nontargeted metabolomic analysis detecting differential metabolites between the tumor tissues and adjacent normal tissues (More than 2 cm from the edge of the tumor) of patients with HCC (n = 10, 6 female and 4 male patients, the age range is between 48 and 60). All patients were diagnosed with HCC by postoperative pathology and were free of other cancers and chronic diseases. b Volcano plots of metabolites in HCC and normal adjacent tissue. Red represents lipids and lipid-like molecules (n = 22). LC-MS-based nontargeted metabolomic analysis, and the data were corrected by total peak area. c, Heatmap analysis of significantly changed metabolites (n = 47) in cancer tissues (Ca) compared to paired normal adjacent tissue (NT). p < 0.05, paired two-sample Wilcoxon test. Red indicates increase, and blue indicates decrease. -1.5~1.5 indicates the Fold Change. d Enriched metabolic signaling pathways based on significantly changed metabolites (n = 47) cluster identified by pathway analysis (https://www.metaboanalyst.ca/). e Heatmap analysis of the fold change (Ca/NT) of USPs (which are related to the prognosis of HCC based on the TCGA HCC database) protein expression in the above cancer tissues and normal adjacent tissues in Supplementary Fig. 1b. Image j was used for quantification of western blot. Red indicates increase, and blue indicates decrease. f Western blotting of USP22 in ten pairs of matched adjacent non-tumor (NT) and cancer (Ca) tissues (n = 10). g Correlation analysis of USPs protein expression and lipid metabolite content (sum: Carnitine, FA, LPC, PC, LPE, PE and SM) in cancer tissues. R represents the Pearson correlation coefficient. Source data are provided in the Source Data file.
Fig. 2
Fig. 2. USP22 promotes lipid accumulation and tumorigenesis in HCC cells.
a Venn diagram of the overlap between USP22-knockdown (shUSP22-1 vs shControl) and USP22-overexpression (USP22 vs Control)-induced differential metabolites (The heat map of differential metabolites is shown in Supplementary Fig. 3d and 3e, p < 0.05, unpaired two-tailed Student’s t-test). The red number 34 refers to the number of metabolites with the opposite trend. LC-MS-based nontargeted metabolomic analysis, and the data were corrected by total peak area. b Heatmap analysis of these 34 significantly changed metabolites. p < 0.05, unpaired two-tailed Student’s t-test. Red indicates increase, and blue indicates decrease. -1.5~1.5 indicates the Fold Change. c Enriched signaling pathways identified by pathway analysis based on these 34 differential metabolites. (https://www.metaboanalyst.ca/). d The percentages of various isotopomers of FA 16:0 (palmitate) after trace to [U-13C] glucose in MHCC-97H-shUSP22-1-and MHCC-97L-USP22cells. Medium was changed to RPMI 1640 containing [U-13C] glucose (2 g/L) when the cell density was about 80%, and 24 h later cell culture plates were washed with PBS and snap-frozen in liquid nitrogen and subjected to LC-MS analysis. unpaired two-tailed Student’s t-test. The data shown represent the means (±SD) of biological replicates. The experiments were repeated four times (n = 4). e Representative images of Oil red staining assay in MHCC-97H-shUSP22-1/2 cells and MHCC-97L-USP22 cells. Cells were analyzed after 24 h adherence. Scale bars, 50 μm. f Relative content of TG was analyzed in MHCC-97H-shUSP22-1/2 cells and MHCC-97L-USP22 cells. Cells were analyzed after 24 h adherence. The data shown represent the means (±SD) of biological replicates. The experiments were repeated five times (n = 5). One-way ANOVA test. gi MHCC-97H-shUSP22-1 or shControl cells were injected into the right flank of nude mice. Tumor volumes were measured every 3 days. Tumor images (g), growth curves (h) and weight (i) were obtained at day 21 after dissection. Data in h are presented as mean values ± SD and data in i are presented as mean values with minima and maxima. unpaired two-tailed Student’s t-test. Scale bars, 1 cm. n = 6 biologically independent tumor samples. j Heatmap analysis of significantly changed metabolites in MHCC-97H-shUSP22-1 cells-derived tumors compared to shControl cells-derived tumors based on nontargeted metabolomic analysis. Data were standardized by total peak area. p < 0.05, unpaired two-tailed Student’s t-test. Source data are provided in the Source Data file.
Fig. 3
Fig. 3. USP22 upregulates ACC and ACLY expression.
a Heatmap depicting the top 30 downregulated and upregulated genes in MHCC-97H cells transduced with USP22 shRNA (Q < 0.05). Red and blue represent the Log2 fold change of an increase or decrease in mRNA expression compared to the control group, respectively. b Gene set enrichment analysis (GSEA) of fatty acid biosynthesis gene sets in the expression profiles of MHCC-97H cells transduced with two independent USP22 shRNAs. c, d qRT-PCR (c) and western blot (d) analysis of ACACA, ACLY, FASN and SCD, in MHCC-97H-shUSP22-1/2 cells and MHCC-97L-USP22 cells. The data shown represent the means (±SD) of biological triplicates (n = 3). One-way ANOVA test. e Correlation analysis between USP22 and ACACA, ACLY based on the TCGA LIHC database. R represents the Pearson correlation coefficient. f Relative contents of FA 16:0 and FA 18:0 were analyzed in MHCC-97L and SNU449 cells transduced with USP22 alone or in combination with ACC or ACLY shRNA. Cells were analyzed by LC-MS after 24 h adherence. One-way ANOVA test. The data shown represent the means (±SD) of biological replicates. The experiments were repeated four times (n = 4). g Relative content of TG was analyzed in the above cell lines from f. Cells were analyzed after 24 h adherence. The data shown represent the means (±SD) of biological triplicates. One-way ANOVA test. The data shown represent the means (±SD) of biological replicates. The experiments were repeated five times (n = 5). Source data are provided in the Source Data file.
Fig. 4
Fig. 4. USP22 specifically interacts with lipid metabolism key transcription factor of PPARγ.
a Tandem affinity purification–mass spectrometry detection of USP22-interacting proteins (obtained from S-beads pulldown) after HEK293T cells were transfected with SFB-USP22 for 24 h. b Cell lysates of MHCC-97H cells were immunoprecipitated with IgG or USP22 antibodies, and immunoblot assays were performed using USP22, PPARγ, PPARα, PPARδ and SREBF1 antibodies. c Cell lysates of MHCC-97L, HUH7, HepG2, SNU-449, and Bel-7402 cells were immunoprecipitated with IgG or USP22 antibodies, and immunoblot assays were performed using USP22 or PPARγ antibodies. d GST pulldown assay with purified His-USP22 and GST-PPARγ. PD Pulldown. e HEK293T cells were transfected for 24 h with plasmids encoding either Flag-PPARγ or Myc-USP22 alone or in combination. Cell lysates were immunoprecipitated with Flag and Myc antibodies, and immunoblotting was performed using Myc or Flag antibodies. f Triple immunoflorescence (IF) staining for USP22 (red), PPARγ (green), and nuclei (DAPI, blue) was performed in MHCC-97L and MHCC-97H cells. Scale bars, 10 μm. g Plasmids containing FL (full length), AF-1, DBD, Hinge-LBD domain of PPARγ were co-expressed with SFB-USP22 in 293 T cells. Lysates were immunoprecipitated with S-beads. h GSEA of signaling pathway with USP22-correlated genes based on TCGA LIHC database. All experiments were performed independently at least three times.
Fig. 5
Fig. 5. USP22 deubiquitinates and stabilizes PPARγ.
a, b Ubiquitination assay of PPARγ in MHCC-97H-shUSP22-1/2 cells (a) or MHCC-97L-USP22, MHCC-97L-USP22 C185S cells (b) treated for 6 h with 10 μM MG132. c In vitro deubiquitination assay of ubiquitinated PPARγ protein with purified His-USP22. d Ubiquitination assay of PPARγ in HEK293T cells cotransfected with HA-Ub, Flag-PPARγ, Flag-PPARγ-K404/434 R, Myc-USP22 or V5-pVHL and treated with 10 μM MG132 for 6 h. e Ubiquitination assay of PPARγ in HEK293T cells cotransfected with HA-Ub, Flag-PPARγ, Flag-PPARγ-K240/265 R, Myc-USP22 or V5-CUL4B and treated with 10 μM MG132 for 6 h. f Ubiquitination assay of FL (full length), AD (AF-1-DBD), DH (DBD-Hinge), D (DBD), DHL (DBD-Hinge-LBD) and HL (Hinge-LBD) domains of PPARγ in HEK293T cells cotransfected with HA-Ub and Myc-USP22, and treated with 10 μM MG132 for 6 h. g Ubiquitination assay of DBD domain of PPARγ in HEK293T cells cotransfected with HA-Ub, Myc-USP22, Flag-DBD, Flag-DBD-K117R, Flag-DBD-K132R, Flag-DBD-K142R, Flag-DBD-K161R and Flag-DBD-K169R and treated with 10 μM MG132 for 6 h. h Ubiquitination assay of PPARγ in HEK293T cells cotransfected with HA-Ub, Myc-USP22, and SF-PPARγ-5KR (K169/240/265/404/434 R) and treated with 10 μM MG132 for 6 h. i, j Stability analysis of PPARγ protein in MHCC-97H-shUSP22-1/2 cells (i), MHCC-97L-USP22, MHCC-97L-USP22 C185S cells (j) and treated with 40 μM cycloheximide (CHX) for indicated times. Right panels are quantification of PPARγ protein levels. Data are presented as mean values ± SD. One-way ANOVA test. n = 3 independent experiments. Source data are provided in the Source Data file. All experiments were performed independently at least three times.
Fig. 6
Fig. 6. USP22 increases ACC and ACLY expression by stabilizing PPARγ.
a Western blot analysis of USP22 and PPARγ in cytoplasmic and nucleus fractions of MHCC-97H-shUSP22-1/2 cells and MHCC-97L-USP22 cells. LaminB1 and GAPDH were used as nucleus and cytoplasmic markers, respectively. b DNA binding activity of PPARγ in MHCC-97H-shUSP22-1/2 cells and MHCC-97L-USP22 cells. The analysis was performed by PPAR gamma Transcription Factor Assay Kit (ab133101, Abcam, USA). The data shown represent the means (±SD) of biological replicates. One-way ANOVA test. The experiments were repeated five time (n = 5). c Illustration of PPRE site in ACLY promoter and the predicted PPRE site in ACACA promoter. The PPRE motif from ACACA promoter was predicted by web site: https://epd.epfl.ch/index.php. d Chromatin immunoprecipitation (ChIP) analysis of PPARγ binding to the ACLY and ACACA promoters in MHCC-97H-shUSP22-1/2 cells. qPCR was performed with primers specific to the PPARγ-binding motifs. Data were normalized to the input. The data shown represent the means (±SD) of biological triplicates (n = 3). One-way ANOVA test. e, f qRT-PCR (e) and western blot analysis (f) of ACC and ACLY expression in MHCC-97H cells transduced with USP22 shRNA or in combination with PPARγ, and in MHCC-97L cells transduced with USP22 or in combination with PPARγ shRNA. The data shown represent the means (±SD) of biological triplicates (n = 3). One-way ANOVA test. g Representative IHC staining of USP22, PPARγ, ACC, and ACLY in HCC tissue microarrays (LV1021, no prognosis information, Shanxi ChaoYing Biotechnology Company). Scale bars, 50 μm. h Correlation analysis between USP22 and PPARγ, ACC, ACLY protein expression based on H-Score in HCC tissue microarrays (LV1021). R represents Pearson correlation coefficient. i The tissue microarray (LV1021) was stained with HE stain, and the steatosis was interpreted by the pathologist. Two-sided Chi-square test was performed to analyze the correlation between USP22, PPARγ, ACC, ACLY protein expression and steatosis. Source data are provided in the Source Data file.
Fig. 7
Fig. 7. USP22-driven de novo synthesis participates in HCC tumorigenesis through ACC and ACLY upregulation by PPARγ.
a, b The percentages of various isotopomers of FA 16:0 after trace to [U-13C] glucose in MHCC-97L-related stable cells (Control, USP22, USP22 + shACC and USP22 + shPPARγ) (a) and MHCC-97H-related stable cells (shControl, shUSP22-1 and shUSP22-1+PPARγ) (b). Medium was changed to RPMI 1640 containing [U-13C] glucose (2 g/L) when cell confluence reached 80%, and 24 h later cells were washed with cold PBS and snap-frozen in liquid nitrogen and subjected to LC-MS analysis. n = 4 biologically independent experiments. c, d The relative content of TG was analyzed in above cell lines from a (c) and b (d). The data shown represent the means (±SD) of biological triplicates. Cells were analyzed after 24 h adherence. n = 4 (c) or n = 5 (d) biologically independent experiments. e, f Oil red staining assay in above cell lines from a (e) and b (f). Cells were analyzed after 24 h adherence. Scale bars, 100 μm. gi MHCC-97L-related stable cells (Control, USP22, USP22 + shACC, USP22 + shACLY and USP22 + shPPARγ) were injected into the right flanks of null mice. Tumor volumes were measured every 3 days. Tumor images (g), growth curves (h) and weight (i) were obtained at day 21 after dissection. In h and i, n = 8 biologically independent tumor samples for Control and USP22 groups, n = 6 for USP22 + shPPARγ group, n = 5 for USP22 + shACLY group and n = 7 for USP22 + shACLY group. jl MHCC-97H-related stable cells (shControl, shUSP22-1 and shUSP22-1-PPARγ) were injected into the right flanks of null mice. Tumor volumes were measured every 3 days. Tumor images (j), growth curves (k) and weight (l) were obtained at day 21 after dissection. n = 8 biologically independent tumor samples in k and l. m Representative IHC staining of USP22, PPARγ, ACC, and ACLY in xenograft tissues described in (g). Scale bars, 50 μm. n Representative IHC staining of USP22, PPARγ, ACC, and ACLY in xenograft tissues described in (j). Scale bars, 50 μm. Data in ad, h, k are presented as mean values ± SD and data in i and l are presented as mean values with minima and maxima. One-way ANOVA test. Source data are provided in the Source Data file.
Fig. 8
Fig. 8. The USP22–PPARγ/ACC/ACLY axis contributed to HCC prognosis.
a Representative IHC staining of USP22, PPARγ, ACC, and ACLY in HCC TMAs (HLivH180Su11, contains prognosis information, Shanghai Outdo Biotech Company). Scale bars, 50 μm. b Correlation analysis between USP22 and PPARγ, ACC, ACLY protein expression based on H-Score in HCC TMAs (HLivH180Su11). R represents the Pearson correlation coefficient. c Kaplan–Meier curves of the survival analysis of USP22-positive, PPARγ-positive, USP22& PPARγ copositive, and USP22&ACC&ACLY copositive patients based on HCC TMAs prognosis data (HLivH180Su11). d Kaplan–Meier curves of the survival analysis of USP22-positive, PPARG-positive, USP22&PPARG copositive, and USP22&ACACA&ACLY copositive patients based on the prognosis data of TCGA LIHC database. e Diagram of the proposed mechanism. Source data are provided in the Source Data file.

References

    1. Anstee QM, Reeves HL, Kotsiliti E, Govaere O, Heikenwalder M. From NASH to HCC: Current concepts and future challenges. Nat. Rev. Gastroenterol. Hepatol. 2019;16:411–428. doi: 10.1038/s41575-019-0145-7. - DOI - PubMed
    1. Pang Y, et al. Diabetes, plasma glucose, and incidence of fatty liver, cirrhosis, and liver cancer: A prospective study of 0.5 million people. Hepatology. 2018;68:1308–1318. doi: 10.1002/hep.30083. - DOI - PMC - PubMed
    1. Baffy G, Brunt EM, Caldwell SH. Hepatocellular carcinoma in non-alcoholic fatty liver disease: An emerging menace. J. Hepatol. 2012;56:1384–1391. doi: 10.1016/j.jhep.2011.10.027. - DOI - PubMed
    1. Zucman-Rossi J, Villanueva A, Nault J-C, Llovet JM. Genetic landscape and biomarkers of hepatocellular carcinoma. Gastroenterology. 2015;149:1226–1239.e1224. doi: 10.1053/j.gastro.2015.05.061. - DOI - PubMed
    1. Donnelly KL, et al. Sources of fatty acids stored in liver and secreted via lipoproteins in patients with nonalcoholic fatty liver disease. J. Clin. Investig. 2005;115:1343–1351. doi: 10.1172/JCI23621. - DOI - PMC - PubMed

Publication types