. 2022 Apr 21;13(1):2185.
doi: 10.1038/s41467-022-29902-4.

CMYA5 establishes cardiac dyad architecture and positioning

Affiliations

CMYA5 establishes cardiac dyad architecture and positioning

Fujian Lu et al. Nat Commun. .

Abstract

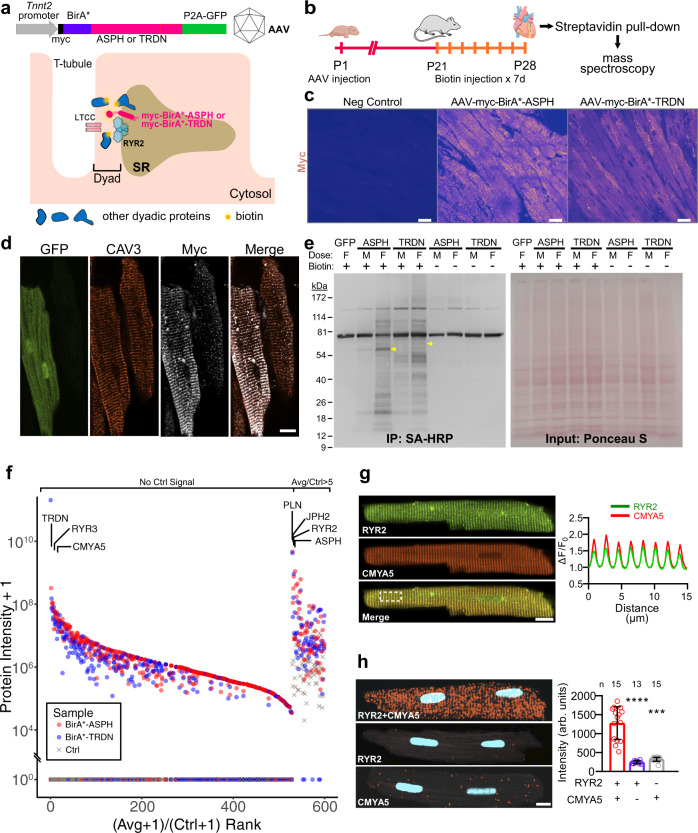
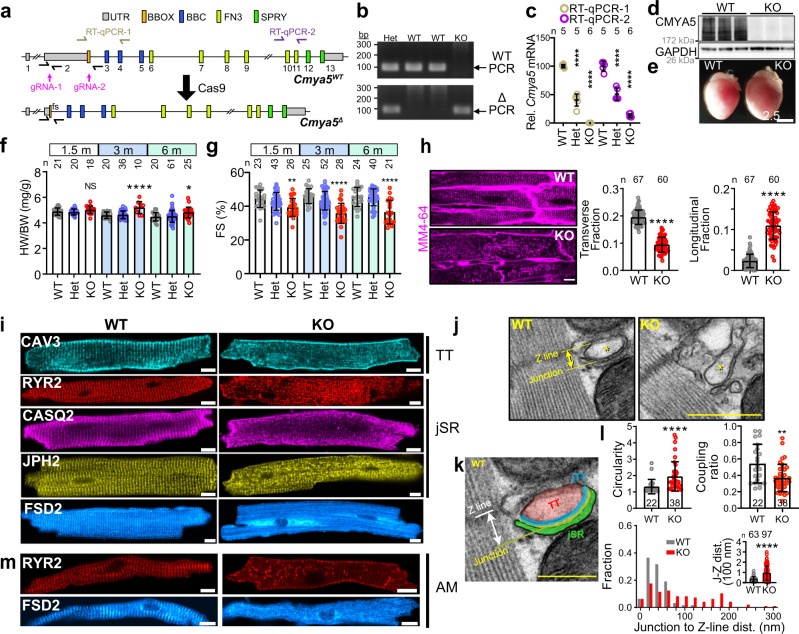
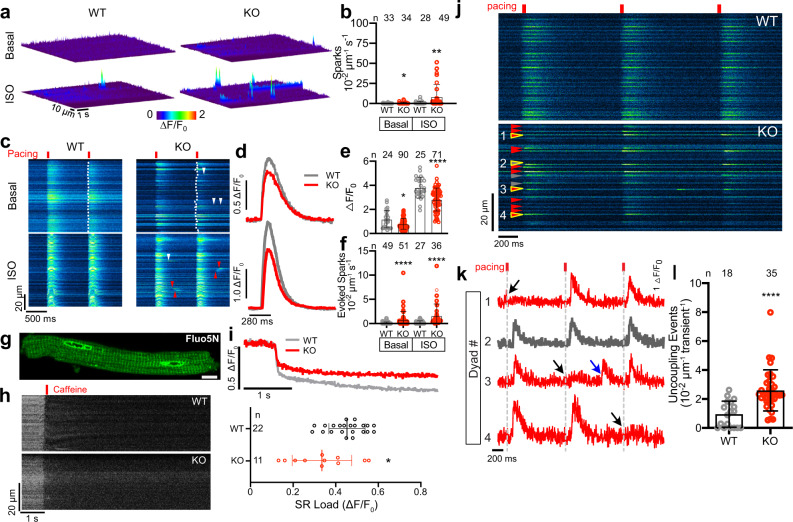
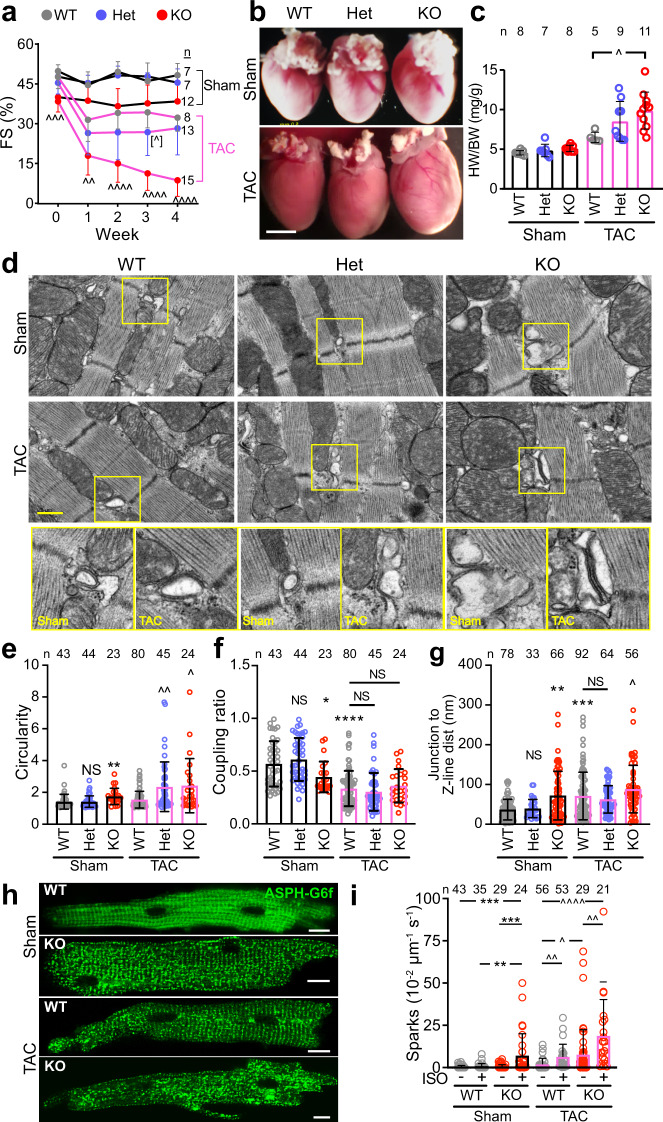
Cardiac excitation-contraction coupling requires dyads, the nanoscopic microdomains formed adjacent to Z-lines by apposition of transverse tubules and junctional sarcoplasmic reticulum. Disruption of dyad architecture and function are common features of diseased cardiomyocytes. However, little is known about the mechanisms that modulate dyad organization during cardiac development, homeostasis, and disease. Here, we use proximity proteomics in intact, living hearts to identify proteins enriched near dyads. Among these proteins is CMYA5, an under-studied striated muscle protein that co-localizes with Z-lines, junctional sarcoplasmic reticulum proteins, and transverse tubules in mature cardiomyocytes. During cardiac development, CMYA5 positioning adjacent to Z-lines precedes junctional sarcoplasmic reticulum positioning or transverse tubule formation. CMYA5 ablation disrupts dyad architecture, dyad positioning at Z-lines, and junctional sarcoplasmic reticulum Ca2+ release, leading to cardiac dysfunction and inability to tolerate pressure overload. These data provide mechanistic insights into cardiomyopathy pathogenesis by demonstrating that CMYA5 anchors junctional sarcoplasmic reticulum to Z-lines, establishes dyad architecture, and regulates dyad Ca2+ release.


Conflict of interest statement

The authors declare no competing interests.

Figures

Fig. 1
Fig. 1. BioID identification of dyadic proteins.
a Proximity proteomics strategy. BirA* and myc epitopes were fused to ASPH and TRDN, which interact with RYR2 in jSR of dyads. N-terminal fusion positions BirA* in the dyadic cleft. The fusion protein was expressed in vivo in cardiomyocytes using AAV9 and the cardiomyocyte-selective troponin T (Tnnt2) promoter. GFP was co-expressed using a P2A sequence. b Experimental timeline. Artwork from biorender.com. c Expression of BirA* dyadic biosensors in myocardium. Heart sections were stained for the myc epitope tag. Most cardiomyocytes were immunoreactive. Bar = 20 µm. Representative of 3 independent experiments. d Mature ventricular cardiomyocytes. In the left GFP + cell, myc immunoreactive signal co-localized with CAV3, a T-tubule marker. Bar = 10 µm. Representative of three independent experiments. e Protein lysates from mice expressing the indicated BirA*-fused biosensors or GFPs were analyzed by western blotting. AAV dose and treatment with exogenous biotin are indicated. M, middle dose (2 × 1010 vg/g). F, full dose (5.5 × 1010 vg/g). Ponceau S, total protein. SA-HRP labeled biotinylated proteins. Representative of two independent experiments. f Summary of mass spectrometry data. Red and blue symbols indicate protein signals from BirA* biosensors. Gray symbols show control (AAV-GFP) signals. One replicate pooled from three hearts was performed for each sensor and for control. Proteins were ranked by the ratio of the average signal of the two different BirA* biosensors to the control signal. Proteins lacking control signal grouped to the left. Only proteins with average/control ratio >5 are shown. g Co-localization of CMYA5 and jSR marker RYR2. Immunostained adult cardiomyocytes were imaged with a confocal microscope. Spatial profiles to the right demonstrate co-localization in a striated pattern with 2 µm spacing. Bar = 10 µm. h Proximity ligation assay. Punctate red signal, indicating close proximity of RYR2 and CMYA5, was observed when both RYR2 and CMYA5 antibodies were included, but not with either in isolation. Signal intensity is quantified at the right. n, number of cardiomyocytes. Two-sided Kruskal–Wallis with Dunn’s multiple comparison test vs. RYR2 + CMYA5: ***, P < 0.001; ****, P < 0.0001. Data are presented as mean ± SD. Bar = 10 µm.
Fig. 2
Fig. 2. Characterization of hearts lacking CMYA5.
a Genomic structure of Cmya5 wild-type and Δ alleles. Cas9-mediated deletion of 9281 bp of exon 2 causes a frameshift (fs) after the 55th amino acid residue. qRTPCR and genotyping amplicons are indicated. b PCR genotyping using WT (1 + 2) and Δ (1 + 3) primers. Representative of five independent experiments. c Cmya5 cardiac mRNA levels. RT-qPCR amplicon 1 and 2 represent the deleted region and the 3’ end of the transcript, respectively. ANOVA with Dunnett’s multiple comparison test vs. WT of the same amplicon. n, number of hearts. Data are presented as mean ± SD. d Cardiac protein lysates were analyzed by western blotting. KO samples lacked CMYA5 immunoreactivity. Representative of five independent experiments. e Gross morphology of WT and KO hearts. Bar = 2.5 mm. Representative of three independent experiments. f Heart weight normalized to body weight, at the indicated ages. ANOVA with Dunnett’s multiple comparison test vs. WT at the same time point. n, number of hearts. g Echocardiographic measurement of systolic heart function. FS fractional shortening. n, sample size. Kruskal–Wallis with Dunn’s multiple comparison test vs. WT at the same time point. h In situ T-tubule imaging. After plasma membrane labeling by MM4-64. 3-month-old hearts were optically sectioned using a confocal microscope. Right, transverse, and longitudinal T-tubule fractions. Mann–Whitney. Bar = 10 µm. n, number of cells. i Isolated ventricular WT or KO cardiomyocytes immunostained for T-tubule (TT: CAV3) and jSR (RYR2, CASQ2, JPH2) markers, as well as FSD2. Bar = 10 μm. jl Transmission electron microscopy of WT or KO ventricular myocardium. *, T-tubule. The WT T-tubule micrograph is enlarged and labeled in k. l Quantification of T-tubule parameters, defined in Supplementary Fig. 4a. n, number of dyads from at least 10 cardiomyocytes from 3 different mice. Mann–Whitney. Bar = 500 nm. m Isolated WT or KO atrial cardiomyocytes immunostained for RYR2 or FSD2. NS, not significant; *, P < 0.05; **, P < 0.01; ***, P < 0.001; ****, P < 0.0001. Statistical tests were two-sided. Data are presented as mean ± SD.
Fig. 3
Fig. 3. CMYA5 positions jSR adjacent to Z-lines.
a P7 ventricular cardiomyocyte co-immunostained for CMYA5 and RYR2. Bar, 10 µm. Bottom, spatial profile plot demonstrates co-localization of CMYA5 and RYR2 in a striated pattern. b Localization of FSD2 in P7 ventricular cardiomyocytes. FSD2 adopted a striated pattern. Bar, 10 µm. Representative of two independent experiments. c jSR (RYR2) and T-tubule (CAV3) organization in WT and KO P7 ventricular cardiomyocytes. CMYA5 ablation caused loss of jSR organization. At this stage, T-tubules were not yet present in either genotype. Bar, 10 µm. Representative of three independent experiments. d RYR2, CMYA5, and ACTN2 localization in WT E15.5 ventricular myocardium. Assembling sarcomere Z-lines (ACTN2) co-localized with CMYA5 alone (red arrowheads), CMYA5 and RYR2 (yellow arrowheads), or neither (white arrowheads). Bar, 5 µm. Representative of five independent experiments. e, f Effect of CASAVV-mediated ablation of RYR2 on CMYA5 and FSD2 localization. CASAAV somatic mutagenesis was used to deplete RYR2 in a subset of cardiomyocytes. CMYA5 and FSD2 localization was evaluated in RYR2-deficient (GFP+) and control (GFP−) cardiomyocytes. Spatial profiles of boxed areas in f, plotted at right, demonstrate that RYR2 ablation did not impact CMYA5 or FSD2 localization. Bar = 10 µm (e), 5 µm (f). Representative of three independent experiments. g, h Effect of CASAAV-mediated ablation of MYH6 on CMYA5 and ACTN2 localization. CASAAV was used to deplete MYH6 in a subset of cardiomyocytes. MYH6-deficient (GFP+) had impaired sarcomerogenesis and disorganization of Z-line marker ACTN2, and CMYA5 organization was correspondingly deranged. Signal intensities in boxed areas in h are plotted to the right. Bar = 10 µm (g), 5 µm (h). Representative of three independent experiments.
Fig. 4
Fig. 4. Altered dyadic Ca2+ release in CMYA5 KO cardiomyocytes.
Ca2+ release in mature Cmya5 KO or WT ventricular cardiomyocytes was assessed using a dyad-localized Ca2+ nanosensor, GCaMP6f-Junctin (ASPH-G6f) and detected by confocal line scan imaging. a, b Surface plots of Ca2+ sparks in basal and isoproterenol (ISO)-stimulated (100 nM) cardiomyocytes. Quantification is shown in (b). Mann-Whitney test within basal or ISO conditions. cf Ca2+ release during electrical pacing (red lines) under basal conditions or ISO stimulation. Dotted line, leading edge of the evoked Ca2+ transient. Arrowheads, aberrant Ca2+ release outside of the initial evoked Ca2+ transient, without (white) or with (red) wave-like propagation. d. Representative Ca2+ transients under basal (top) or ISO (bottom) conditions. e, f Quantification (mean ± SD) of Ca2+ transient amplitude and Ca2+ spark frequency. Mann-Whitney test within basal or ISO conditions. gi Measurement of SR Ca2+ stores using low-affinity Ca2+-sensitive dye Fluo5N and AAV-mediated expression of SR-targeted esterase, which trapped Fluo5N in SR. g, Fluo5N distribution. h, i SR Ca2+ release induced by 10 mM caffeine. gi are representative of three independent experiments. Caffeine-induced change in Fluo5N signal yielded an estimate of SR Ca2+ stores (mean ± SD). t test. Bar = 10 µm. j Ca2+ release at dyads of electrically paced cardiomyocytes was recorded using the ASPH-G6f dyad-targeted Ca2+ nanosensor. Gray arrowheads, consistently coupled dyads (activated with each electrical pacing event). Red arrowheads, inconsistently coupled dyads (activated with some pacing events but not others). k Fluorescence intensity profiles over time of yellow outlined dyads in j, numbered 1–4. Dyad 2 was consistently coupled, whereas dyads 1, 3, and 4 were inconsistently coupled. Black arrows, lack of activation with electrical pacing. Blue arrow, evoked Ca2+ spark not coordinated with the overall Ca2+ transient. l Frequency of inconsistently coupled dyads in WT and KO cardiomyocytes, with and without ISO stimulation. The number of pacing events without dyadic Ca2+ release over three consecutive calcium transients was normalized to line scan length. n, number of cardiomyocytes. Mann–Whitney test within basal or ISO conditions. *, P < 0.05; **, P < 0.01; ****, P < 0.0001. Two-sided statistical tests were used. Data are presented as mean ± SD.
Fig. 5
Fig. 5. CMYA5 protects the heart and dyads from the deleterious effects of pressure overload.
Cmya5 KO and WT mice underwent baseline echocardiography (week 0) and then TAC or Sham surgery. After 4 weekly echocardiograms, necropsy was performed. a Systolic heart function. FS fractional shortening. Repeated-measures two-way ANOVA was performed for TAC cohort, with a comparison to WT-TAC () at each time point. n, number of mice. b Gross cardiac morphology. Bar, 2.5 mm. c Heart weight normalized to body weight. Kruskal-Wallis with Dunn’s multiple comparison test vs.WT within Sham (*) or TAC () cohorts. n number of mice. dg Dyad architecture analyzed by transmission electron microscopy. Boxed regions are magnified in the bottom row. Bar, 500 nm. Quantification of T-tubule circularity, jSR-to-T-tubule coupling ratio, and Junction-Z-line distance. Kruskal–Wallis with Dunn’s multiple testing correction vs. WT Sham (*) or TAC (). n, number of dyads per group, from at least 10 cardiomyocytes from 3 different mice. h, i Cardiomyocytes were transduced with dyad-localized ASPH-G6f Ca2+ nanosensor. Images of nanosensor distribution indicate dyad disorganization induced by TAC and Cmya5 KO (h). Quantification of Ca2+ sparks by confocal line scan imaging of nanosensor. Kruskal–Wallis with Dunn’s multiple testing correction within Sham (*) or TAC (). n, number of cardiomyocytes per group. , P = 0.054; or *, P < 0.05; ∧∧ or **, P < 0.01; ∧∧∧ or ***, P < 0.001; ∧∧∧∧ or ****, P < 0.0001. Two-sided statistical tests were used. Data are presented as mean ± SD.

References

    1. Lu F, Pu WT. The architecture and function of cardiac dyads. Biophys. Rev. 2020;12:1007–1017. doi: 10.1007/s12551-020-00729-x. - DOI - PMC - PubMed
    1. Soeller C, Cannell MB. Examination of the transverse tubular system in living cardiac rat myocytes by 2-photon microscopy and digital image-processing techniques. Circ. Res. 1999;84:266–275. doi: 10.1161/01.RES.84.3.266. - DOI - PubMed
    1. Scriven DRL, Asghari P, Moore EDW. Microarchitecture of the dyad. Cardiovasc. Res. 2013;98:169–176. doi: 10.1093/cvr/cvt025. - DOI - PubMed
    1. Wu H-D, et al. Ultrastructural remodelling of Ca2+ signalling apparatus in failing heart cells. Cardiovasc. Res. 2012;95:430–438. doi: 10.1093/cvr/cvs195. - DOI - PMC - PubMed
    1. Hong T, et al. Cardiac BIN1 folds T-tubule membrane, controlling ion flux and limiting arrhythmia. Nat. Med. 2014;20:624–632. doi: 10.1038/nm.3543. - DOI - PMC - PubMed

Publication types

MeSH terms