. 2022 Apr 21;13(1):2110.
doi: 10.1038/s41467-022-29608-7.

App-based COVID-19 syndromic surveillance and prediction of hospital admissions in COVID Symptom Study Sweden

Affiliations

App-based COVID-19 syndromic surveillance and prediction of hospital admissions in COVID Symptom Study Sweden

Beatrice Kennedy et al. Nat Commun. .

Abstract

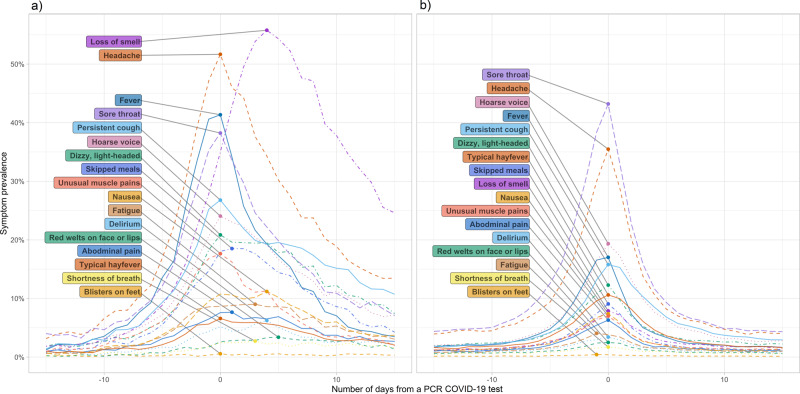
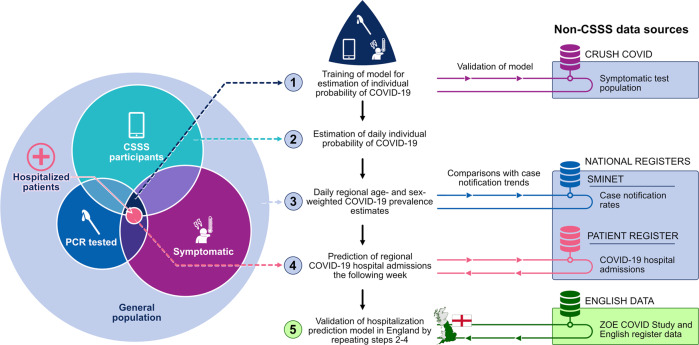
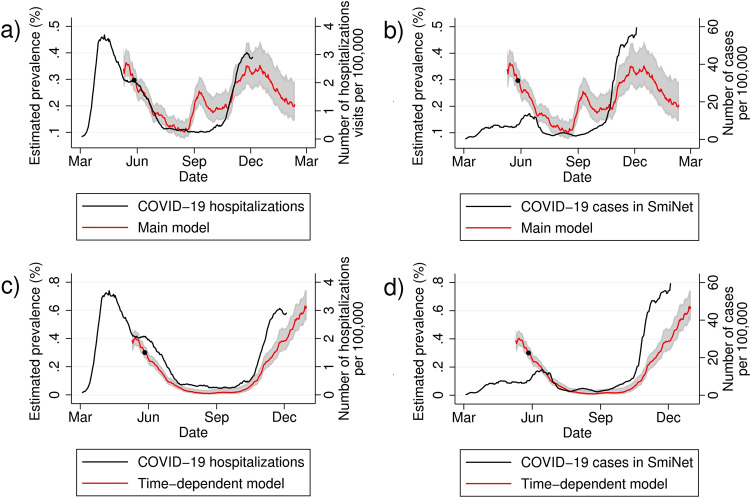
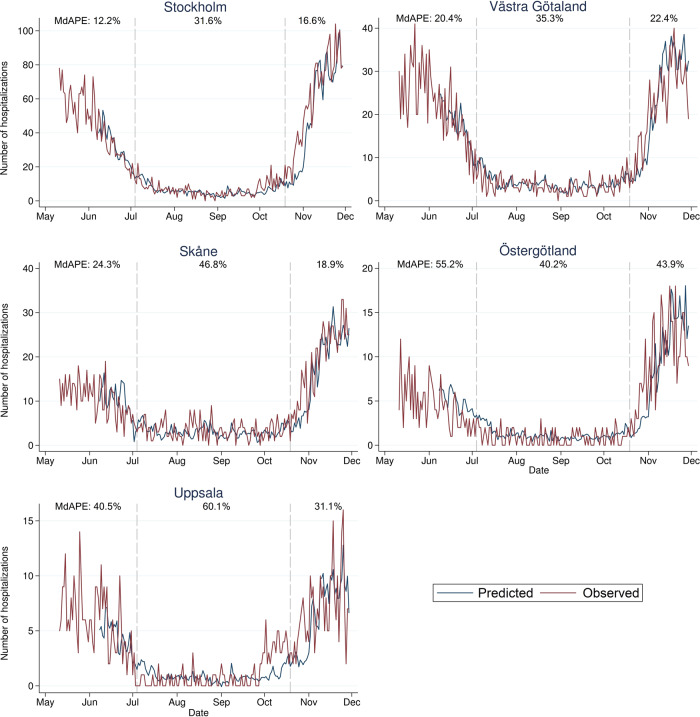
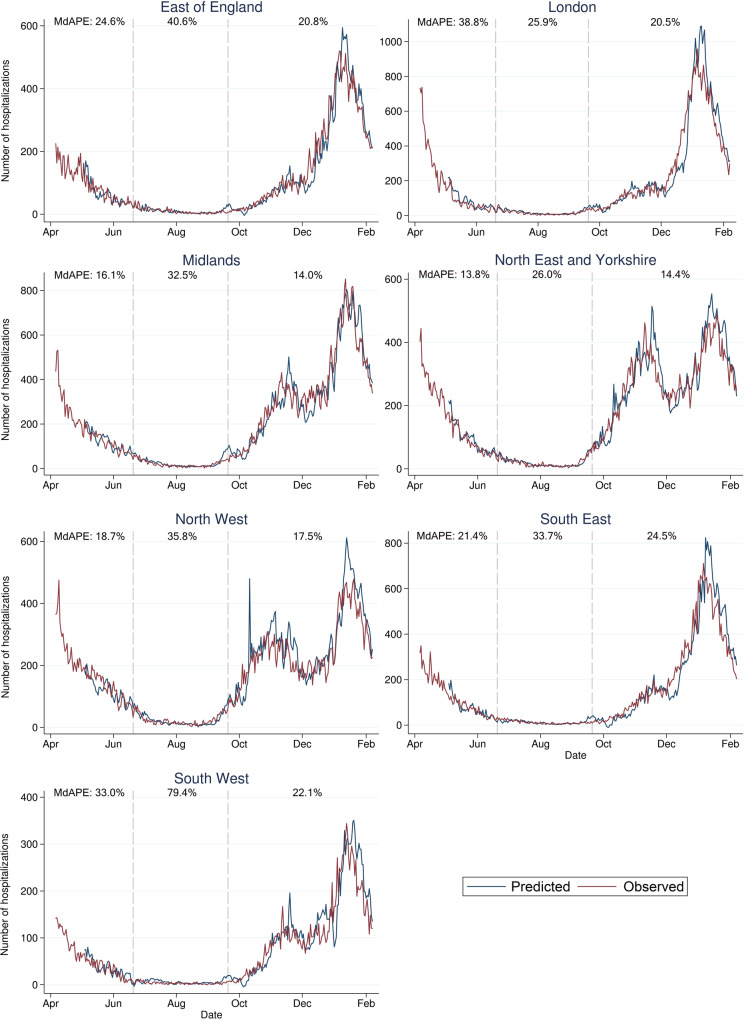
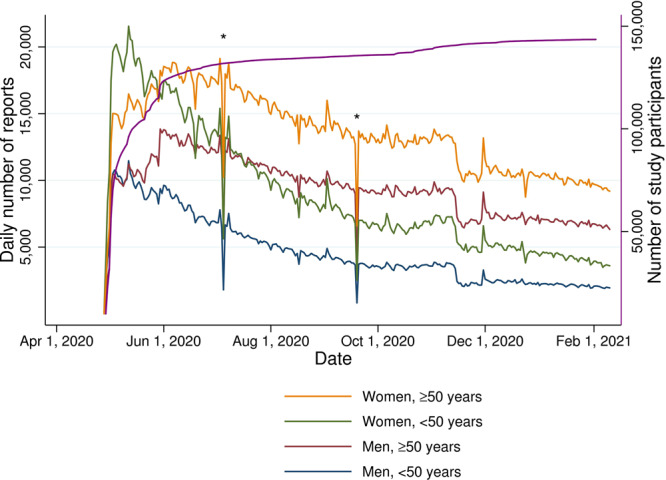
The app-based COVID Symptom Study was launched in Sweden in April 2020 to contribute to real-time COVID-19 surveillance. We enrolled 143,531 study participants (≥18 years) who contributed 10.6 million daily symptom reports between April 29, 2020 and February 10, 2021. Here, we include data from 19,161 self-reported PCR tests to create a symptom-based model to estimate the individual probability of symptomatic COVID-19, with an AUC of 0.78 (95% CI 0.74-0.83) in an external dataset. These individual probabilities are employed to estimate daily regional COVID-19 prevalence, which are in turn used together with current hospital data to predict next week COVID-19 hospital admissions. We show that this hospital prediction model demonstrates a lower median absolute percentage error (MdAPE: 25.9%) across the five most populated regions in Sweden during the first pandemic wave than a model based on case notifications (MdAPE: 30.3%). During the second wave, the error rates are similar. When we apply the same model to an English dataset, not including local COVID-19 test data, we observe MdAPEs of 22.3% and 19.0% during the first and second pandemic waves, respectively, highlighting the transferability of the prediction model.


Conflict of interest statement

CSSS is a strictly non-commercial research project. P.F. consults for and has stock options in ZOE Limited relating to the PREDICT nutrition studies, which are entirely separate from the COVID Symptom Study app development and COVID-19 research. A.T.C. previously served as an investigator on the PREDICT nutrition studies. T.D.S. is a consultant to ZOE Limited. T.S. is the current CEO and a shareholder at Novus International Group AB, Sweden. R.D., J.W., J.C.P., S.G., A.M., S.S. and J.L.C. work for ZOE Limited. All other authors declare that they have no competing interests.

Figures

Fig. 1
Fig. 1. Symptom trajectories.
The prevalence of symptoms reported by participants in COVID Symptom Study Sweden with (a) a positive PCR test for COVID-19 (n = 5178), and (b) a negative PCR test for COVID-19 (n = 32,089), across the study period April 29, 2020–February 10, 2021.
Fig. 2
Fig. 2. Analysis strategy.
Analysis strategy and data sources.
Fig. 3
Fig. 3. Prevalence estimates of symptomatic COVID-19 in Sweden.
National prevalence estimate, with 95% confidence interval, of symptomatic COVID-19 in COVID Symptom Study Sweden (main model utilized for real-time prediction estimates, and retrospective time-dependent model), combined in (a and c) with retrospective data on daily number of new hospital admissions registered in the National Patient Register per 100,000 inhabitants ≥18 years, and in (b and d) with daily number of new COVID-19 cases registered in SmiNet, per 100,000 inhabitants ≥18 years. *Time-point for recalibration of CSSS national COVID-19 prevalence estimate using national point prevalence survey findings from the Public Health Agency of Sweden.
Fig. 4
Fig. 4. Predicted number of daily hospital admissions in Sweden.
Predicted number of daily hospital admissions 7 days ahead across the five most populated regions in Sweden ordered by population size. The median absolute percentage errors (MdAPEs) of the predictions are denoted for the first pandemic wave (June 8–July 3, 2020), the summer period (July 4–October 18, 2020), and the second pandemic wave (October 19–November 29, 2020).
Fig. 5
Fig. 5. Predicted number of daily hospital admissions in England.
Predicted number of daily hospital admissions 7 days ahead across the seven English healthcare regions. The median absolute percentage errors (MdAPEs) of the predictions are denoted for the first pandemic wave (May 4–June 19, 2020), the summer period (June 20–September 19, 2020), and the second pandemic wave (September 20, 2020–February 7, 2021).
Fig. 6
Fig. 6. Study participation.
Number of daily reports from study participants stratified by sex and age (<50 and ≥50 years), and cumulative number of study participants (n total = 143,531, purple line), in COVID Symptom Study Sweden during the study period April 29, 2020 to February 10, 2021. *Temporary halt in data collection due to technical issue in the COVID Symptom Study app.

References

    1. World Health Organization. Public health surveillance for COVID-19: Interrim Guidance. 16 December 2020. Available at https://apps.who.int/iris/bitstream/handle/10665/337897/WHO-2019-nCoV-Su... (2020).
    1. European Centre for Disease Prevention and Control. COVID-19 surveillance guidance. October 2021. Available at https://www.ecdc.europa.eu/sites/default/files/documents/COVID-19-survei... (2021).
    1. Denis F, et al. Epidemiological Observations on the Association Between Anosmia and COVID-19 Infection: analysis of data from a self-assessment web application. J. Med. Internet Res. 2020;22:e19855. doi: 10.2196/19855. - DOI - PMC - PubMed
    1. Timmers T, Janssen L, Stohr J, Murk JL, Berrevoets MAH. Using eHealth to Support COVID-19 Education, Self-Assessment, and Symptom Monitoring in the Netherlands: Observational Study. JMIR Mhealth Uhealth. 2020;8:e19822. doi: 10.2196/19822. - DOI - PMC - PubMed
    1. Yoneoka D, et al. Early SNS-Based Monitoring System for the COVID-19 Outbreak in Japan: a Population-Level Observational Study. J. Epidemiol. 2020;30:362–370. doi: 10.2188/jea.JE20200150. - DOI - PMC - PubMed

Publication types