. 2022 Apr 21;12(1):6592.
doi: 10.1038/s41598-022-10539-8.

Establishment of a fish model to study gas-bubble lesions

Affiliations

Establishment of a fish model to study gas-bubble lesions

Alicia Velázquez-Wallraf et al. Sci Rep. .

Erratum in

Abstract

Decompression sickness (DCS) is a clinical syndrome caused by the formation of systemic intravascular and extravascular gas bubbles. The presence of these bubbles in blood vessels is known as gas embolism. DCS has been described in humans and animals such as sea turtles and cetaceans. To delve deeper into DCS, experimental models in terrestrial mammals subjected to compression/decompression in a hyperbaric chamber have been used. Fish can suffer from gas bubble disease (GBD), characterized by the formation of intravascular and extravascular systemic gas bubbles, similarly to that observed in DCS. Given these similarities and the fact that fish develop this disease naturally in supersaturated water, they could be used as an alternative experimental model for the study of the pathophysiological aspect of gas bubbles. The objective of this study was to obtain a reproducible model for GBD in fish by an engineering system and a complete pathological study, validating this model for the study of the physiopathology of gas related lesions in DCS. A massive and severe GBD was achieved by exposing the fish for 18 h to TDG values of 162-163%, characterized by the presence of severe hemorrhages and the visualization of massive quantities of macroscopic and microscopic gas bubbles, systemically distributed, circulating through different large vessels of experimental fish. These pathological findings were the same as those described in small mammals for the study of explosive DCS by hyperbaric chamber, validating the translational usefulness of this first fish model to study the gas-bubbles lesions associated to DCS from a pathological standpoint.


Conflict of interest statement

The authors declare no competing interests.

Figures

Figure 1
Figure 1
Graphical representation of the evolution of supersaturated water in an open aquarium without recirculation based on experiments performed from 1140 mmHg (150% of TDG). Each line corresponds to six different experiments with a similar pattern of TDG decrease in all of them.
Figure 2
Figure 2
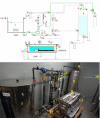
Supersaturated water production system components. (1) Open vessel. (2) Motor pump. (3) Dissolution tube. (4) Synthetic air injection valve. (5) Pressurized tank. (6) TDG and temperature sensor. (6*) TDG and temperature sensor inside the open circuit. (7) Pressurized aquarium. (8) Pressurized aquarium vent valve. (9) Pressurized tank vent valve. (10) Synthetic air bottle. (11) Flow meter. (12) Pressurized aquarium inlet valve. (13) Pressurized aquarium outlet valve. (14) Pressurized tank outlet valve. (15) Running water inlet.
Figure 3
Figure 3
Detail of pressurized aquarium during a fish experiment. TDG and temperature sensor (6). Pressurized aquarium (7).
Figure 4
Figure 4
TDG plots represent the pilot tests without fish. The orange lines represent the group in which a high TDG value (120%) was reached, while the blue lines represent the experiments with a TDG of approximately 101%. The peaks observed in the different tests represent the simulation of fish introduction.
Figure 5
Figure 5
Diagram of the 4 phases into which the water supersaturation procedure can be divided. Phase I (green) represents the increase of TDG in the water due to the addition of compressed air from a cylinder. Phase II (orange): stabilization or plateau phase of the TDG value. Phase III (gray): simulation of the introduction of a fish into the pressurized aquarium representing the loss of TDG when depressurizing the aquarium and the rapid recovery of the value. Phase IV (yellow): stabilization of TDG post-simulation, which remains constant over time.
Figure 6
Figure 6
Representation of the evolution of TDG values from the introduction of the fish to the end of the exposure time for each experimental fish. F1-F2 correspond to the 3 h group, F3–F4 to the 6 h group, F5–F6 to the 12 h group, and F7–F8 to the 18 h model group.
Figure 7
Figure 7
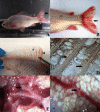
Macroscopic appearance of the 18-h fish group. (A) Fish alive inside the pressurized aquarium in the last hours of the experiment. Emphysema, congestion, and hemorrhages are observed in all fins. (B) External examination of the fish after euthanasia. Presence of the similar lesions observed in vivo. (C) Dorsal fin with the presence of emphysema (star) and multifocal hemorrhages (arrowhead). (D) Detail of dorsal fin with gas bubbles in blood vessels (arrows) and emphysema (star). (E) Ventral aorta at its exit from the bulbus arteriosus filled with gas. (F) Gas bubbles circulating in the gonadal vessel and presence of emphysema of the adjacent adipose tissue.
Figure 8
Figure 8
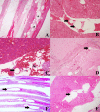
Microscopic findings of the 18-h fish group stained routinely with hematoxylin–eosin. (A) Fins displays the presence of emphysema (stars) and congestion. ×4. (B) Posterior kidney with large, unstained, circular to oval structures between blood components (arrows). ×10. (C) Gas bubble-like in the spleen (arrow), along with congestion. ×10. (D) Congestion and dilatation of blood vessels in the brain (arrow). ×10. (E) Blood vessels of primary gill lamellae with large caliber bubble-like gas, circumscribed by blood cells (arrows). ×4. (F) Ventricle cavity of the heart with presence of displaced blood around an oval, unstained structure compatible with gas bubble (arrow). ×4.

References

    1. Edmonds C, Bennett M, Lippmann J, Mitchell S. Diving and Subaquatic Medicine. CRC Press; 2015.
    1. Bert P. LaPressionBarometrique:RecherchesdePhysiologieExpérimentale. Masson; 1878.
    1. Vann RD, Butler FK, Mitchell SJ, Moon RE. Decompression illness. Lancet. 2011;377:153–164. doi: 10.1016/S0140-6736(10)61085-9. - DOI - PubMed
    1. García-Párraga D, et al. Decompression sickness ('the bends’) in sea turtles. Dis. Aquat. Organ. 2014;111:191–205. doi: 10.3354/dao02790. - DOI - PubMed
    1. Jepson PD, et al. Gas-bubble lesions in stranded cetaceans. Nature. 2003;425:575–576. doi: 10.1038/425575a. - DOI - PubMed

Publication types