. 2022 Apr 21;12(1):6572.
doi: 10.1038/s41598-022-10320-x.

Next generation automated traceless cell chromatography platform for GMP-compliant cell isolation and activation

Affiliations

Next generation automated traceless cell chromatography platform for GMP-compliant cell isolation and activation

Sabine Radisch et al. Sci Rep. .

Abstract

Large-scale target cell isolation from patient blood preparations is one of the critical operations during drug product manufacturing for personalized cell therapy in immuno-oncology. Use of high-affinity murine antibody coated magnetic nanoparticles that remain on isolated cells is the current standard applied for this purpose. Here, we present the transformation of previously described technology - non-magnetic immunoaffinity column chromatography-based cell selection with reversible reagents into a new clinical-grade cell isolation platform called Automated Traceless Cell affinity chromatography (ATC). ATC is a fully closed and GMP-compliant cell selection and manufacturing system. Reversibility of reagents enables (sequential) positive cell selection, optionally in combination with depletion columns, enabling capture of highly specific cell subsets. Moreover, synergy with other Streptamer-based technologies allows novel uses beyond cell isolation including integrated and automated on-column target cell activation. In conclusion, ATC technology is an innovative as well as versatile platform to select, stimulate and modify cells for clinical manufacturing and downstream therapies.


Conflict of interest statement

S.R., M.P.P., M.W., V.C., C.R., I.T., S.P., A.W., S.A., B.B., E.B., S.D., F.F., G.N., N.H., T.S., D.H.B., M.E., S.P.F., C.S., and L.G. are currently employed by Juno Therapeutics GmbH, A Bristol-Myers Squibb Company and own stocks of Bristol-Myers Squibb. L.G., T.S., C.R., M.P.P., and C.S. are listed as inventors on previously filed related patent applications.

Figures
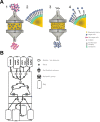
Figure 1
Figure 1
Schematic depiction of automatic column-based selection of target cells using cell affinity chromatography. (A) Target cell selection procedure: Starting material is loaded onto the bead-filled column (1) enabling binding of target cells to the specific Fab fragments on the bead surface and flushing out the non-target cells (2). Elution of pure target cells from the column is executed by adding D-biotin buffer (3). Biotin replaces the Fab in the Strep-tag binding pocket and therefore target cells are released and collected (4). (B) Schematic drawing of ATC hardware selection device’s front plate with selection tubing set. The device consists of valves for controlling the liquid flow path, peristaltic pumps for transporting liquids, bubble detectors for recording air in the system and column holders with shaking function. The tubing set is a dry, sterile and ready-to-use tubing set for target cell purification and contains two separate columns including pre-mounted empty bags for collecting different cell fractions as well as bags for wash buffer, D-biotin elution buffer and apheresis starting material (as depicted).
Figure 2
Figure 2
Development and characterization of the selection matrix towards the optimal target cell-capturing performance. (A) The linear portion for the immobilization of Strep-Tactin multimer backbone (SAm2 MM) to epoxy functionalized CytoSorbents base matrix is within 100–1000 µg Sam2 MM per mL reconstituted resin. Diagram shows the mean of 5 independent coupling reactions performed in PBS reaction buffer of pH 7.2. (B) Surface bound SAm2 MM retains the property to associate with biotin. Pictures show binding of the fluorescent biotin derivate Biotin-4-Fluorescein (FITC) to coupled CytoSorbents raw beads. Coupling reaction was performed in the presence (lower panels) or absence (upper panels) of 500 µg SAm2 MM. SAm2 MM coated surface is visualized by anti-Streptavidin-PE antibody staining. (C) The ability of surface bound Strep-Tactin to associate with biotin. The capacity for Strep-Tactin interaction on surface bound SAm2 MM was evaluated by Biotin-4-fluorescein (B4F) quenching assay. Diagram shows the mean of maximal B4F adsorption of three independent experiments. (D) Assessment of coupling of Fab fragments to the SAm2 MM. Diagram shows the quantity of Fab fragments bound to 1 mL column matrix dependent on the amount of surface bound SAm2 MM. Quantity of bound Fab fragments was calculated by quantifying residual protein content of Fab coupling solution after 1 h incubation time from the value initially loaded to SAm2 MM-coated matrixes. (E) Productivity of 1 mL selection matrix refers to the limit of functional coupleable SAm2 MM. CD3+ target cells were purified with increasing amounts of immobilized Fab fragment:SAm2 MM complex at constant ratio. Efficiency of T cell purification was calculated by the ratio of yielded T cell numbers related to the estimated T cell number based on their frequency in starting material. (F) Elution profiles of CD4 and CD8 target T cells for collected single fractions (left panels) and accumulated fractions (right panels) for seven independent cell selections performed on the ATC device with different target cell starting counts. Leukapheresis was used as a starting material.
Figure 3
Figure 3
Characterization of ATC T cell purification using leukapheresis as starting material. (A) Lymphocyte cell subset composition of starting material. Graphs present data from 27 washed healthy apheresis donors (left panel) and washed cryopreserved apheresis healthy material from 14 donors (right panel). Boxes represent mean ± SD. (B) Selection data for CD4 target cell fraction in the ATC CD4/CD8 selection process. Graphs show CD4+ T cell depletion efficiency, purity for CD4+ T cell target fraction as well as CD4+ on-target fraction, CD4 T cell yield and on-target (monocytes) and off-target impurities (B cells, NK cells) of 27 individual purifications. Boxes represent mean ± SD. (C) Selection data for CD8 target cell fraction in the ATC CD4/CD8 selection process. Graphs show CD8+ T cell depletion efficiency, purity for CD8+ T cell target fraction as well as CD8+ on-target fraction, CD8+ T cell yield and on-target (NK cells) and off-target impurities (B cells, monocytes) of 27 selections. Boxes represent mean ± SD. (D) Selection data for CD3 target cell fraction in the ATC CD3 selection process. Graphs show CD3+ T cell depletion efficacy, purity for CD3+ T cell target fraction, CD3+ T cell yield and target fraction impurities (B cells, NK cells, monocytes) of 14 purifications. Boxes represent mean ± SD. (E) T cell purification data showing absolute target cell counts from the ATC CD4/CD8 process as well as ATC CD3 process. Graphs represent cumulative data described above. Boxes represent mean ± SD.
Figure 4
Figure 4
Examples of multiplexed ATC selections for the generation of more homogenous T cell populations. (A) ATC CD27 selection efficiently enriches for CD27+ cells. Dot plots of one representative selection are shown. Graphs display purity, depletion, and yield based on the frequency of CD27+ cells. Cells were pre-gated on live, single CD45+ lymphocytes. Graph summarizes data from 4 independent measurements. Bars represent mean ± SD. (B) ATC CD27/CD3 selection isolated highly pure CD3+CD27+ T cells. Dot plots of one representative selection are shown. Graph shows purity, depletion, and yield of either ATC CD27, ATC CD3 or ATC CD27/CD3 selections. Cells were pre-gated on live, single CD45+ lymphocytes. Graph summarizes data from 3 independent measurements. Bars represent mean ± SD. (C) ATC CD3 selection can be utilized to remove CD3+ non-edited cells from allogenic T cell product. ATC CD4/CD8 pre-selected T cells were stimulated with Expamers and after 48 h gene edited to knock-out TCR/CD3 expression. Upon the cell expansion, ATC CD3 depletion was performed. Representative dot plots of the flow cytometry staining are shown. Cells were pre-gated on live, single CD45+ lymphocytes. Graphs summarize data from 30 independent measurements. Bars represent mean ± SD.
Figure 5
Figure 5
Integration and automation of ATC system with other manufacturing-relevant operations. (A) On-column stimulation with Expamers leads to T cell activation. Target cells captured on CD3 selection matrix were left unstimulated or stimulated by addition of Expamers and culture media to the selection column and incubation at 37 °C for 4 h. Collected cells were analyzed using flow cytometry. Cells were pre-gated on live, single CD45+ lymphocytes. Histograms depicting expression of CD69 activation marker from one out of 12 experiments are shown. (B) TCR/CD3 complex is downregulated upon activation. Graph shows TCR expression kinetics up to 72 h after an ATC CD3 selection with on-column activation. Graph represents data from one experiment. (C) A predictable number of target cells can be captured under saturating conditions. Graphs show CD3+ cell yield and purity of several ATC CD3 single column selections. Graph summarizes data from 11 independent measurements. Bars and boxes represent mean ± SD. (D) Comparison between ATC CD3 selection with either simultaneous or subsequent T cell stimulation. Kinetic of viability, cell proliferation and expression of early and late activation markers. Collected cells were counted and analyzed using flow cytometry. Cells were pre-gated on live, single CD45+ lymphocytes. Graphs show cumulative data from 4 experiments. (E) On-column activation of CD3+CD27+ T cells. CD3+CD27+ T cells were isolated using ATC CD27/CD3 double positive selection followed by on-column stimulation. Representative dot plots are shown. (F) Example of on-column activation and downstream transduction. Selected, stimulated and subsequently transduced (pos ctrl) or not (neg ctrl) T cells were analyzed for CAR transgene expression after 5 days of culture using flow cytometry. Cells were pre-gated on live, single CD45+ lymphocytes. Dot plots depicting expression of CAR receptor from one out of 3 independent experiments are shown.

References

    1. Brosseron F, Marcus K, May C. Isolating peripheral lymphocytes by density gradient centrifugation and magnetic cell sorting. Proteomic Profiling. 2015;1295:33–42. doi: 10.1007/978-1-4939-2550-6_3. - DOI - PubMed
    1. Faraghat SA, Hoettges KF, Steinbach MK, van der Veen DR, Brackenbury WJ, Henslee EA, Labeed FH, Hughes MP. High-throughput, low-loss, low-cost, and label-free cell separation using electrophysiology-activated cell enrichment. Proc. Natl. Acad. Sci. USA. 2017;114(18):4591–4596. doi: 10.1073/pnas.1700773114. - DOI - PMC - PubMed
    1. Pritchard RH, Zhukov AA, Fullerton JN, Want AJ, Hussain F, la Cour MF, Bashtanov ME, Gold RD, Hailes A, Banham-Hall E, Rogers SS. Cell sorting actuated by a microfluidic inertial vortex. Lab Chip. 2019;19(14):2456–2465. doi: 10.1039/C9LC00120D. - DOI - PubMed
    1. Isozaki A, Mikami H, Tezuka H, Matsumura H, Huang K, Akamine M, Hiramatsu K, Iino T, Ito T, Karakawa H, Kasai Y, Li Y, Nakagawa Y, Ohnuki S, Ota T, Qian Y, Sakuma S, Sekiya T, Shirasaki Y, Suzuki N, Tayyabi E, Wakamiya T, Xu M, Yamagishi M, Yan H, Yu Q, Yan S, Yuan D, Zhang W, Zhao Y, Arai F, Campbell RE, Danelon C, Di Carlo D, Hiraki K, Hoshino Y, Hosokawa Y, Inaba M, Nakagawa A, Ohya Y, Oikawa M, Uemura S, Ozeki Y, Sugimura T, Nitta N, Goda K. Intelligent image-activated cell sorting 2.0. Lab Chip. 2020;20(13):2263–2273. doi: 10.1039/D0LC00080A. - DOI - PubMed
    1. Guedan S, Ruella M, June CH. Emerging cellular therapies for cancer. Annu. Rev. Immunol. 2019;26(37):145–171. doi: 10.1146/annurev-immunol-042718-041407. - DOI - PMC - PubMed