. 2022 May;29(5):420-429.
doi: 10.1038/s41594-022-00755-1. Epub 2022 Apr 21.

Snapshots of actin and tubulin folding inside the TRiC chaperonin

Affiliations

Snapshots of actin and tubulin folding inside the TRiC chaperonin

John J Kelly et al. Nat Struct Mol Biol. 2022 May.

Abstract

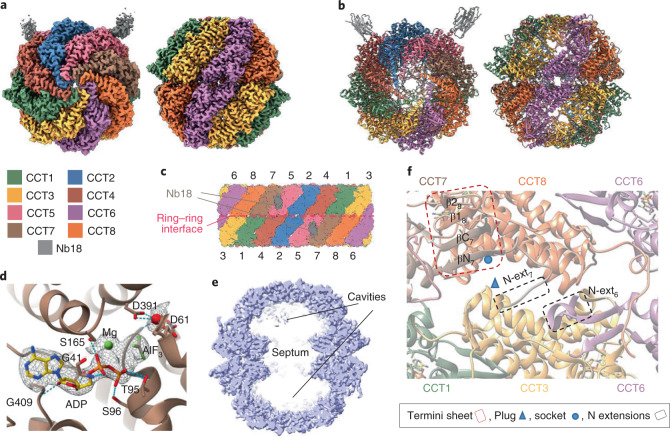
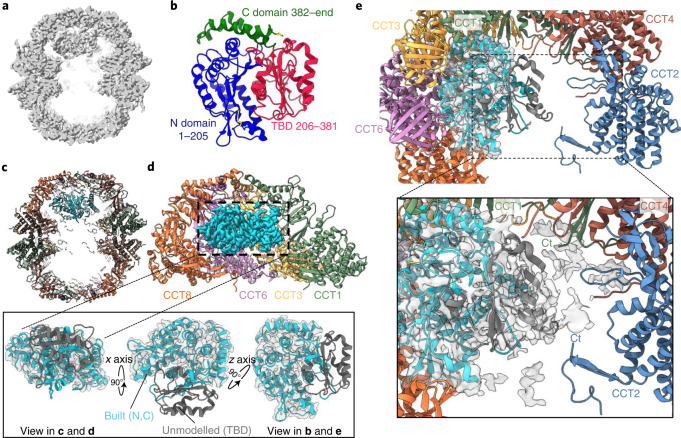
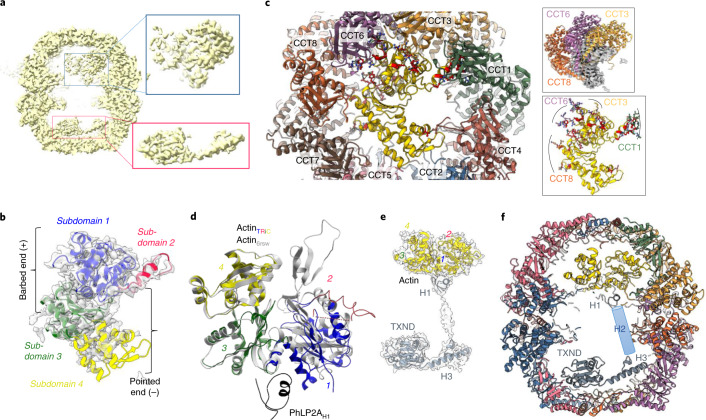
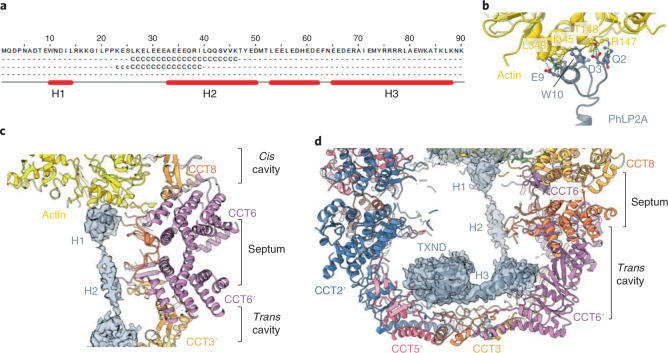
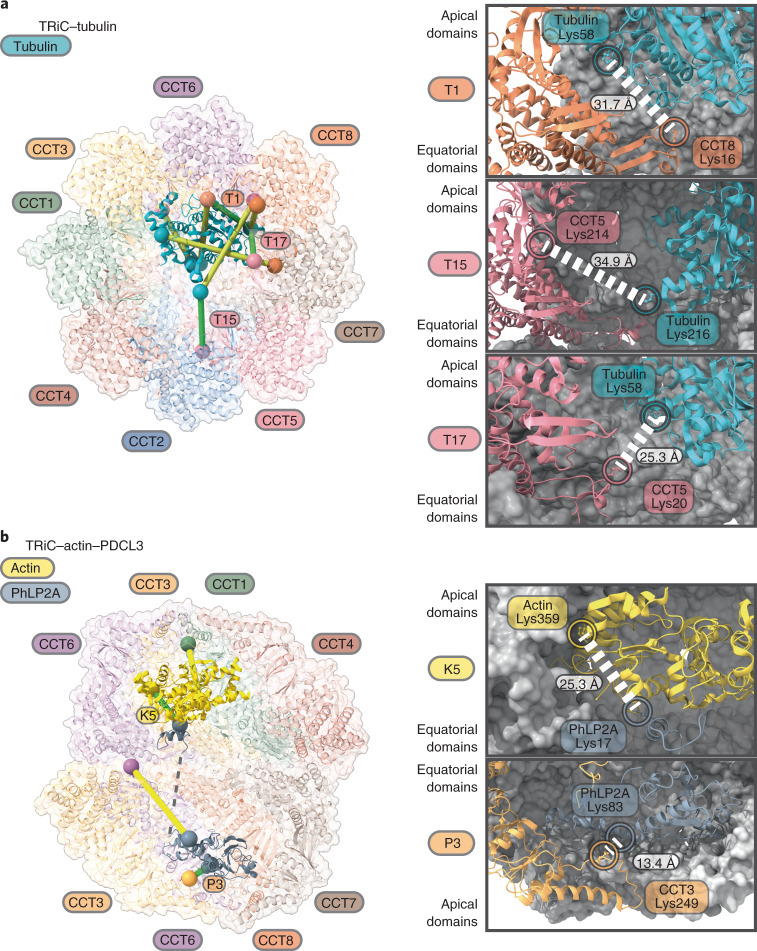
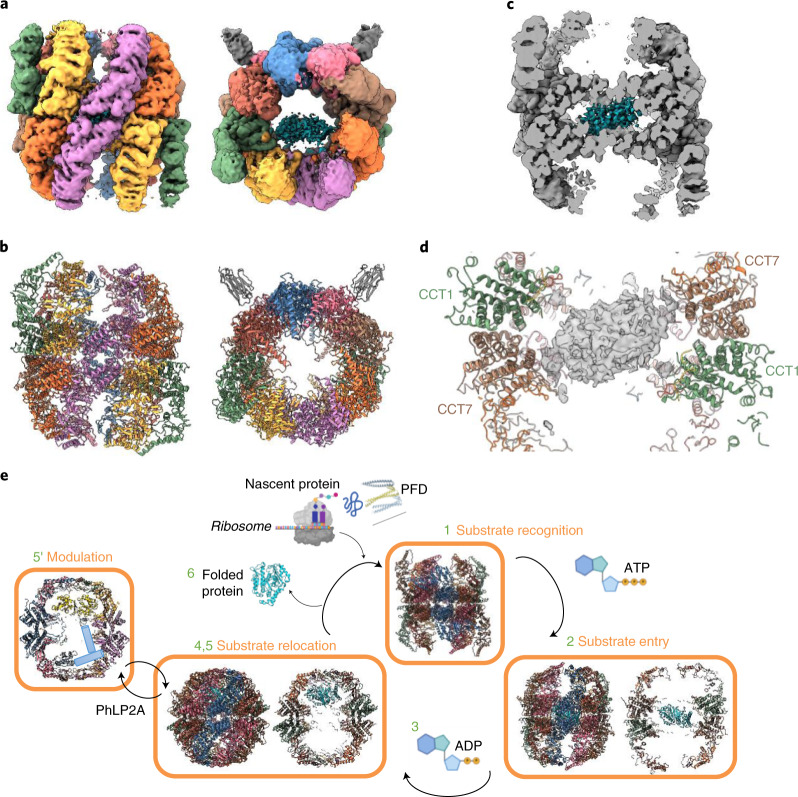
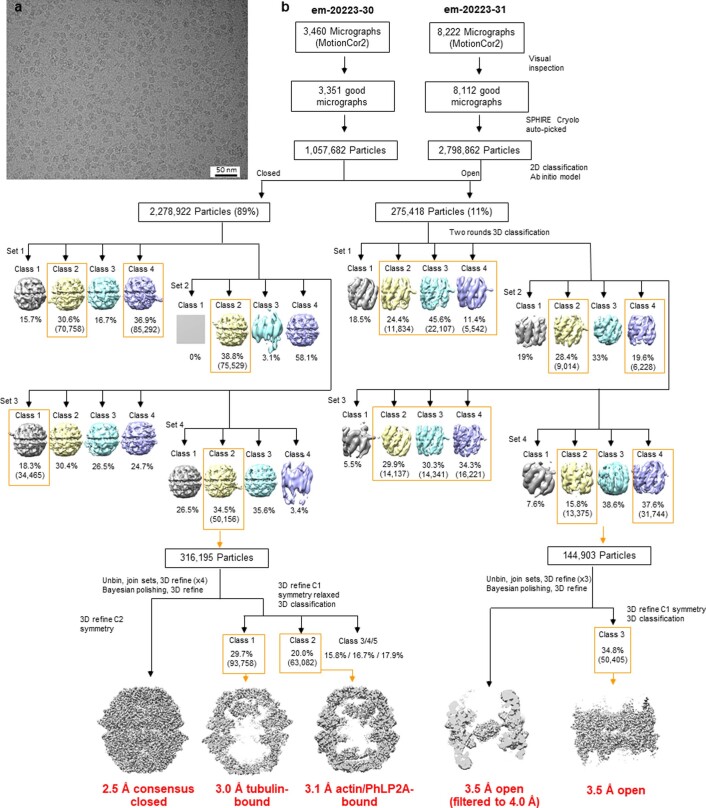
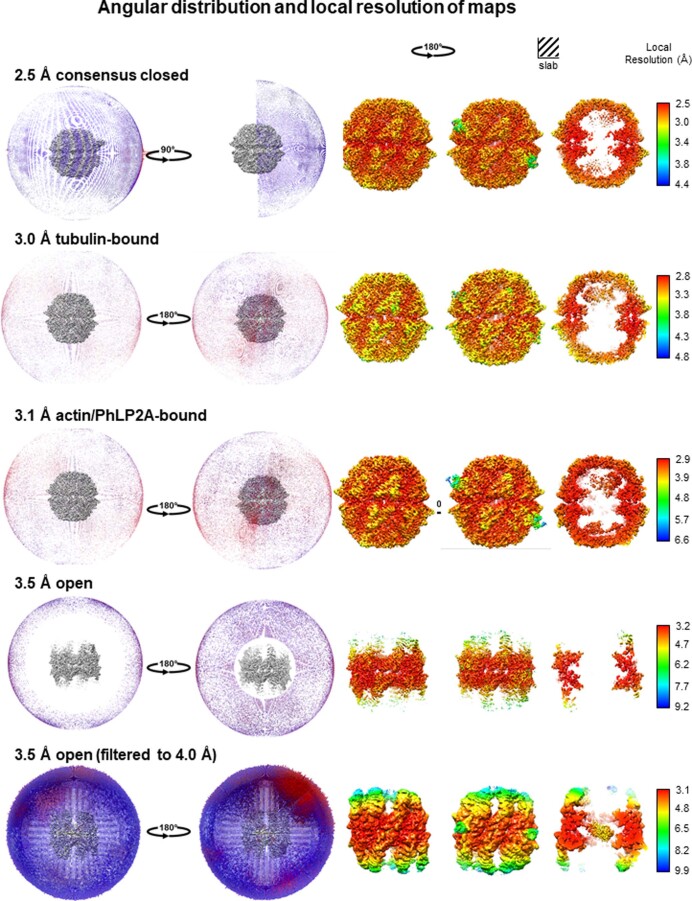
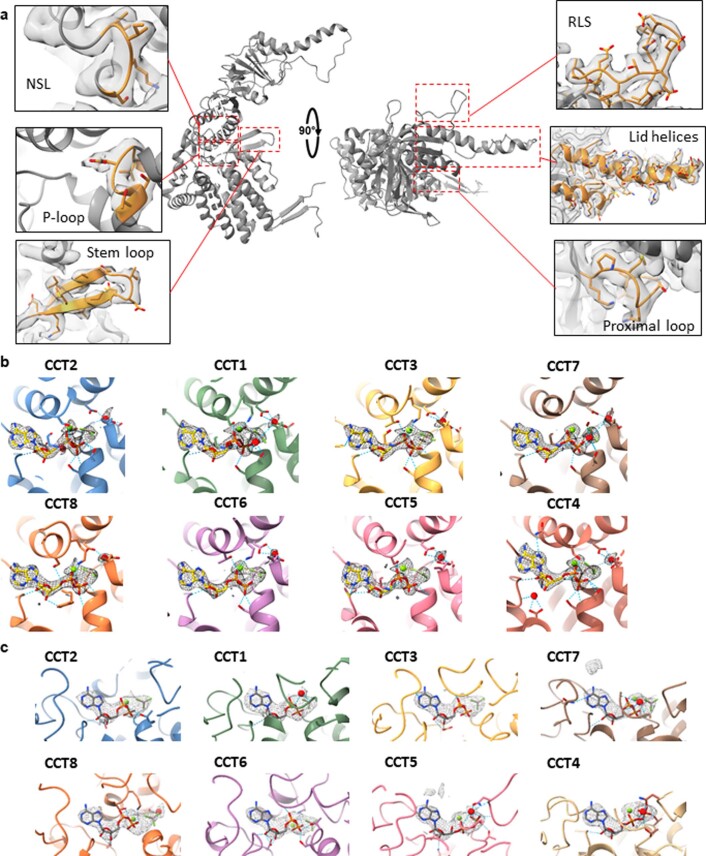
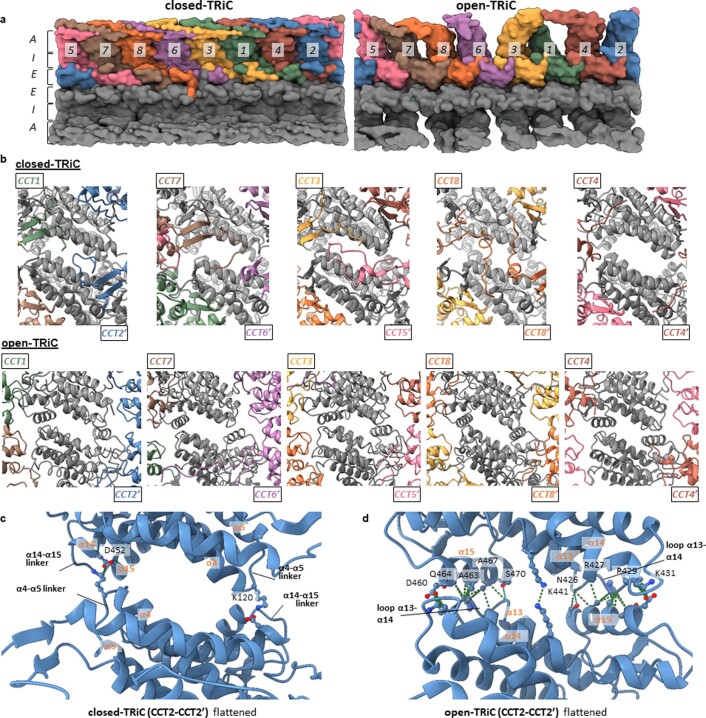
The integrity of a cell's proteome depends on correct folding of polypeptides by chaperonins. The chaperonin TCP-1 ring complex (TRiC) acts as obligate folder for >10% of cytosolic proteins, including he cytoskeletal proteins actin and tubulin. Although its architecture and how it recognizes folding substrates are emerging from structural studies, the subsequent fate of substrates inside the TRiC chamber is not defined. We trapped endogenous human TRiC with substrates (actin, tubulin) and cochaperone (PhLP2A) at different folding stages, for structure determination by cryo-EM. The already-folded regions of client proteins are anchored at the chamber wall, positioning unstructured regions toward the central space to achieve their native fold. Substrates engage with different sections of the chamber during the folding cycle, coupled to TRiC open-and-close transitions. Further, the cochaperone PhLP2A modulates folding, acting as a molecular strut between substrate and TRiC chamber. Our structural snapshots piece together an emerging model of client protein folding within TRiC.


Conflict of interest statement

K.M.K., J.M.J., and C.B. are employees of Pfizer Inc. J.J.K., D.T., E.P., G.C., H.K., L.H., J.S., V.O.P., J.T.H., and W.W.Y. declare no competing interests.

Figures

Fig. 1
Fig. 1. Structure of TRiC–Nb18 complex.
a, A map at 2.5-Å resolution of closed-TRiC in complex with Nb18 in top (left) and side (right) views. b, Cartoon representation of closed TRiC in same views as in a. c, Flattened scheme of subunit arrangement for the two stacked rings. d, Nucleotide-binding site of CCT7 bound with ADP–Mg2+–AlF3. Conserved interacting residues are shown as sticks. e, Side slice of closed-TRiC (fully empty class 4), highlighting the septum at the ring interface that creates two cavities in the TRiC interior. f, Section of the ring interface, viewed from the interior, showing examples of intra-ring (termini–hairpin sheets) and inter-ring (plug–socket, N extensions) contacts.
Fig. 2
Fig. 2. TRiC–tubulin complex.
a, Side slice map for closed TRiC, showing substrate density within one cavity of the chamber. b, Topology of native β-tubulin (PDB 6I2I). c, Overall model of TRiC–tubulin complex. d, Slice of the CCT8–CCT6–CCT3–CCT1 hemisphere from one ring, in contact with the substrate density (cyan). Inset, three orthogonal views showing region of β-tubulin built into the substrate density (cyan). Unmodeled TBD from tubulin (dark gray) is shown for reference. e, Top-down view of chamber interior, with tubulin density (cyan) adjacent to one hemisphere, and space in the interior that can accommodate the unmodelled TBD. Inset, at lower isosurface threshold, substrate density (gray surface) can accommodate the TBD (dark gray, taken from PDB 6I2I), which extends towards the C termini of CCT1 and CCT2.
Fig. 3
Fig. 3. TRiC–actin–cochaperone complex.
a, Side slice map of closed TRiC, showing protein density in both chamber cavities. b, Top-down view of actin model modeled from map density (gray), colored by subdomains. c, Top-down view of chamber interior showing TRiC subunits in contact with actin (yellow). Top inset, three subunits form main contacts with actin (gray). Bottom inset, subunit side chains (sticks) in contact with actin (yellow). d, Overlay of our actin model with native actin structure (PDB 6RSW). e, Non-TRiC map density at lower threshold that can accommodate actin (yellow) bound with PhLP2A (gray). f, Overall model of TRiC–actin–PhLP2A ternary complex. PhLP2A helix H2 is not modeled and is shown as a cartoon cylinder.
Fig. 4
Fig. 4. Cochaperone PhLP2A bound within TRiC chamber.
a, Secondary-structure prediction of human PhLP2A N terminus (amino acids 1–90). The three N-terminal helices H1–H3 are labeled. b, Interactions between actin and PhLP2A helix H1. c, Side slice of TRiC central chamber, showing the spread of PhLP2A (shown as gray density) across both cis and trans cavities. d, Side slice of the TRiC trans cavity occupied by helix H3 and TXND of PhLP2A.
Fig. 5
Fig. 5. Crosslinking mass spectrometry analysis of TRiC-substrate interactions within the folding cavity.
a,b, Crosslinks between TRiC and tubulin (a) and between TRiC and actin/PhLP2A (b) reported from literature are mapped onto the TRiC structure with bound proteins. Left, identified crosslinks compatible with our structural models are indicated in green lines; crosslinks that are not sterically compatible with our model are indicated in yellow lines and could represent other stages of the substrate folding cycle that are not captured in our structures. Spheres represent lysine residues that are crosslinked. Right, magnified views showing the atomic environment of 3 TRiC–tubulin, 1 actin-PhLP2A, and 1 TRiC-PhLP2A crosslinks that support our models.
Fig. 6
Fig. 6. Substrate density in open TRiC.
a, Filtered 4.0-Å resolution reconstruction map of open TRiC in side (left) and top (right) views. b, Cartoon representation showing apical domains built into map, as well as intermediate and apical domains modeled by flexible fitting; same views as a. c, Side slice of open TRiC with substrate density in cyan. d, Slice of substrate density at low isosurface threshold, in the septum of open TRiC. e, Proposed mechanism of TRiC-mediated substrate folding based on this work. TRiC structures shown are from this study (steps 2, 4, 5, 5') or from PDB 5GW4 (step 1). PFD, prefoldin.
Extended Data Fig. 1
Extended Data Fig. 1. Selection and large-scale purification of monoclonal CCT5 C-term edited cell lines.
(a) Anti-FLAG western blot (top) and stain-free imaging (bottom) of wild type HEK293T, mixed pool, and five monoclonal cell lines. (b) Size exclusion profile of large-scale TRiC purification with pooled fractions indicated by pink shading. (c) SDS-PAGE of fractions from size exclusion chromatography showing double-banding patterns of TRiC subunits, and tubulin co-elution with TRiC. (d) Anti-CCT western blots (left) and Coomassie visualisation (right) of monoclonal 3.B5 line showing presence of TRiC subunits. Coomassie gel bands were excised, digested with trypsin and analyzed using LC-MS/MS to confirm presence of TRiC subunits. (e) Negative stain micrograph showing well-defined TRiC particles (data representative of n = 1). The Western Blot experiments in a,d were carried out at least two times. Uncropped images and unprocessed scans in a,c,e are available as source data. Source data
Extended Data Fig. 2
Extended Data Fig. 2. Volcano plot of peptides identified in solution digest LC-MS/MS.
Volcano plots are displayed with the log(2)-fold change on the x-axis and the -log(10)-p-value, as calculated by Perseus software using a two-sided statistical T-test, on the y-axis. Confidently enriched interactors in the endogenous TRiC sample, defined as p < 0.01 and log-fold change > 1.5, are annotated with protein name including actin (red dots), tubulin (blue dots) and PhLP2A (shown as PDCL3, black dot). ACTA1 denotes peptide identification that could not distinguish between α-cardiac muscle 1 ACTC1, aortic smooth muscle ACTA2, γ-enteric smooth muscle ACTG2, and cytoplasmic 2 isoforms ACTB (shown in the figure as ACTA1A). Raw data are found in Supplementary Data 1.
Extended Data Fig. 3
Extended Data Fig. 3. Nanobody Nb18 characterisation.
(a) Nb18 (red box) pulls down overexpressed CCT5 (left, n = 2) and endogenous TRiC (right, n = 1) from affinity chromatography. (b) Nb18 binds recombinant CCT5 in biolayer interferometry (Kd = 86 nM). Inset: Raw sensogram showing that recombinant CCT4 does not bind Nb18. (c) CCT5 and TRiC ATPase activity in the presence of Nb18. Nb18 was added at 5:8 molar ratio to recombinant CCT5, and at 1:1 to endogenous TRiC. Data are presented as mean values +/− SD (n = 6 for CCT5 only, n = 3 for all other samples). (d) Nb18 binds to a hydrophobic interface of CCT5 in proximity to ATP binding pocket. (e) Interacting residues between Nb18 and CCT5 in closed-TRiC (left) and open-TRiC (right). Green dashed lines indicate van der Waals contacts and blue dashed lines indicate hydrogen bonds. (f) Structural representation of CCT5-Nb18 crosslinks. Crosslinked residues are highlighted as spheres in gold. Dotted lines indicate distances between amines. Uncropped gels in a are available as source data. Source data
Extended Data Fig. 4
Extended Data Fig. 4. EM data processing.
(a) A representative micrograph of purified TRiC complexes (n = 1). (b) Cryo-EM data processing workflow. During the processing steps, the data were split in four sets (Set 1 - Set 4) which were processed in parallel for computational efficiency. Uncropped image in a is available as source data. Source data
Extended Data Fig. 5
Extended Data Fig. 5. EM map resolutions.
Angular distribution and local resolution of all maps.
Extended Data Fig. 6.
Extended Data Fig. 6.. Conserved structural features of TRiC.
(a) Conserved structural motifs common to all CCT subunits (here represented by CCT1) including apical lid helices, proximal loop, release loop of substrate (RLS), P-loop, nucleotide-sensing loop (NSL), and stem loop. Insets: Motifs are coloured orange and density map is shown grey. (b,c) Snapshots of ligand density in the nucleotide binding site for each CCT subunit of closed-TRiC (b) and open-TRiC (c). Dashed lines represent hydrogen bonding. ADP molecules are shown in yellow with Mg2+ in green and water molecules are represented in red spheres.
Extended Data Fig. 7
Extended Data Fig. 7. Intra- and Inter-ring contacts.
(a) Flattened surface representation showing conformational differences between closed-TRiC and open-TRiC in the equatorial (E), intermediate (I) and apical (A) domains. (b) Views of the network of N-terminal extensions between subunits across the ring interface in closed-TRiC state (top). Note that these interactions were not observed in open-TRiC state (bottom) due to disorder of the N-terminal extensions. (c,d) Flat rendering of the CCT2-CCT2’ inter-ring stacking in closed-TRiC (c) and open-TRiC (d). Compared to closed-TRiC, rearranged helix α15 pushes loop α4-α5 from the trans subunit away from the interface. Inter-ring contacts are now mediated between the entire helical face of α15, and loop α13-α14 from the trans subunit.
Extended Data Fig. 8
Extended Data Fig. 8. Tubulin-TRiC interactions.
For all panels, tubulin is coloured by domain: N-terminal domain (blue), TBD (crimson), and C-terminal domain (dark green). Green dashes indicate van der Waals contacts; blue dashes indicate hydrogen bonds. TRiC structural features labelled are apical domain loop (AL), stem-loop (SL), C-terminus (CT) and helix XX). (a) CCT8 interacts with tubulin N-terminus (Arg2, Glu53, Asp74) using its stem-loop (His59, Leu60) and intermediate domain (Arg314, Asn316). (b) CCT6 contacts tubulin N-terminal α4 (Glu125) and α5 (Glu157, Glu158, Tyr159) through a β-sheet of the apical domain. Additionally, CCT6 stem-loop (Ala51) and C-terminus (Met526) interact with tubulin N- and C-termini, along with CCT3 stem-loop (Met54). (c) Tubulin C-terminus (Phe402, Trp405) interacts with CCT3 stem-loop, helix α3 from equatorial domain (Glu89), and intermediate domain. (d) CCT1 apical domain loop (Lys245) and stem-loop (Asp358) form few tubulin contacts (Phe260, Pro261), involving also CCT3 apical domain loop and helix α3.
Extended Data Fig. 9
Extended Data Fig. 9. Actin-TRiC interactions.
For all panels, actin is coloured by domain: subdomain 1 (S1, blue), subdomain 2 (S2, crimson), subdomain 3 (S3, dark green), and subdomain 4 (S4, yellow); green dashes indicate van der Waals contacts; blue dashes indicate hydrogen bonds; TRiC structural features labelled are apical domain loop (AL), stem-loop (SL) and C-terminus (CT). (a) CCT8 uses stem-loop and C-terminus to interact with actin subdomains 1 and 3. This network of interactions also involves CCT7 C-terminus. (b) CCT6 uses the β-sheet in apical domain to contact exclusively actin subdomain 1. (c) CCT3 uses its stem-loop and apical domain β-sheet to contact actin subdomain 1. (d,e) CCT1 makes large number of actin contacts, using a groove in the intermediate domain to interact with the partially disordered D-loop of actin subdomain 2 which plays a role in ATP binding. (f) CCT4 I304 and L305 make few contacts with actin subdomain 4 which is not well ordered in our map. (g) CCT7 uses the stem-loop and C-terminus to interact with actin subdomain 3.
Extended Data Fig. 10
Extended Data Fig. 10. Intra-TRiC and inter-protein crosslinking mass spectrometry corroborates TRiC subunit orientation and protein localization.
(a) Ten most prevalent mappable crosslinks between TRiC subunits are overlayed onto our model of closed-TRiC. (b) All mappable TRiC-tubulin crosslinks are overlayed onto our model of closed-TRiC complexed with tubulin. (c) All mappable TRiC-actin-PhLP2A crosslinks are overlayed onto our model of closed-TRiC structure complexed with actin and PhLP2A. For all panels, crosslinks indicated as red lines map to the external surface of the chaperonin and are unlikely to represent interactions relevant to the study. Crosslinks indicated in yellow lines are not compatible with the localization or orientations suggested by our model, while those indicated in green lines are.

References

    1. Yam AY, et al. Defining the TRiC/CCT interactome links chaperonin function to stabilization of newly made proteins with complex topologies. Nat. Struct. Mol. Biol. 2008;15:1255–1262. doi: 10.1038/nsmb.1515. - DOI - PMC - PubMed
    1. Thulasiraman V, Yang CF, Frydman J. In vivo newly translated polypeptides are sequestered in a protected folding environment. EMBO J. 1999;18:85–95. doi: 10.1093/emboj/18.1.85. - DOI - PMC - PubMed
    1. Camasses A, Bogdanova A, Shevchenko A, Zachariae W. The CCT chaperonin promotes activation of the anaphase-promoting complex through the generation of functional Cdc20. Mol. Cell. 2003;12:87–100. doi: 10.1016/S1097-2765(03)00244-2. - DOI - PubMed
    1. Wang DY, Kamuda K, Montoya G, Mesa P. The TRiC/CCT chaperonin and its role in uncontrolled proliferation. Adv. Exp. Med. Biol. 2020;1243:21–40. doi: 10.1007/978-3-030-40204-4_2. - DOI - PubMed
    1. Shahmoradian SH, et al. TRiC’s tricks inhibit huntingtin aggregation. eLife. 2013;2:e00710. doi: 10.7554/eLife.00710. - DOI - PMC - PubMed

Publication types