. 2022 Apr 21;79(5):253.
doi: 10.1007/s00018-022-04247-9.

CircACTR2 in macrophages promotes renal fibrosis by activating macrophage inflammation and epithelial-mesenchymal transition of renal tubular epithelial cells

Affiliations

CircACTR2 in macrophages promotes renal fibrosis by activating macrophage inflammation and epithelial-mesenchymal transition of renal tubular epithelial cells

Hua Fu et al. Cell Mol Life Sci. .

Abstract

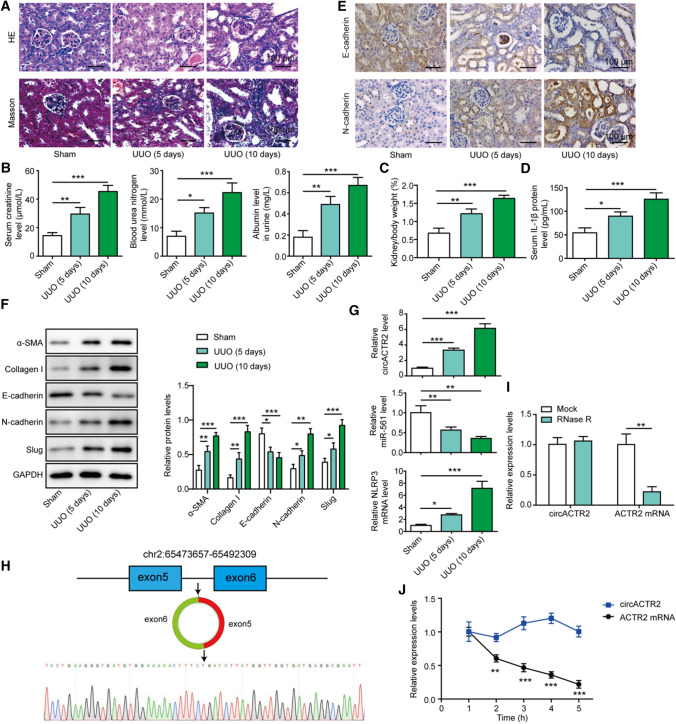
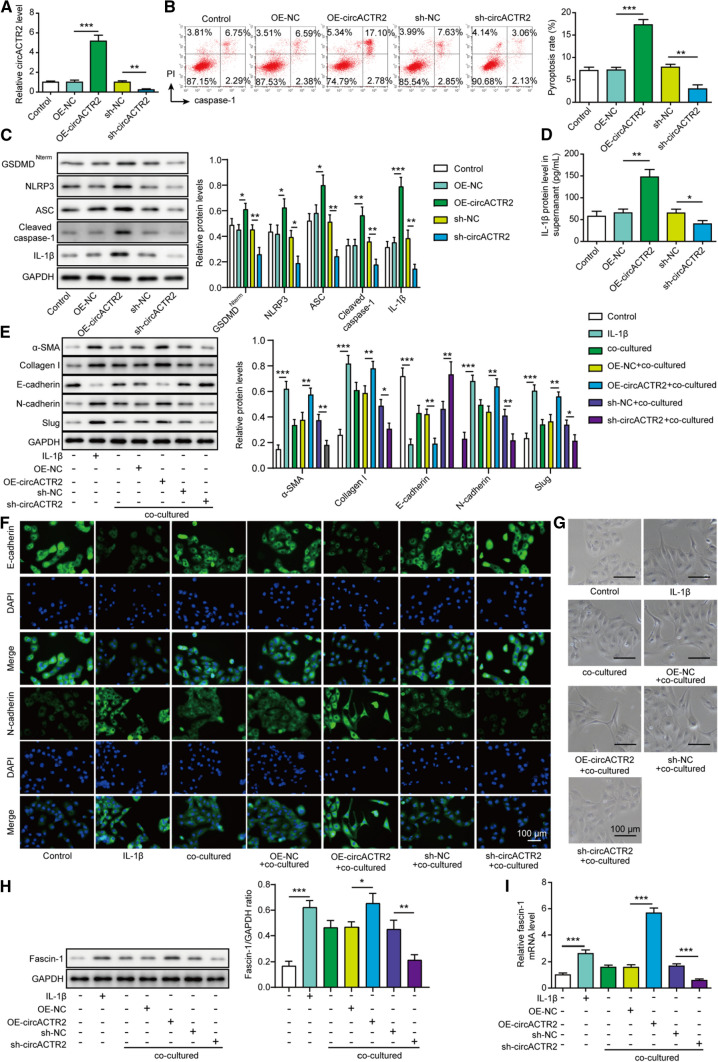
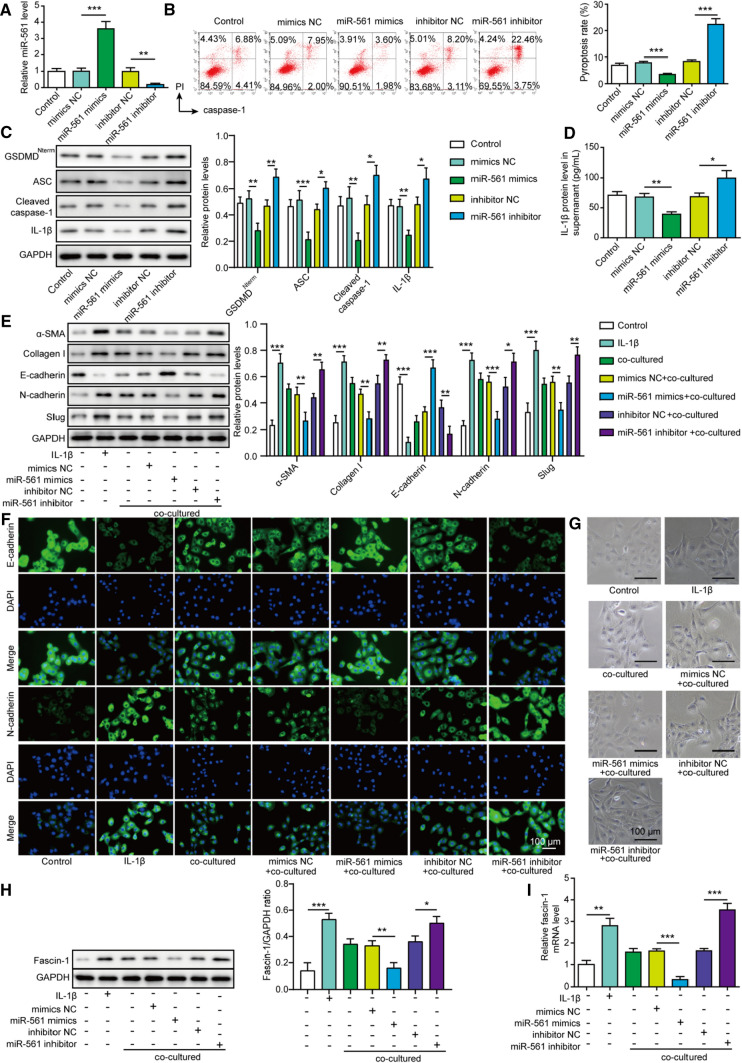
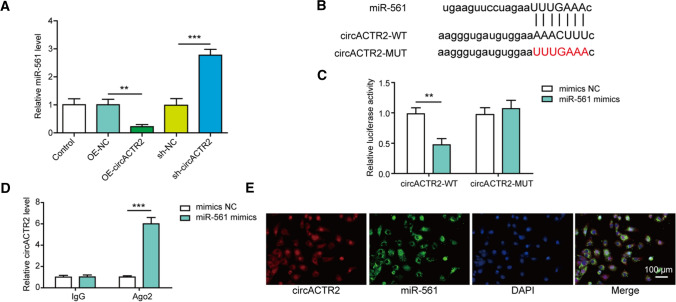
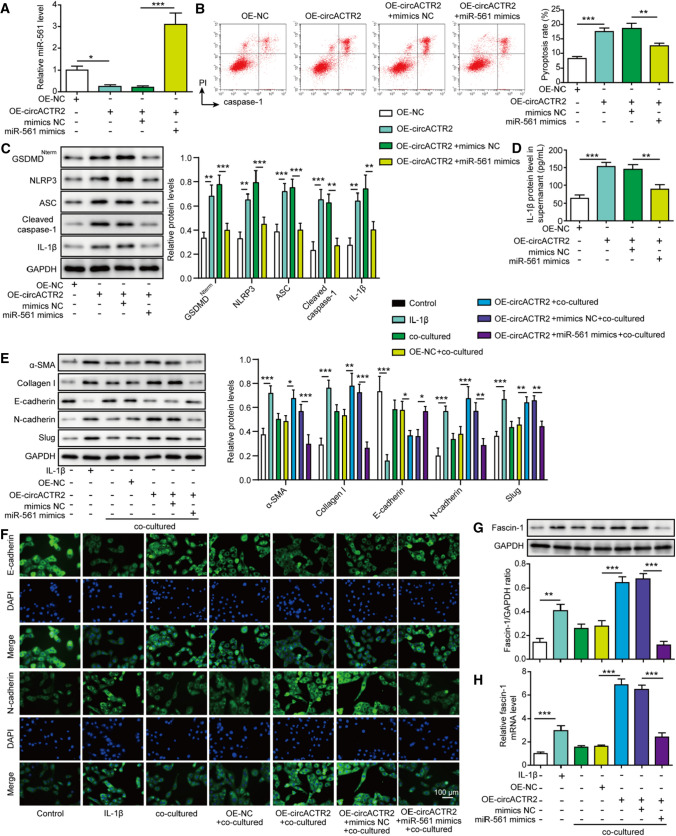
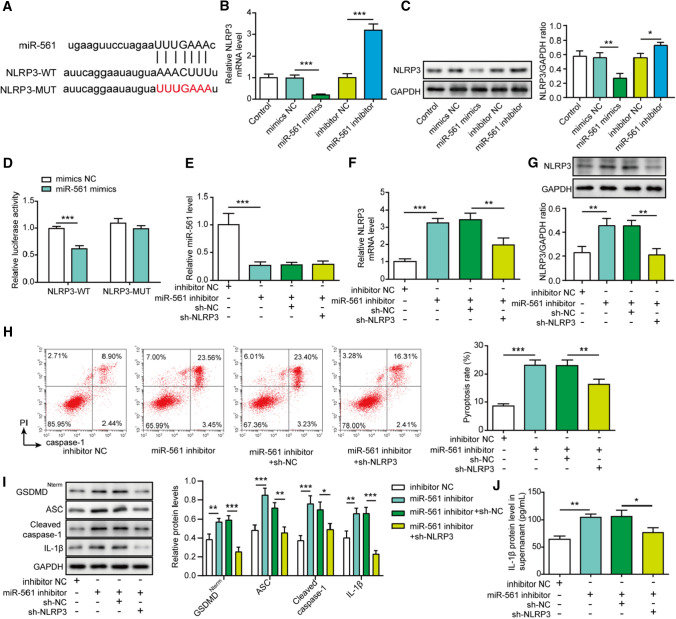
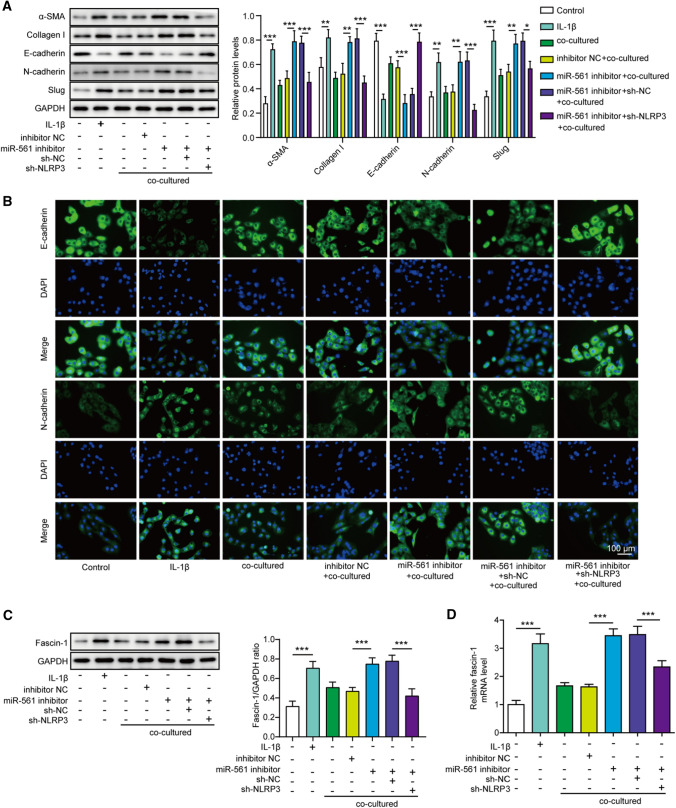
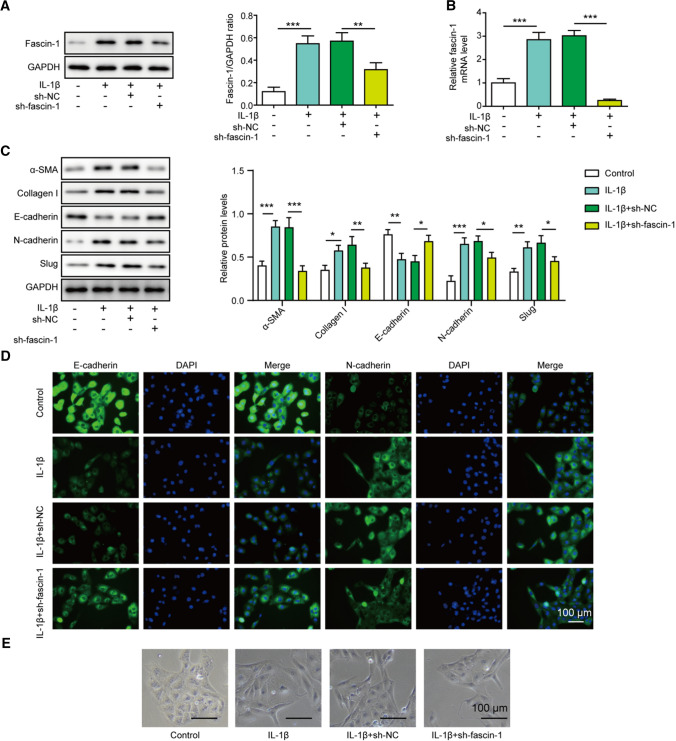
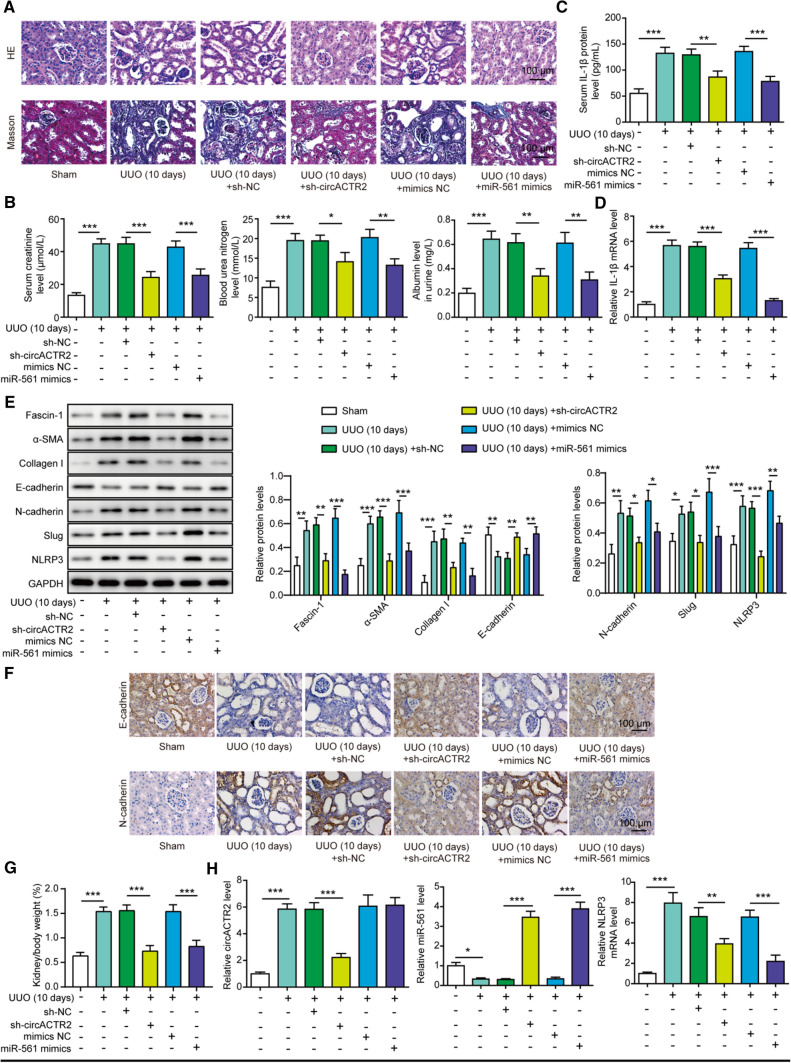
The crosstalk between macrophages and tubular epithelial cells (TECs) actively regulates the progression of renal fibrosis. In the present study, we revealed the significance of circular RNA ACTR2 (circACTR2) in regulating macrophage inflammation, epithelial-mesenchymal transition (EMT) of TECs, and the development of renal fibrosis. Our results showed UUO-induced renal fibrosis was associated with increased inflammation and EMT, hypertrophy of contralateral kidney, up-regulations of circACTR2 and NLRP3, and the down-regulation of miR-561. CircACTR2 sufficiently and essentially promoted the activation of NLRP3 inflammasome, pyroptosis, and inflammation in macrophages, and through paracrine effect, stimulated EMT and fibrosis of TECs. Mechanistically, circACTR2 sponged miR-561 and up-regulated NLRP3 expression level to induce the secretion of IL-1β. In TECs, IL-1β induced renal fibrosis via up-regulating fascin-1. Knocking down circACTR2 or elevating miR-561 potently alleviated renal fibrosis in vivo. In summary, circACTR2, by sponging miR-561, activated NLRP3 inflammasome, promoted macrophage inflammation, and stimulated macrophage-induced EMT and fibrosis of TECs. Knocking down circACTR2 and overexpressing miR-561 may, thus, benefit the treatment of renal fibrosis.

Keywords: Epithelial–mesenchymal transition; Fascin-1; Macrophages inflammation; NLRP3; Renal fibrosis; circACTR2; miR-561.


Conflict of interest statement

The authors declare that they have no conflict of interest.

Figures

Fig. 1
Fig. 1
CircACTR2 and NLRP3 are up-regulated, while miR-561 down-regulated in UUO-induced renal fibrosis. Unilateral ureteral obstruction (UUO) was performed on the right ureter to induce renal fibrosis. Kidneys were isolated from sham-operated mice, or from mice on day 5 and 10 after UUO surgery, respectively. 10 mice were included in each group. A HE and Masson trichrome staining on renal tissues. Scale bar: 100 μm. B Measurement of serum creatinine, blood urea nitrogen, and urinary albumin levels. C The ratio of left kidney/body weight in each group. D ELISA for serum IL-1β level. E IHC on E-cadherin and N-cadherin. Scale bar: 100 μm. F Western blot on fibrosis markers (α-SMA and collagen I) and EMT markers (E-cadherin, N-cadherin, and slug). G qRT-PCR on circACTR2, miR-561, and NLRP3 expression. H The structure of circACTR2 was confirmed by Sanger sequencing. I qRT-PCR on circACTR2 and ACTR2 mRNA expression after treatment without (mock) or with RNase R. J qRT-PCR on circACTR2 and ACTR2 mRNA expression after treatment with Actinomycin D for indicated time periods. *P < 0.05, **P < 0.01 and ***P < 0.001
Fig. 2
Fig. 2
CircACTR2 induces NLRP3-induced pyroptosis in macrophages directly and promotes EMT of TECs indirectly. THP-1 macrophages were transfected with circACTR2-expressing lentivirus (OE-circACTR2) or sh-circACTR2-expressing lentivirus (sh-circACTR2) to overexpress or knock down circACTR2 expression. A qRT-PCR to detect circACTR2 expression. B Pyroptosis (% of caspase-1+/PI+ cells) was examined by flow cytometry. C Western blot on pyroptosis biomarkers, GSDMDNterm, NLRP3, ASC, cleaved caspase-1, and IL-1β. D ELISA for measuring IL-1β level in the culture medium (supernatant). E to I. THP-1 macrophages-derived conditioned medium was applied to HK-2 cells. IL-1β was used as the positive control. E Western blot on expressions of α-SMA, collagen I, E-cadherin, N-cadherin, and slug in indicated HK-2 cells. F Immunofluorescence of E-cadherin and N-cadherin in HK-2 cells. Scale bar: 100 μm. G Light microscopy on the morphology of indicated HK-2 cells. Scale bar: 100 μm. H, I Western blot (H) and qRT-PCR (I) on fascin-1 expression. *P < 0.05, **P < 0.01 and ***P < 0.001
Fig. 3
Fig. 3
MiR-561 antagonizes pyroptosis and macrophage inflammation-induced fibrosis or EMT of TECs. MiR-561 mimics or inhibitor was transfected into THP-1 macrophages to up-regulate or down-regulate miR-561 level, respectively. A qRT-PCR on miR-561 expression in indicated THP-1 macrophages. B Pyroptosis was examined by flow cytometry. C Western blot to detect pyroptosis biomarkers GSDMDNterm, ASC, cleaved caspase-1, and IL-1β. D ELISA for measuring IL-1β production into the culture medium (supernatant). E to I THP-1 macrophages-derived conditioned medium or IL-1β (positive control) was applied to HK-2 cells. E Western blot on expressions of α-SMA, collagen I, E-cadherin, N-cadherin, and slug in indicated HK-2 cells. F Immunofluorescence to detect E-cadherin and N-cadherin in HK-2 cells. Scale bar: 100 μm. G Light microscopy on the morphology of indicated HK-2 cells. Scale bar: 100 μm. H, I Western blot (H) and qRT-PCR (I) on fascin-1 expression. *P < 0.05, **P < 0.01 and ***P < 0.001
Fig. 4
Fig. 4
CircACTR2 sponges miR-561 in macrophages. A qRT-PCR to detect miR-561 expression from indicated THP-1 macrophages. B Bioinformatic analysis revealed a potential binding site between circACTR2 and miR-561. C Luciferase assay to examine the impacts of mimics NC or miR-561 mimics on reporter expression controlled by wild-type (WT) or mutated (MUT) circACTR2 binding sequences. D RNA immunoprecipitation to detect the association of circACTR2 and miR-561 using anti-Ago2 antibody or IgG (as the negative control). E FISH assay to detect the co-localization of circACTR2 and miR-561 in THP-1 macrophages. Cell nuclei were stained with DAPI. Scale bar: 100 μm. **P < 0.01 and ***P < 0.001
Fig. 5
Fig. 5
CircACTR2 acts on macrophages and TECs by targeting miR-561. A MiR-561 level from indicated THP-1 macrophages was measured by qRT-PCR. B Pyroptosis (caspase-1+/PI+) of indicated THP-1 macrophages was examined by flow cytometry. C Western blot on pyroptosis biomarkers GSDMDNterm, NLRP3, ASC, cleaved caspase-1, and IL-1β. D ELISA to measure the production of IL-1β into the culture medium (supernatant). E to H Upon treating HK-2 cells with indicated THP-1 macrophages-derived conditioned medium, or IL-1β (positive control), western blot on indicated proteins (E), immunofluorescence to detect E-cadherin and N-cadherin (F), western blot (G) and qRT-PCR (H) on fascin-1 expression. Scale bar: 100 μm. *P < 0.05, **P < 0.01 and ***P < 0.001
Fig. 6
Fig. 6
MiR-561 directly targets NLRP3 to inhibit pyroptosis in macrophages. A Targetscan analysis revealed a putative binding site between miR-561 and NLRP3. B to C. After transfecting miR-561 mimics and inhibitor into THP-1 cells, respectively, NLRP3 expression was examined by qRT-PCR (B) and western blot (C). D Luciferase activity regulated by wild-type (WT) or mutated (MUT) NLRP3 binding sequences was measured in response to mimics NC or miR-561 mimics. qRT-PCR to detect miR-561 (E) and NLRP3 (F). G Western blot to examine NLRP3 protein. H Flow cytometry to examine pyroptosis (% of caspase-1+/PI+ cells). I Western blot on pyroptosis biomarkers GSDMDNterm, ASC, cleaved caspase-1, and IL-1β. J ELISA on IL-1β in the culture medium (supernatant). *P < 0.05, **P < 0.01 and ***P < 0.001
Fig. 7
Fig. 7
MiR-561 directly targets NLRP3 to inhibit fibrosis or EMT of TECs. In response to conditioned medium from indicated THP-1 macrophages or IL-1β, protein expressions of α-SMA, collagen I, E-cadherin, N-cadherin, and slug were measured by western blot (A), E-cadherin and N-cadherin were examined by immunofluorescence (B), and fascin-1 expression was examined by western blot (C) and qRT-PCR (D). Scale bar: 100 μm. *P < 0.05, **P < 0.01 and ***P < 0.001
Fig. 8
Fig. 8
Fascin-1 essentially mediates the IL-1β-induced fibrosis and EMT of TECs. HK-2 cells were transfected with sh-NC or sh-fascin-1 and treated with IL-1β. A-B. Fascin-1 was examined by western blot (A) and qRT-PCR (B). C Expressions of α-SMA, collagen I, E-cadherin, N-cadherin, and slug were measured by western blot. D E-cadherin and N-cadherin were detected by immunofluorescence. Scale bar: 100 μm. E Cell morphology was examined by light microscopy. Scale bar: 100 μm. *P < 0.05, **P < 0.01 and ***P < 0.001
Fig. 9
Fig. 9
Knocking down circACTR2 or up-regulating miR-561 ameliorates renal fibrosis in vivo. UUO surgery was performed on mice, which then received intravenous injection of lentivirus expressing sh-NC, sh-circACTR2, mimics NC, or miR-561 mimics. Sham-operated mice were used as the negative control. Kidneys were isolated on day 10 from either UUO mice or sham-operated mice. 10 mice were included in each group. A HE and Masson trichrome staining were performed on renal tissues from indicated mice. Scale bar: 100 μm. B Serum creatinine, blood urea nitrogen, and urinary albumin levels were measured from indicated mice. C ELISA to measure serum IL-1β level. D IL-1β expression was examined by qRT-PCR in kidneys. E Fascin-1, fibrosis markers (α-SMA and collagen I), EMT markers (E-cadherin, N-cadherin, and slug), and NLRP3 were detected by western blot. F IHC to detect E-cadherin and N-cadherin. G The ratio of left kidney/body weight in each group. H qRT-PCR to measure expression levels of circACTR2, miR-561, and NLRP3. *P < 0.05, **P < 0.01 and ***P < 0.001

Similar articles

Cited by

References

    1. Nogueira A, Pires MJ, Oliveira PA. Pathophysiological mechanisms of renal fibrosis: a review of animal models and therapeutic strategies. In Vivo. 2017;31(1):1–22. doi: 10.21873/invivo.11019. - DOI - PMC - PubMed
    1. Jager KJ, Kovesdy C, Langham R, Rosenberg M, Jha V, Zoccali C. A single number for advocacy and communication-worldwide more than 850 million individuals have kidney diseases. Kidney Int. 2019;96(5):1048–1050. doi: 10.1016/j.kint.2019.07.012. - DOI - PubMed
    1. Humphreys BD. Mechanisms of renal fibrosis. Annu Rev Physiol. 2018;80:309–326. doi: 10.1146/annurev-physiol-022516-034227. - DOI - PubMed
    1. Zhong J, Yang HC, Fogo AB. A perspective on chronic kidney disease progression. Am J Physiol Renal Physiol. 2017;312(3):F375–F384. doi: 10.1152/ajprenal.00266.2016. - DOI - PMC - PubMed
    1. Grande MT, Sanchez-Laorden B, Lopez-Blau C, De Frutos CA, Boutet A, Arevalo M, et al. Snail1-induced partial epithelial-to-mesenchymal transition drives renal fibrosis in mice and can be targeted to reverse established disease. Nat Med. 2015;21(9):989–997. doi: 10.1038/nm.3901. - DOI - PubMed