. 2022 Apr;8(4):373-388.
doi: 10.1038/s41477-022-01127-9. Epub 2022 Apr 21.

Genomes of leafy and leafless Platanthera orchids illuminate the evolution of mycoheterotrophy

Affiliations

Genomes of leafy and leafless Platanthera orchids illuminate the evolution of mycoheterotrophy

Ming-He Li et al. Nat Plants. 2022 Apr.

Abstract

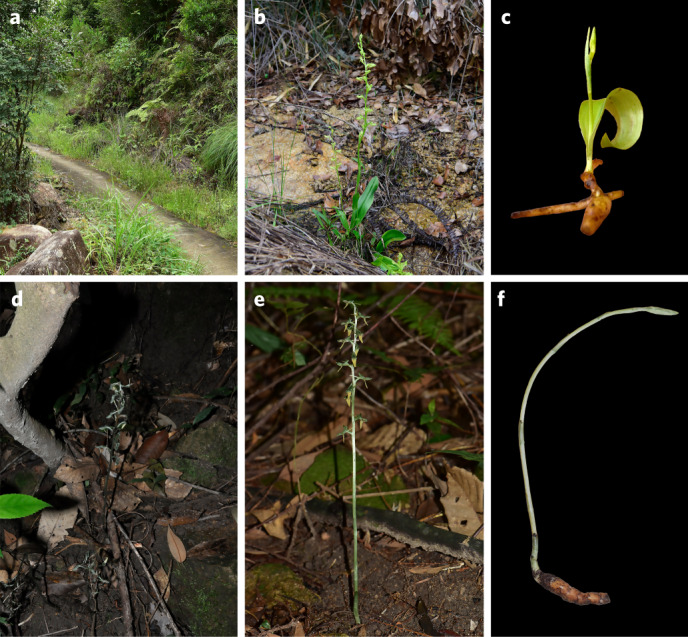
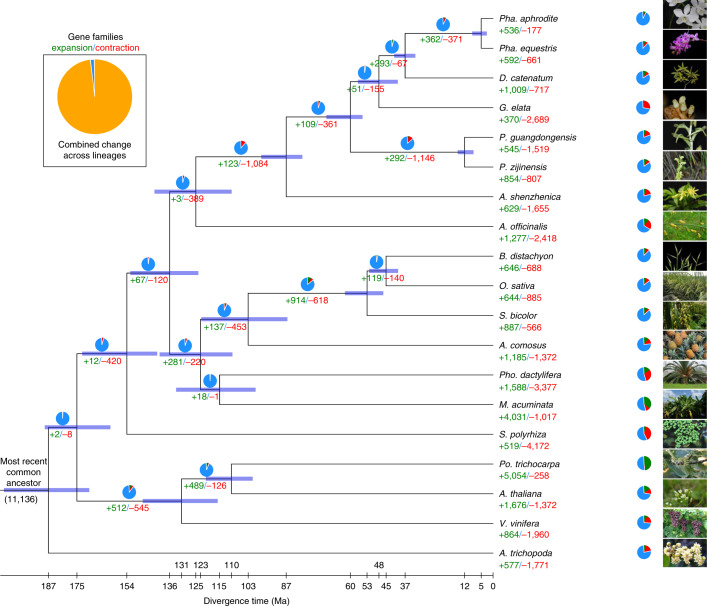
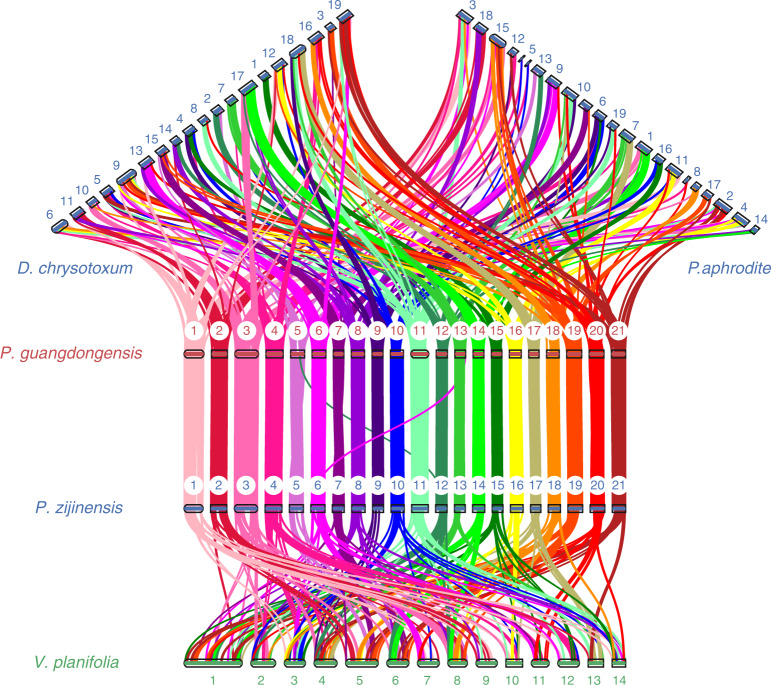
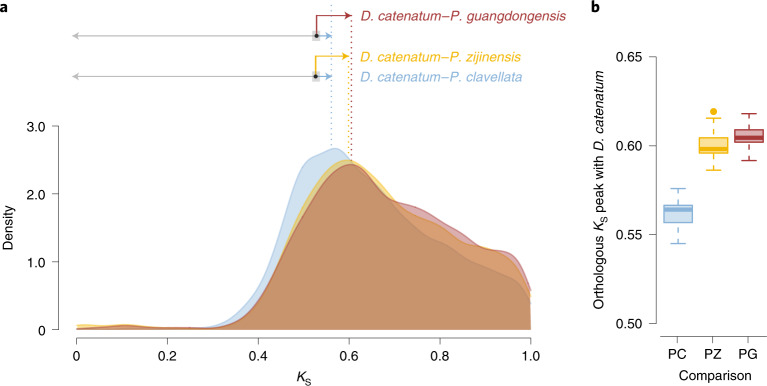
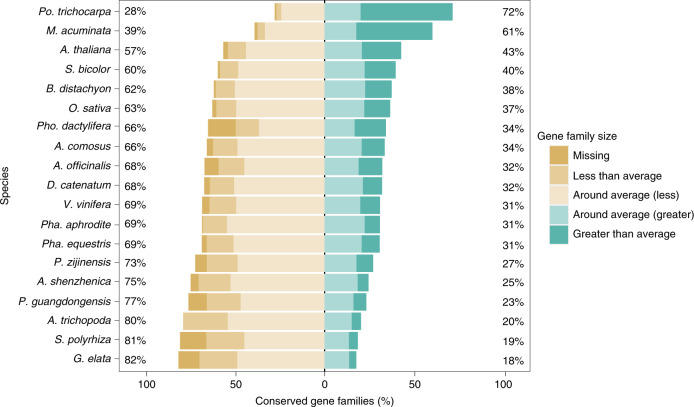
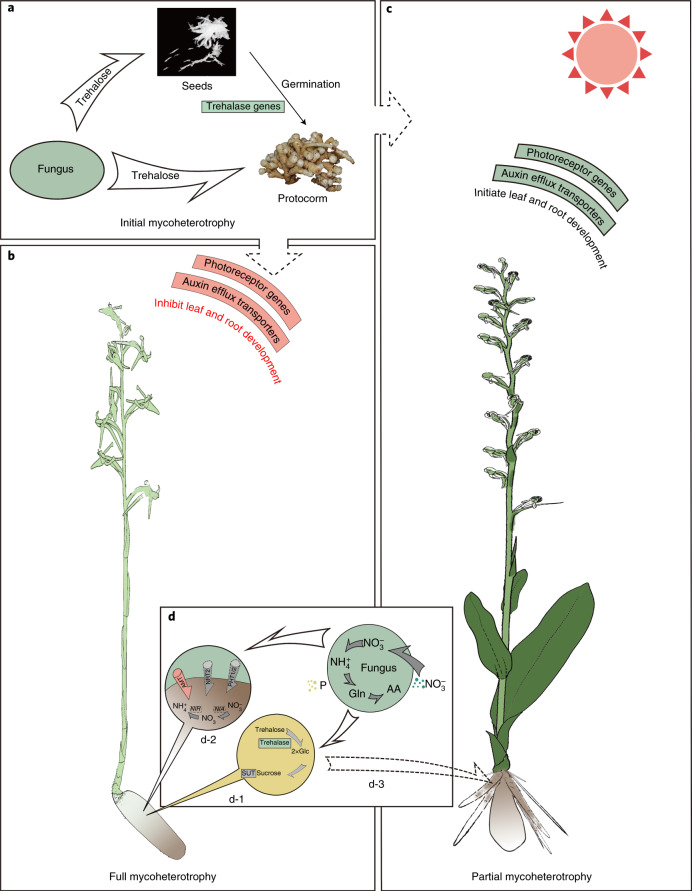
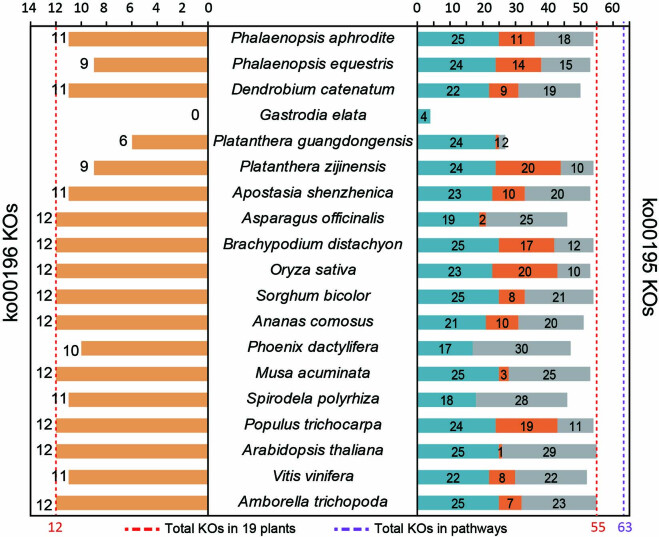
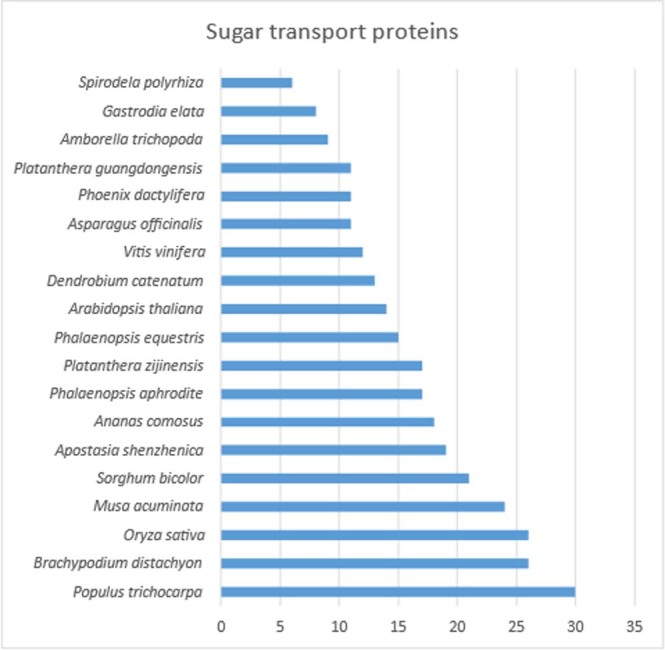
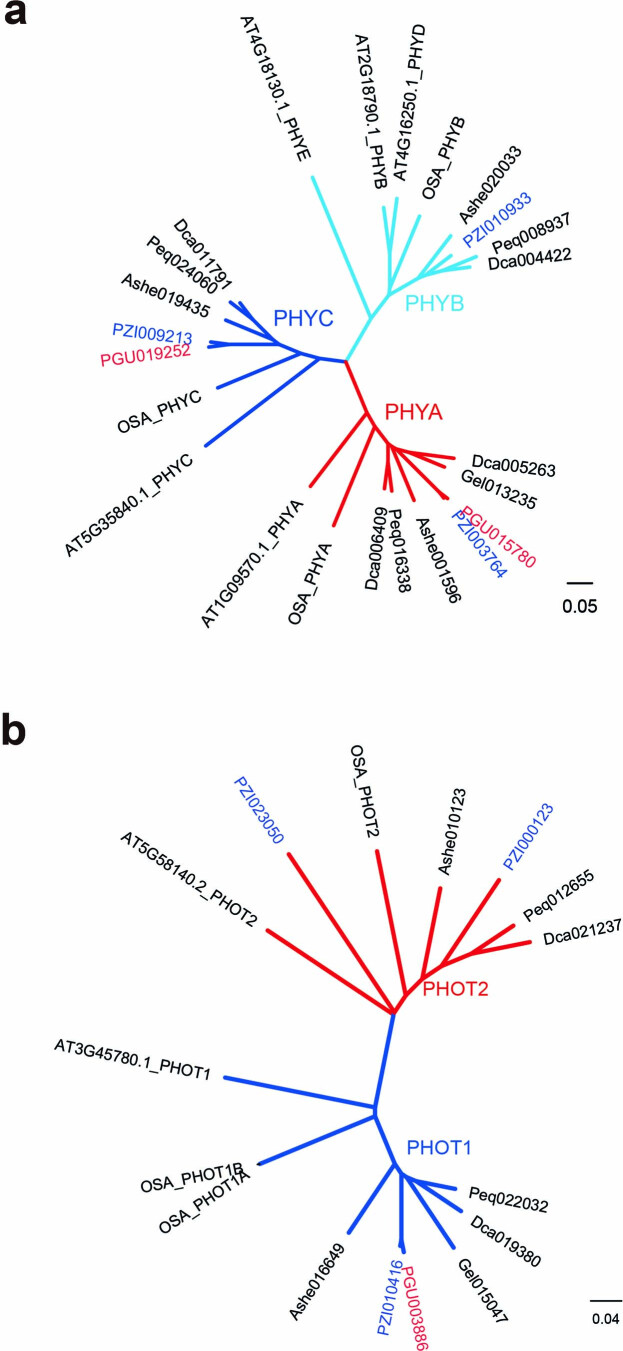
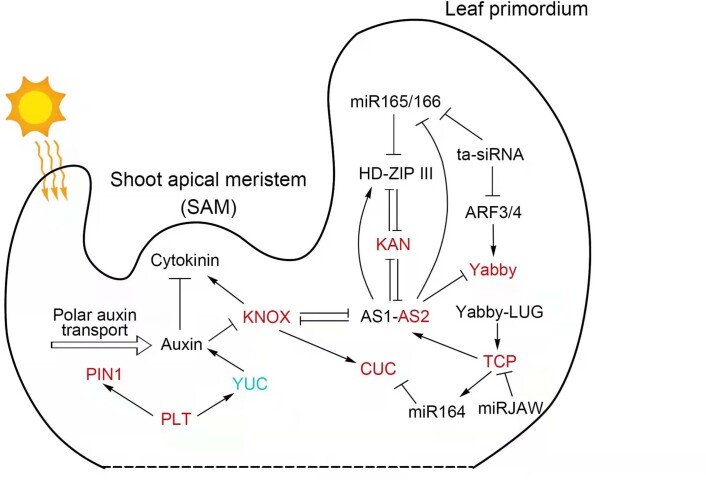
To improve our understanding of the origin and evolution of mycoheterotrophic plants, we here present the chromosome-scale genome assemblies of two sibling orchid species: partially mycoheterotrophic Platanthera zijinensis and holomycoheterotrophic Platanthera guangdongensis. Comparative analysis shows that mycoheterotrophy is associated with increased substitution rates and gene loss, and the deletion of most photoreceptor genes and auxin transporter genes might be linked to the unique phenotypes of fully mycoheterotrophic orchids. Conversely, trehalase genes that catalyse the conversion of trehalose into glucose have expanded in most sequenced orchids, in line with the fact that the germination of orchid non-endosperm seeds needs carbohydrates from fungi during the protocorm stage. We further show that the mature plant of P. guangdongensis, different from photosynthetic orchids, keeps expressing trehalase genes to hijack trehalose from fungi. Therefore, we propose that mycoheterotrophy in mature orchids is a continuation of the protocorm stage by sustaining the expression of trehalase genes. Our results shed light on the molecular mechanism underlying initial, partial and full mycoheterotrophy.


Conflict of interest statement

The authors declare no competing interests.

Figures

Fig. 1
Fig. 1. The natural habitat and appearance of P. zijinensis and P. guangdongensis.
a, The natural habitat of P. zijinensis. b, Flowering plant of P. zijinensis growing on the open terrain. c, P. zijinensis plant with tubercles, root and leaf. d, The natural habitat of P. guangdongensis. e, Flowering plant of P. guangdongensis growing in a shady forest understory. f, P. guangdongensis plant without root and leaf but with an underground stem (tuber).
Fig. 2
Fig. 2. Phylogenetic tree showing divergence times and the evolution of gene-family sizes.
Phylogenetic tree showing the topology and divergence times for 19 plant species. Divergence times are indicated by light blue bars at the internodes. The range of the light blue bars indicates the 95% highest posterior density of the divergence time. Numbers in green and red at branches indicate the expansion and contraction of gene families, respectively. The pie chart colours represent the changes of gene family (blue, no significant change; orange, expanded or contracted; green, expanded; red, contracted); each colour sector illustrates the proportion of each type of gene-family change. We set different birth and death rates for different branches (Poaceae, Orchidaceae, other monocots and the other branches) and used the likelihood ratio test to select the optimized sets of rates (Methods).
Fig. 3
Fig. 3. Chromosome structure and collinearity of Pha. aphrodite, D. chrysotoxum, V. planifolia, P. zijinensis and P. guangdongensis.
Chromosome comparison for P. zijinensis and P. guangdongensis shows almost perfect collinearity except for two rearrangements within Chr 5 and Chr 7, and two translocations (see also Supplementary Fig. 6). In comparison with P. zijinensis and P. guangdongensis, the differences in chromosome number of three other orchid genomes exhibited major chromosome rearrangement events.
Fig. 4
Fig. 4. Increased synonymous substitution rates in P. zijinensis and P. guangdongensis.
a, Kernel-density estimates (KDEs) of KS distributions for one-to-one orthologues between D. catenatum and three Platanthera orchids, namely P. guangdongensis, P. zijinensis and P. clavellata. As the modes (peaks) of the KDE all represent the distances between D. catenatum and the compared orchids, the differences observed among the KS values of the modes indicate substitution rate variations among these Orchidaceae lineages. The segments with arrows above the KDE denote, from bottom to top, the KS distances calculated for P. zijinensis (yellow) and P. guangdongensis (red) using P. clavellata (blue) as the reference and D. catenatum as the outgroup (Methods). The dotted lines align with the observed modes in the KDE of the ortholog KS distributions. The black dots on the segments represent the divergence between P. clavellata with the other two Platanthera orchids; hence, the lengths of segments pointed to the right show the KS accumulated in P. zijinensis and P. guangdongensis, whereas the grey segments pointed to the left show the KS distance between D. catenatum and the divergence of the three Platanthera orchids. The grey rectangles show the 95% confidence intervals of the KS inferred from 200 bootstraps. b, Boxplots showing modes of the one-to-one orthologous KS distributions between D. catenatum and P. clavellata (PC), D. catenatum and P. zijinensis (PZ) and D. catenatum and P. guangdongensis (PG) by resampling the corresponding KS distributions 200 times. The line in the middle of a box represents the median value and the top and bottom borders of the boxes denote the 75th and 25th percentiles, respectively. The upper and lower bars show the largest value within 1.5 times the interquartile range above the 75th percentile and the smallest value within 1.5 times the interquartile range below the 25th percentile, respectively. A dot shows the outside value, which is >1.5 times and <3 times the interquartile range beyond either end of the box.
Fig. 5
Fig. 5. Gene loss in the genomes of P. guangdongensis and G. elata.
For all the investigated species, we compared the size of each gene family with the average size of a gene family through calculating the F index (Methods). The F index for gene family ranges from 0 to 1, with 0.5 representing the size of a gene family in a species to be exactly equal to its average size. We hence classified 8,423 gene families that exist in 16 out of 19 angiosperm species and have homologues from A. trichopoda into five categories: “Missing” with F index equal to 0; “Less than average” with F index greater than 0 but less than or equal to 0.45; “Around average (less)” with F index greater than 0.45 but less than or equal to 0.5; “Around average (greater)” with F index greater than 0.5 but less than or equal to 0.55; and “Greater than average” with F index greater than 0.55. The bar plot illustrates the percentage of the conserved gene families in each category and the values on the left and right sides show the percentages of the gene families that are smaller and larger than the average size, respectively. See Extended Data Fig. 2 for the number of missing gene families in each species.
Fig. 6
Fig. 6. The potential molecular mechanisms of mycoheterotrophy in orchids.
a, Initial mycoheterotrophy. The seeds of orchids do not have endosperms and their germination depends on absorbing carbohydrates, such as trehalose, from their associated fungi. Trehalose is a disaccharide in fungi that has similar roles to sucrose in plants. In contrast to other sequenced plant genomes, most orchid genomes have multiple copies of trehalase genes (Supplementary Table 34), which digest a molecule of trehalose into two molecules of glucose (d-1). The seeds develop into protocorms, which keep using the carbohydrates from fungi until they can perform photosynthesis. b, Full mycoheterotrophy. Leaflessness of P. guangdongensis may be related to the loss of most photoreceptor genes and auxin efflux transporters such as PINs, because light signals are essential for leaf initiation and positioning through redistribution of auxin to the incipient primordia. The development of roots also relies on light signals and photosynthesis. In addition, transcription factors involved in root development, such as CPC, TRY and ETC1-like genes, are missing in P. guangdongensis, which may correlate with its rootless phenotype. c, Partial mycoheterotrophy. In contrast to full mycoheterotrophy, partially mycoheterotrophic orchids have similar numbers of photoreceptors and auxin efflux transporters, which are important for the development of leaves, to Pha. equestris and D. catenatum. P. zijinensis has all the transcription factors involved in root development as well as the AGL12 genes. d, Obtaining nutrients from fungi. Fully mycoheterotrophic orchids keep expressing trehalase genes as protocorms to digest trehalose into glucose (Glc), which is further converted into sucrose and transported by SUTs throughout the plant body (d-1). Mycoheterotrophic orchids also have fewer nitrogen and phosphorus transmembrane transporters, such as AMT, NRT2 and PHT1/2, than Pha. equestris and D. catenatum. Furthermore, NIA and NIR genes are missing in the G. elata genome and have low expression in P. guangdongensis, suggesting that these orchids may only obtain nitrogen in the forms of ammonium (NH4+) and/or glutamine (Gln) and amino acid (AA) from fungi but cannot absorb nitrate (NO3) from soil (d-2). As a partially mycoheterotrophic orchid, P. zijinensis can perform photosynthesis and obtains trehalose from its associated fungi (d-3).
Fig. 7
Fig. 7. Expression patterns of trehalase in different stages of C. goeringii.
a, Different development stages including rhizome (stage 1), rhizome with branches (stage 2), small seedling (stage 3) and older seedling (stage 4), abbreviated as S1 to S4, respectively. Expression patterns of trehalase genes c249696_g1_i4 (CL09234 (ref. )) (b) and c232459_g1_i2 (CL20246 (ref. )) (c) in different stages. The line in the middle of a box represents the median value and the top and bottom borders of the boxes denote the 75th and 25th percentiles, respectively. The upper and lower bars show the largest value within 1.5 times the interquartile range above the 75th percentile and the smallest value within 1.5 times the interquartile range below the 25th percentile, respectively. A dot shows the corresponding data points. Different letters represent significant differences by one-way ANOVA with Duncan’s post hoc test (P < 0.05).
Extended Data Fig. 1
Extended Data Fig. 1. The orthologous Ks distributions.
Modes of the one-to-one orthologous Ks distributions between A. shenzhenica and each of G. elata (GE), P. guangdongensis (PG), P. zijinensis (PZ), P. clavellate (PC), Pha. equestris (PE), Pha. aphrodite (PA), and D. catenatum (DC) by resampling the corresponding Ks distributions 200 times. The line in the middle of a box represents the median value and the up and bottom borders of the boxes denote the 75th and 25th percentiles, respectively. The upper and lower bars show the largest value within 1.5 times interquartile range above 75th percentile and the smallest value within 1.5 times interquartile range below 25th percentile, respectively. A dot shows outside value, which is > 1.5 times and < 3 times the interquartile range beyond either end of the box.
Extended Data Fig. 2
Extended Data Fig. 2. The missing gene families.
Number of missing gene families in sequenced plant genomes.
Extended Data Fig. 3
Extended Data Fig. 3. Orthologs in the pathways of Photosynthesis.
Orthologs from 19 species in the pathways of Photosynthesis - antenna proteins (ko00196 for green plants, left) and Photosynthesis (ko00195, right). Bar colors from left to right: dark yellow, the KOs only found in nuclear genome in ko00196; cyan, the KOs that only found in nuclear genome in ko00195; orange, the KOs found in both nuclear and chloroplast genomes in ko00195; grey, the KOs only found in chloroplast genome in ko00195.
Extended Data Fig. 4
Extended Data Fig. 4. The sugar transport proteins.
Number of sugar transport proteins in sequenced plant genomes.
Extended Data Fig. 5
Extended Data Fig. 5. Phylogenetic analysis of phytochromes (PHY) and phototropins (PHOT) in different orchids.
a. PHY. b. PHOT. AT, Arabidopsis thaliana; OSA, Oryza sativa; Ashe, Apostasia shenzhenica; Gel, Gastrodia elata; Dca, Dendrobium catenatum; Peq, Phalaenopsis equestris; PZI, Platanthera zijinensis; PGU, Platanthera guangdongensis.
Extended Data Fig. 6
Extended Data Fig. 6. The regulatory network involved in Arabidopsis leaf initiation and development, and P. guangdongensis and G. elata contraction (loss) genes of involved in leaf initiation and development.
The regulatory network was modified according to three review papers,,. The transition of cells in the shoot apical meristem (SAM) from a pluripotent fate to a determinate fate is necessary for plant leaf initiation. SAM is maintained by the class I KNOX homeodomain transcription factor through the activation of cytokinin signalling and repression of asymmetric leaves1 (AS1) and AS2, which are involved in organogenesis. The leaf organ initiates from the sites where the expression of KNOX is downregulated and auxin maxima are established via polar localization of PIN1, the auxin efflux carrier. Light is necessary for leaf initiation. Without light, polar localization of PIN1 is lost, and leaf production ceases. The PLETHORA (PLT) transcription factors PLT3, PLT5, and PLT7, have been reported to be required for proper expression of PIN1 and YUC1/4. AS1 and AS2 form a complex and repress the expression of Yabby, KAN, and miR165/166. Yabby gene expression is essential for the switch of the SAM program to the leaf-specific program. In addition, Yabby interacts with LUG to promote the expression of Class II TCP genes which are involved in lamina development. The AS1 and CUC genes are regulated by Class II TCPs to control lamina development. The Arabidopsis genes regulating leaf initiation and development in this figure were used as queries to identify orthologous genes in the genomes of P. guangdongensis, P. zijinensis, G. elata, A. shenzhenica, D. catenatum, and Pha. equestris (Supplementary Table 30). The genes indicated in red are lost or contracted in P. guangdongensis and G. elata, whereas those in blue are lost in G. elata. ARF: auxin-responsive factor; CUC: CUP-SHAPED COTYLEDON; KAN: KANADI; KNOX: KNOT-TED-like homeobox (STM, BP/KNAT1, KNAT2, KNAT6); LUG: LEUNIG; PIN1: PIN-FORMED 1; YUC: YUCCA.
Extended Data Fig. 7
Extended Data Fig. 7. The phylogenetic tree of the TCP transcription factor families.
The TCP sequences in different plant species were isolated based on BLAST analysis using Arabidopsis TCP genes as queries (Supplementary Table 30). The clades were labelled by subfamily category. The purple highlight is the Class II-CIN clade. The blue and red fonts represent the sequences of P. guangdongensis (PGU) and P. zijinensis (PZI), respectively. The black font represents the sequences of rice (labelled LOC), Arabidopsis (AT), G. elata (Gel), D. catenatum (Dca), and Pha. equestris (Peq). Bootstrap values are shown on each node.
Extended Data Fig. 8
Extended Data Fig. 8. Phylogenetic tree of trehalase genes.
Phylogenetic tree of trehalase genes in orchids and monocots.
Extended Data Fig. 9
Extended Data Fig. 9. Expression patterns of NIA and NIR genes.
Expression patterns of NIA and NIR genes in various organs of P. zijinensis and P. guangdongensis, which are performed in three replicates. The means of expression value are shown above the bar differ; the error bars indicate the ±SDs of three biological replicates.
Extended Data Fig. 10
Extended Data Fig. 10. The expression of glutamine synthetase (GS) and glutamate synthase (GOGAT) in tubers of P. guangdongensis and G. elata.
a. The expression of GS; b. The expression of GOGAT. The means of expression value are shown above the bar differ; the error bars indicate the ±SDs of three biological replicates.

Comment in

  • Turning to the dark side.
    Givnish TJ. Givnish TJ. Nat Plants. 2022 Apr;8(4):324-325. doi: 10.1038/s41477-022-01132-y. Nat Plants. 2022. PMID: 35449402 No abstract available.

References

    1. Leake JR. The biology of myco-heterotrophic (‘saprophytic’) plants. New Phytol. 1994;127:171–216. - PubMed
    1. Merckx, V. Mycoheterotrophy, the Biology of Plants Living on Fungi (Springer, 2013).
    1. Merckx V, Bidartondo MI, Hynson NA. Myco-heterotrophy: when fungi host plants. Ann. Bot. 2009;104:1255–1261. - PMC - PubMed
    1. Bidartondo MI. The evolutionary ecology of myco-heterotrophy. New Phytol. 2005;167:335–352. - PubMed
    1. Bidartondo MI, et al. Changing partners in the dark: isotopic and molecular evidence of ectomycorrhizal liaisons between forest orchids and trees. Proc. R. Soc. Lond. B. 2004;271:1799–1806. - PMC - PubMed