. 2022 Apr;8(4):402-418.
doi: 10.1038/s41477-022-01125-x. Epub 2022 Apr 21.

R-loops at microRNA encoding loci promote co-transcriptional processing of pri-miRNAs in plants

Affiliations

R-loops at microRNA encoding loci promote co-transcriptional processing of pri-miRNAs in plants

Lucia Gonzalo et al. Nat Plants. 2022 Apr.

Abstract

In most organisms, the maturation of nascent RNAs is coupled to transcription. Unlike in animals, the RNA polymerase II (RNAPII) transcribes microRNA genes (MIRNAs) as long and structurally variable pri-miRNAs in plants. Current evidence suggests that the miRNA biogenesis complex assembly initiates early during the transcription of pri-miRNAs in plants. However, it is unknown whether miRNA processing occurs co-transcriptionally. Here, we used native elongating transcript sequencing data and imaging techniques to demonstrate that plant miRNA biogenesis occurs coupled to transcription. We found that the entire biogenesis occurs co-transcriptionally for pri-miRNAs processed from the loop of the hairpin but requires a second nucleoplasmic step for those processed from the base. Furthermore, we found that co- and post-transcriptional miRNA processing mechanisms co-exist for most miRNAs in a dynamic balance. Notably, we discovered that R-loops, formed near the transcription start site region of MIRNAs, promote co-transcriptional pri-miRNA processing. Furthermore, our results suggest the neofunctionalization of co-transcriptionally processed miRNAs, boosting countless regulatory scenarios.


Conflict of interest statement

The authors declare no competing interests.

Figures

Fig. 1
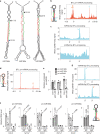
Fig. 1. Subcellular distribution and interactions of nascent pri-miRNAs and the miRNA biogenesis complex.
a, Detection (FISH) of pri-miR156a and pri-miR163 (green) using digoxigenin-labelled probes and antibodies targeting digoxigenin. The probes hybridizing to intron, exon and transcripts after splicing (exon/exon) were applied, while hybridization buffer without any probe was used as a negative control. b, Detection (FISH) of pri-miR156a using RNA Stellaris probes (magenta) combined with the immunolocalization of RNAPII phosphorylated at Ser5, RNAPII phosphorylated at Ser2 and newly synthesized transcripts (green). The fluorescence intensity is plotted along the white line shown in the images. On the right, the fluorescence intensity of pri-miR156a is depicted as the magenta curve, while RNAPII Ser5, RNAPII Ser2 and 5-BrU are shown as the green curves. c, Detection (FISH) of pri-miR156a using RNA Stelaris probes (magenta) combined with the immunolocalization of HYL1 and DCL1. d, Detection (FISH) of pri-mR156a and pri-miR163 using digoxigenin-labelled probes and antibodies targeting digoxigenin, combined with the immunolocalization of D-bodies with anti-DCL1. The stringency and acquisition parameters of this FISH experiment were adjusted to focus only on well-defined structures (D-bodies and transcription sites). e,f, Detection (FISH) of pri-miR156a using RNA Stellaris (green) (e), as well as the immunolocalization of HYL1 or DCL1 (green) (f) in nuclei of WT plants treated with α-amanitin (α-ama) or PBS as a negative control. White arrows mark D-bodies. For af: scale bar, 2.5 μm. g, Distribution of HYL1-YFP (upper), MTA-GFP (middle) and mCherry-AGO (bottom) in the root meristematic zone cells of plants treated with α-amanitin or PBS (negative control). On the right, the magnification of representative images of root meristematic zone cells is presented. White arrows mark D-bodies. Scale bar, 10 µm. In all images, DNA was stained with Hoechst (blue). In all cases, the microcopy observations were validated in at least three independent experiments.
Fig. 2
Fig. 2. Plant pri-miRNAs are processed co-transcriptionally.
a, Detection of nascent pri-miRNA processing intermediates associated with RNAPII as detected by 5’-RACE. The fraction of clones with the expected 5’-end (among all the sequenced products) is indicated next to the predicted pri-miRNAs secondary structures. The miRNA-5p and miRNA-3p positions are noted in red and green, respectively. The values displayed were obtained from two independent experiments. b,c,d,g, Metagene analysis of nascent BTL pri-miRNAs processing fragments associated to RNAPII. bd, Metagene analysis of nascent BTL pri-miRNAs processing intermediated associated to RNAPII as determined by scoring the 5’-end (b and c) or 3’-end (d and g) nt of plaNET-seq reads. Pri-miRNAs were scaled from the beginning of miRNA-5p to the end of miRNA-3p (b and d) or using only the mature miRNAs sequences (c and g). Cyan and orange arrows indicate the processing fragments detected also marked in the schemes illustrated next to b and d. e, Levels of the 5’-arm processing by-product of different pri-miRNAs associated with the chromatin in Col-0 and abh1-285 mutants as measured by RT–qPCR. Each processing by-product associated with the chromatin in the RIP experiment was normalized by the values in the input sample and relative to the normalized unprocessed pri-miRNAs in the same IP fraction. Values of n = 3 biologically independent samples are expressed relative to the Col-0 plants. Data are presented as mean values ± s.d. P values were calculated with two-tailed unpaired t-test with Welch’s correction. f, Co-transcriptional pri-miRNA processing score as measured by RT–qPCR in H3 or IgG IP RNA-samples from Col-0 and hyl1-2. Data are presented as mean values ± s.d. P values were calculated with two-tailed unpaired t-test with Welch’s correction and are noted for each comparison. RT–qPCR using primer pairs A, B and C in the IP fraction were normalized to U6 transcript and to the input levels using the same primers. Co-transcriptional processing was measured as a reduction in the hairpin amplicon (primer B) relative to the 5′ region (amplicon A). Non-detected RNA levels are displayed as ND; n = 3 biologically independent samples.
Fig. 3
Fig. 3. Co-transcriptional processing of BTL pri-miRNAs involves a second nucleoplasmic processing step.
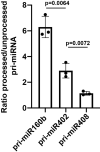
a,b,g, Metagene analysis of processing fragments on nascent LTB (a), LTBs (b) and BTLs (g) pri-miRNAs as determined by scoring the 3′-end nt of plaNET-seq reads. c,d, Metagene analysis of processing fragments on nascent LTB (c) and LTBs (d) as shown in a and b but excluding selected miRNA loci. Pri-miRNAs were scaled from the beginning of miRNA-5p, or from the first DCL1 cleavage site for g, to the end of miRNA-3p. Arrows indicate the processing fragments detected for each processing type as illustrated in the schematic representation of LTB and LTBs and BTLs pri-miRNAs. A peak corresponding to an exon donor site of AT1G12290 is noted with a black arrow in g and Extended Data Fig. 3f. e, Metagene analysis of plaNET-seq LTB and LTBs scaled using the miRNA-3p sequence (top). Orange arrow matches the arrow in b. Metagene of entire plaNET-seq reads coverage over LTB and LTBs MIRNA loci, at the miRNA-3p encoding regions, showing the accumulation of 21-nt long reads corresponding to the miRNA-3p mature sequences (bottom). f, Mean plaNET-seq signal at the MIR156E and MIR159B loci (red bars). Coverage of plaNET-seq reads over the same loci (grey). The sequence corresponding to the mature miRNA-3p is noted on top of each panel highlighted in yellow. h, Relative abundance of BTL and LTB pri-miRNA hairpin region in the nucleoplasm compared to the H3 RIP fraction as measured by RT–qPCR in Col-0 samples. Data are presented as mean values ± s.d.; n = 3 biologically independent samples. P values were calculated with two-tailed unpaired t-test with Welch’s correction and are noted for each comparison. Processed hairpins measurements in the nucleoplasm and H3 IP fraction were normalized to the input levels for each samples. Quantifications were then expressed as a nucleoplasm/IP ratio of the values corrected by relative amount of unprocessed pri-miRNAs quantified with primers flanking the DCL1 cleavage site. i, Schematic summary of the co-transcriptional processing mechanisms of Arabidopsis pri-miRNAs. Coloured asterisks in each panel denote the plaNET-seq scored nts for each processing type and match the arrows of the same colours displayed in the previous panels and in Fig. 2.
Fig. 4
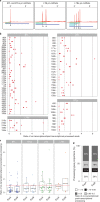
Fig. 4. Co-transcriptional and post-transcriptional processing co-exist for most pri-miRNAs.
a, Schematic representation of the positions used to quantify co-transcriptional versus post-transcriptional processing ratios. In all cases, total number of reads ending in the nt marked as 'a' (green lines) were expressed relative to reads expanding this site (blue lines). b, Co-transcriptional processing ratios corresponding to all analysed miRNAs in two independent plaNET-seq experiments and split by processing mechanism. c, Boxplot representation of the co-transcriptional processing ratios. Red line marks ratio = 1 where co- and post-transcriptional processing are equally frequent. ExpA and ExpB show two independent experiments, respectively, of n = 2 biologically independent samples each. Dots represent single data points, whiskers denote the minimum/maximum values (no further than 1.5× interquartile range (IQR) from the hinge), the box defines the IQR, the centre represents the median and box bounds represent the lower and upper quartiles. d, Fraction of pri-miRNAs preferentially processed co-transcriptionally, post-transcriptionally or with equal preference. Two independent experiments in control conditions.
Fig. 5
Fig. 5. Co-transcriptional miRNA processing ratios are variable in different conditions.
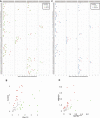
a,b, Boxplot representations of the co-transcriptional processing ratios in seedlings transfered to 4 °C for 12 h or kept at control conditions (a) or nrbp2 mutant plants expressing a WT version of the proteins or a mutation (Y732F) that confers enhanced processivity to the RNAPII (b). Red line marks ratio = 1 where co- and post-transcriptional processing are equally frequent. n = 2 biologically independent samples. Dots represent single data points, whiskers denote the minimum/maximum values (no further than 1.5× IQR from the hinge), the centre represents the median and box bounds represent the lower and upper quartiles. c, Superposition of metagene analysis of plaNET-seq pri-miRNA processing intermediated in control (red) or NRPB2Y732F transgenic plants (blue). Pri-miRNAs were scaled from the beginning of miRNA-5p to the end of miRNA-3p. d,e, Pri-miRNA co-transcriptional processing in Col-0 and hst-15 mutant plants as measured by RT–qPCR in RIP (d) or chromatin-depleted nucleoplasm samples (e). Co-transcriptional processing was measured as the relative abundance of the hairpin region (primers A) over the amount of unprocessed pri-miRNAs quantified with primers flanking the DCL1 cleavage site (primers B). Processing intermediates were normalized by the input and expressed relative to the IgG IP samples (red line). Data are presented as mean values ± s.d. P values were calculated with two-tailed unpaired t-test with Welch’s correction and are noted for each comparison. n = 3 biologically independent samples. ND, not detected. f, Scatter plot comparing the counts per million +1 (log scale) of mature miRNAs between WT (Col-0) and hst-15 mutants. Differentially expressed miRNAs are shown in red. MiRNAs with the largest ratio of co-transcriptional processing are noted individually. g, Dot-plot of AGO1-loaded miRNAs. MiRNAs in the AGO1-IP fraction as well as in the input samples were first expressed as a fraction of the total count of miRNAs in the respective sample. AGO1 loading preference for each miRNA is then expressed as the ratio of the frequency of a miRNA in the IP versus the input sample. MiRNAs with the largest ratio of co-transcriptional processing are noted individually.
Fig. 6
Fig. 6. R-loops distibution at pri-miRNA encoding loci.
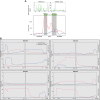
a, Schematic representation of the region scaled for metagene analysis of R-loop formation over MIRNA loci. MIRNA loci were scaled either from the TSS to the nt before miRNA-5p (green) or from miRNA-5p to the end of miRNA-3p (red). Metagene analysis was then plotted in b and d adding 300 base pairs upstream or downstream from the windows, respectively. b, Metagene analysis of sense (red) and antisense (blue) R-loops over all MIRNA loci. Metagene plots are scaled from the TSS to the nt before the first nt of miRNA-5p (upper panel) or from the first nt of miRNA-5p to the last of miRNA-3p. c, Quantification of R-loops near the TSS of MIRNAs belonging to different categories of R-loop pattern (defined in d) as measures by DRIP–qPCR assays. Values of DRIP samples are normalized to the input and expressed as relative to the DRIP signal in sample IP after RNase H treatment (red line). Failure to detect R-loops is noted as non-detected (ND). A known R-loop over SEPALLATA3 (SEP3) was used as positive control (C+) Data are presented as mean values ± s.d.; n = 3 biologically independent samples. d, Metagene analysis of R-loop formation over MIRNA loci sorted by R-loop distribution. α-MIRNA loci without R-loops; β-MIRNA loci with R-loops over the ssRNA 5’-end of the pri-miRNAs; γ-MIRNA loci with bipartite R-loop signals at the beginning and end of the pri-miRNAs; δ-MIRNA loci with R-loops over the entire loci; ε-MIRNA loci with colliding sense (red) and antisense (blue) R-loops. e, Boxplot of co-transcriptional processing ratios of pri-miRNAs with R-loop profiles of categories α, β + γ or δ + ε. Equal processing type frequency (=1) is marked with a dashed line. Error bars show the maximum and minimum values. P value of a two-tailed unpaired t-test; n = 2 biologically independent datasets. The box represents the Q3 and Q1 borders, with the median (horizontal line) and mean (white dot). Whiskers show larger and smaller values while coloured dots note outliers.
Fig. 7
Fig. 7. R-loops promote miRNA co-transcriptional processing.
a, Levels of the 5’-arm pri-miRNA-processed by-product of different pri-miRNAs associated with the chromatin as measured by RT–qPCR of H3 RIP samples. Col-0 isolated nuclei were treated with RNase H or mock solution for 1 h at 37 °C followed by 1 h at 23 °C before RIP. Each processing by-product associated with the chromatin in the RIP experiment was normalized by the values in the input sample and relative to the normalized unprocessed pri-miRNAs in the same IP fraction. Data are presented as mean values ± s.d. P values were calculated with two-tailed unpaired t-test with Welch’s correction. n = 4 biologically independent samples. b,c, R-loop profile and plaNET-seq signals on polycistronic miRNA clusters (b) and mirtron loci (c). Cyan arrows in the plaNET-seq plots indicate accurately detected processing site. Green arrows mark the positions where peaks would be expected if the corresponding pri-miRNA are co-transcriptionally processed. The positions of miRNA-5p and miRNA-3p are marked with blue boxes under the plaNET-seq plots. MiRNA precursor sequences within the containing locus are noted in grey within the R-loop profiles. Chromosome (Ch) positions are noted in the x-axis of the lower panels of b and c. d, R-loop profile over individual miRNA loci as detected in samples extracted from control plants (Ctrl, red line), plants incubated for 30 h at 17 °C (LCS) or at 37 °C (LHS), plants incubated for 30 h at 37 °C and then returned to 23 °C for 12 h (LHS12) or 84 h (LHS84). e, Retention levels of unprocessed pri-miRNAs in the H3 IP fraction (primers B) as measured by RT–qPCR and normalized by the input sample. Right: Retention levels of processed 5’-end arms of pri-miRNAs (primers C) in the IP sample normalized by the input sample as measured by RT–qPCR. In both panels the quantification was made in the plants incubated for 30 h at 37 °C plus 12 h at 12 °C (LHS12, grey bars) and expressed relative to the control samples (red line). Data are presented as mean values ± s.d. P values were calculated with two-tailed unpaired t-test with Welch’s correction and are noted for each comparison. n = 4 biologically independent samples.
Extended Data Fig. 1
Extended Data Fig. 1. Subcellular distribution of nascent pri-miRNAs and the miRNA biogenesis complex.
(a) Schematic diagram of pri-miRNA163 and pri-miRNA156a in A. thaliana. Colours indicate structural elements of pri-miRNA: exon (grey bar), intron (dark line), mature miRNA (red bar) and miRNA star (blue bar). The probes used are depicted as green above each scheme. (b) Detection (FISH) of pri-miRNA156a and pri-miR163 (green) using digoxigenin-labelled probes and antibodies targeting digoxigenin in nuclei of wild-type plant cells. The probes hybridizing to the loop (Loop), miRNAs star (miRNA*), and mature miRNA (miRNA) were applied. (c) Detection (FISH) of pri-miR156a using RNA Stellaris probes. Representative images of cell nuclei showing the subnuclear localization of pri-miRNA156a using RNA Stellaris probes labelled with Quasar 570 (top) or fluorescein 6-FAM (bottom). (d) Detection (FISH) of pri-miR156a (green) using the probe recognizing the intronic sequence of the precursor in the nuclei treated with RNase A or PBS (negative control). The fluorescence intensity is plotted along the white line shown on each merged image. (e) Detection (FISH) of pri-miR156a (red) using the intron-recognizing probe (Intron antisense probe) and the probe with the sequence identical with a fragment of intron (Intron sense probe). The fluorescence intensity is plotted along the white line shown on each merged image. (f) Immunolocalization of DCL1 and HYL1 (green) in nuclei of wild-type plant cells. Two types of distribution are shown: dispersed in the nucleoplasm (upper rows) and accumulated in D-bodies (lower rows). Percentage of nuclei with the dispersed distribution and the nuclei with visible D-bodies are shown on the right. (g) Co-localization of pri-miRNA156a with HYL1 and DCL1 in nuclei of A. thaliana cells. FISH of pri-miRNA156a (magenta) combined with immunolabeling of HYL1 or DCL1. Cells presenting a disperse or D-bodied localized DCL1 and HYL1 distribution are shown. On the right of each image is the fluorescence intensity plot along the white line draw in the microscopy picture. The fluorescence intensity of pri-miR156a is depicted as the magenta curve and HYL1/DCL1 as the green curve. (h) Detection (FISH) of pri-miR444 and pri-miR393a (red) combined with the localization of D-bodies using anti-HYL1 antibodies. The probe labelled with digoxigenin and antibodies targeting digoxigenin were used, and the experiment was performed on isolated wild-type cell nuclei. The stringency and acquisition parameters were adjusted to focus only on well-defined structures (D-bodies and transcription sites). In all cases, the nuclei were stained with Hoechst (blue). Scale bar −2.5 μm. In all cases the microcopy observations were validated in at least three independent experiments. (i) Distribution of hyl1 (left graph), dcl1 (right graph), in isolated cell nuclei from leaves of Arabidopsis plants treated with PBS (control) or α-amanitin. A one-way analysis of variance (ANOVA) with the Tukey‘s post hoc test was used for determining the statistical significance of the obtained results. Error bars indicate the means SD from 3 biological replicates (n = 20). (j) Distribution of HYL1-YFP in root meristematic cells in PBS (control) or α-amanitin treated Arabidopsis plants (in planta). A one-way analysis of variance (ANOVA) with the Tukey‘s post hoc test was used for determining the statistical significance of the obtained results. Error bars indicate the means SD of the results obtained from 14 roots treated with PBS or α-amanitin.
Extended Data Fig. 2
Extended Data Fig. 2. Plant pri-miRNAs are processed co-transcriptionally.
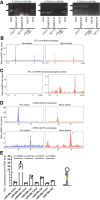
(a) Amplification of pri-miRNA processing intermediates associated with RNAPII as detected by 5’RACE. Bands noted with red arrows were cloned and used to score processing intermediates. Black lines on the left of the gels images mark the position of 100 pb and 250 pb molecular weight marker. (b, c, and d) Metagene analysis of nascent BTL pri-miRNAs processing intermediated associated to RNAPII as determined by scoring the 3’-end nucleotide in of plaNET-seq reads in the plus and minus strands of plaNET-seq samples (B and D) or plaNET-seq negative controls (C). Pri-miRNAs were scaled from the beginning of miRNA-5p to the end of miRNA-3p (B and C) or using only the mature miRNAs sequences (D). Cyan and orange arrows indicated the processing fragments detected also marked in Fig. 1. A scale identical to the plot displayed in Fig. 2d is shown in the left panel of (C) while a zoom in is shown in the right panel. (e) Unprocessed pri-miRNAs levels as measured by RT–qPCR in RNAPII IP RNA-samples from Col-0, and hst-15. Data are presented as mean values +/- SD. p-values were calculated with two-tailed unpaired T-Test with Welch’s correction and are noted for each comparison. n=3 biologically independent samples. RT–qPCR using primers designed to flank the basal cleavage site (noted at the right diagram) in the IP fraction were normalized to the input levels using the same primers. Source data
Extended Data Fig. 3
Extended Data Fig. 3. Co-transcriptional processing of BTL pri-miRNAs involves a second nucleoplasmic processing step.
(a-g) Metagene analysis of nascent pri-miRNAs processing intermediated associated to RNAPII as determined by scoring the 3’-end nucleotide of plaNET-seq reads. Metagene analysis of loop to base pri-miRNAs (A), sequential loop-to-base pri-miRNAs (B), individual LTB loci (C), filtered sequential loop-to-base pri-miRNAs (D), sequential base-to-loop pri-miRNAs (E), and MIR472 locus (F). In all cases colour arrows correspond to positions indicated in Fig. 3 and described in the result session. (F) The position of MIR472 within AT1G12290 is marked in yellow with the DCL1 cleavage site noted as a dashed line. AT1G12290.2 exons are noted with blue boxes. A peak mapping to the exon donor site is noted with a black arrow. (G) Metagene analysis of LTB, LTBs, and BTLs nascent pri-miRNAs processing intermediated in mock FLAG-IP negative controls samples. Left panels show a scale identical to the corresponding sample in Fig. 3 while right panels show a zoom in. (h) PlaNET-seq signal profile of miR161 which processing mechanisms was previous inferred BTL exclusive and now defined as dual BTL-LTB. Pri-miRNA was scaled from the beginning of miRNA-5p to the end of miRNA-3p. Colour arrows indicate DCL1 processing site marked in the adjacent schemes and in panel (I). (i) Predicted secondary structures of pri-miR161.1, and pri-miR161.2. Colour arrow heads indicate the position of plaNET-seq peaks displayed in panel (H). The sequence corresponding to the mature miRNA-5p is displayed in green and the miRNA-3p in red. Determined processing direction is noted with dashed arrows next to the structures. (j) Identification of co-transcriptional processing mechanisms of miR157d, miR2111b, and miR846 based on plaNET-seq signal profiles. Pri-miRNAs were scaled from the beginning of miRNA-5p to the end of miRNA-3p. Colour arrows indicate DCL1 processing site marked in the adjacent schemes. Light red arrows indicate expected cleavage sites not detected probably due to low coverage of the analysed loci. Cyan arrow in pri-miR2111b indicates a peak corresponding to retention of the mature miRNA-3p in the processing complex.
Extended Data Fig. 4
Extended Data Fig. 4. Comparison of Co-transcriptional miRNA-processed fragment associated to the chromatin on different MIRNA loci.
Levels of chromatin-associated 5′-processed pri-miRNAs by-products relative to the unprocessed pri-miRNAs as measured by RT–qPCR in H3 RIP samples. Data are presented as mean values +/- SD. p-values were calculated with two-tailed unpaired T-Test with Welch’s correction. n=3 biologically independent samples.
Extended Data Fig. 5
Extended Data Fig. 5. Co-transcriptional miRNA processing ratios are variable in different conditions.
(a and c) Co-transcriptional processing ratios corresponding to all analysed miRNAs in plaNET-seq experiments performed in control plants or in plants incubated 12 h at 4 °C (A) or transformed with a WT or Y732F mutant versions of NRPB2 (C) and split by processing mechanism. (b and d) Scatter plot representations of the co-transcriptional processing ratios in the same samples described above. Red and green dots show those pri-miRNAs with higher or lower co-transcriptionally processing ratios in control conditions.
Extended Data Fig. 6
Extended Data Fig. 6. R-Loops at the 5′ end of miRNA loci promotes co-transcriptional processing.
(a) R-loop profile and plaNET-seq signals on polycistronic miR842/846 cluster. Cyan arrows in the plaNET-seq plots indicate accurate detected processing site. Green arrows mark the positions where peaks would be expected if the corresponding pri-miRNA are co-transcriptionally processed. The position of miRNA-5p and -3p are marked with blue boxed under the plaNET-seq plots. MiRNA precursor sequences within the containing locus are noted in grey within the R-loop profiles. (b) R-loop formation over selected MIRNA loci either in the Watson (blue) or Crick (red) strands in samples prepared in studies using different developmental stages.

Comment in

Similar articles

Cited by

References

    1. Axtell MJ, Westholm JO, Lai EC. Vive la difference: biogenesis and evolution of microRNAs in plants and animals. Genome Biol. 2011;12:221. - PMC - PubMed
    1. Zhang Y, et al. Comparison of miRNA evolution and function in plants and animals. Microrna. 2018;7:4–10. - PubMed
    1. Cuperus JT, Fahlgren N, Carrington JC. Evolution and functional diversification of MIRNA genes. Plant Cell. 2011;23:431–442. - PMC - PubMed
    1. Szarzynska B, et al. Gene structures and processing of Arabidopsis thaliana HYL1-dependent pri-miRNAs. Nucleic Acids Res. 2009;37:3083–3093. - PMC - PubMed
    1. Achkar NP, Cambiagno DA, Manavella PA. miRNA biogenesis: a dynamic pathway. Trends Plant Sci. 2016;21:1034–1044. - PubMed

LinkOut - more resources