. 2022 Sep;40(9):1360-1369.
doi: 10.1038/s41587-022-01272-8. Epub 2022 Apr 21.

DestVI identifies continuums of cell types in spatial transcriptomics data

Affiliations

DestVI identifies continuums of cell types in spatial transcriptomics data

Romain Lopez et al. Nat Biotechnol. 2022 Sep.

Abstract

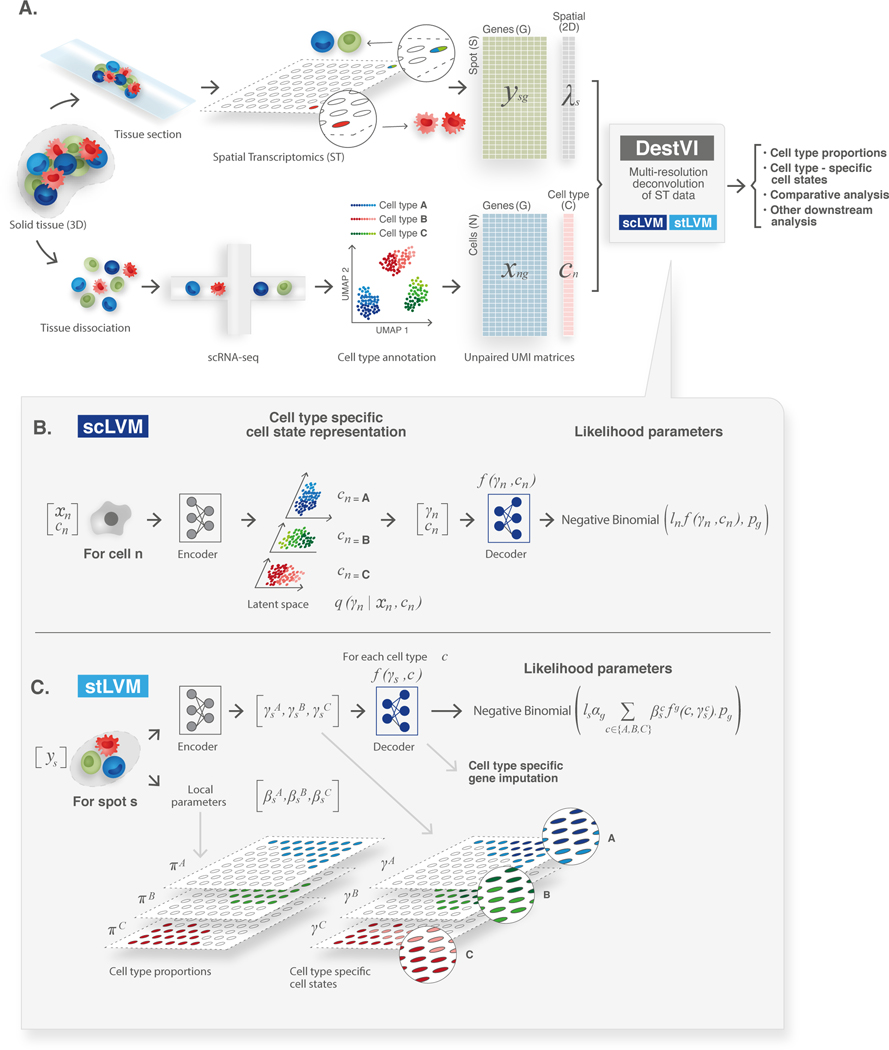
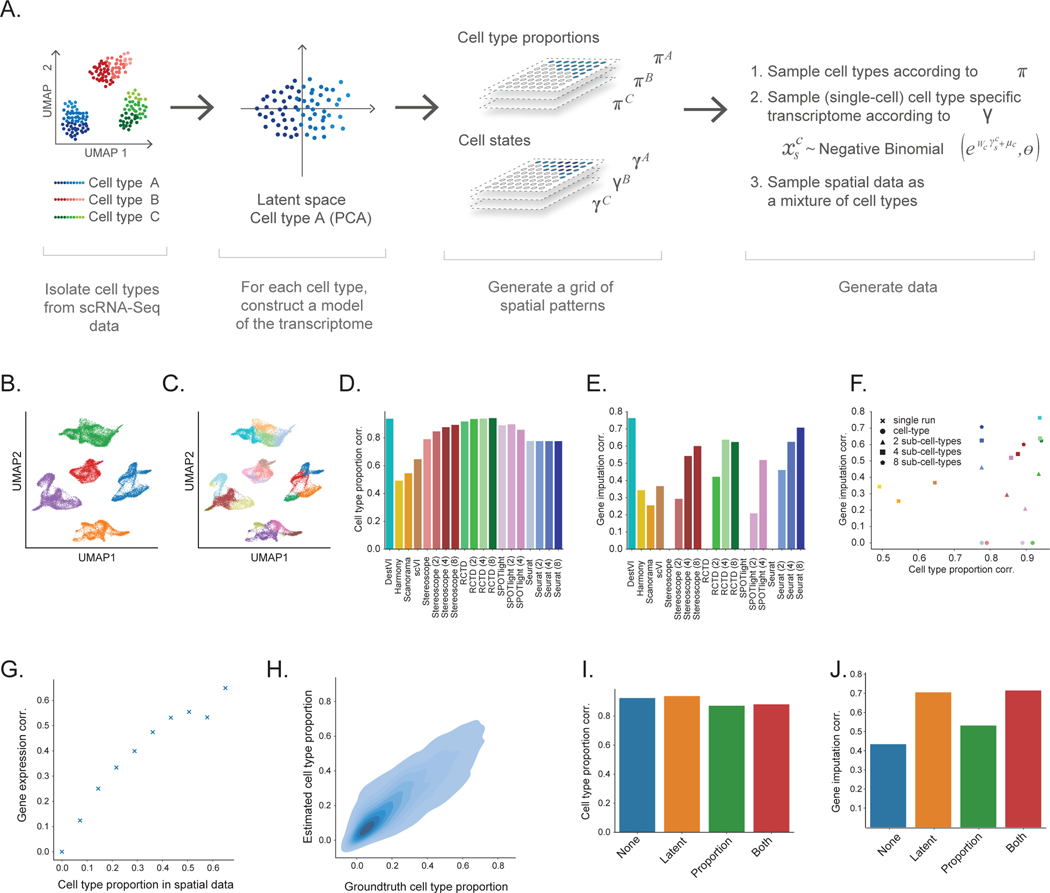
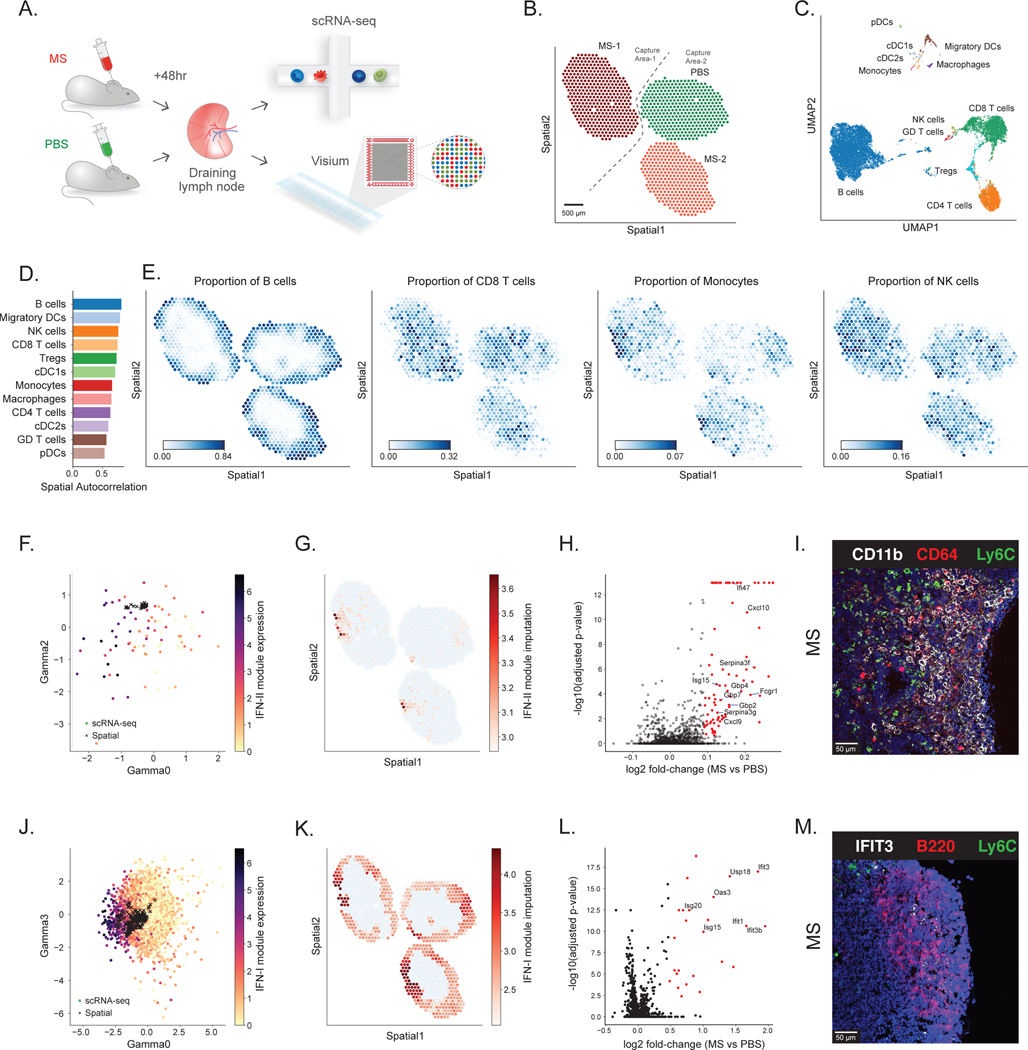
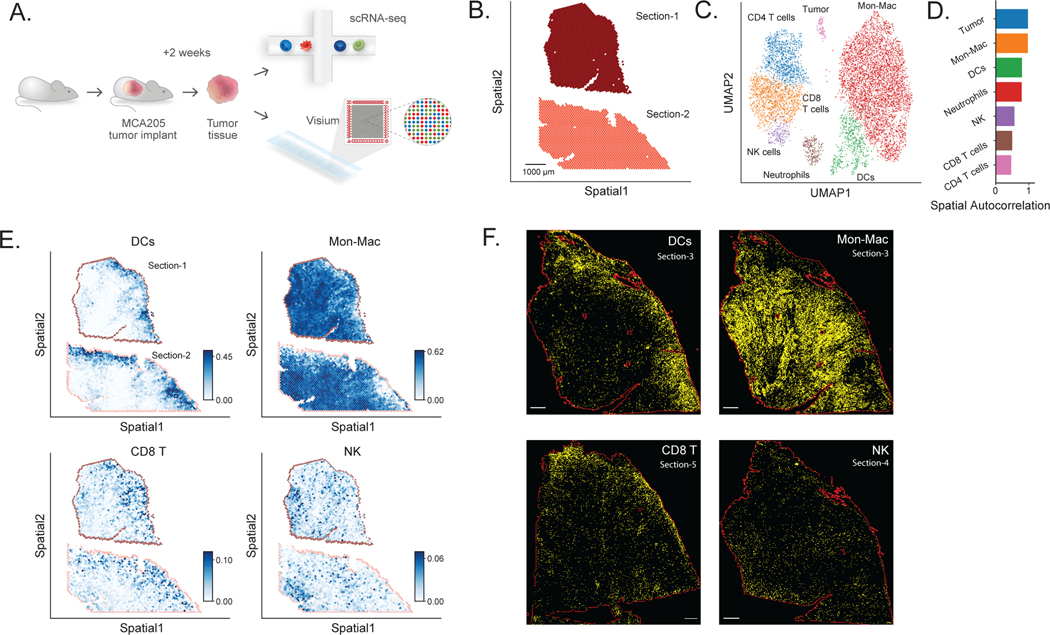
Most spatial transcriptomics technologies are limited by their resolution, with spot sizes larger than that of a single cell. Although joint analysis with single-cell RNA sequencing can alleviate this problem, current methods are limited to assessing discrete cell types, revealing the proportion of cell types inside each spot. To identify continuous variation of the transcriptome within cells of the same type, we developed Deconvolution of Spatial Transcriptomics profiles using Variational Inference (DestVI). Using simulations, we demonstrate that DestVI outperforms existing methods for estimating gene expression for every cell type inside every spot. Applied to a study of infected lymph nodes and of a mouse tumor model, DestVI provides high-resolution, accurate spatial characterization of the cellular organization of these tissues and identifies cell-type-specific changes in gene expression between different tissue regions or between conditions. DestVI is available as part of the open-source software package scvi-tools ( https://scvi-tools.org ).


Conflict of interest statement

Competing Interests Statement

N.Y. is an advisor and/or has equity in Cellarity, Celsius Therapeutics, and Rheos Medicine.

Figures

Figure 1:
Figure 1:. Schematic representation of the ST analysis pipeline with DestVI.
(A) A ST analysis workflow relies on two data modalities, producing unpaired transcriptomic measurements, in the form of count matrices. The ST data measures the gene expression ys in a given spot s, and its location λs. However, each spot may contain multiple cells. The single cell RNA-sequencing data measures the gene expression xn in a cell n, but the spatial information is lost because of tissue dissociation. After annotation, we may associate each cell with a cell type cn. These matrices are the input to DestVI, composed of two latent variable models: the single-cell latent variable model (scLVM) and the ST latent variable model (stLVM). DestVI outputs a joint representation of the single-cell data, and the spatial data by estimating the proportion of every cell type in every spot, and projecting the expression of each spot onto cell-type-specific latent spaces. These inferred values may be used for performing downstream analysis such as cell-type-specific DE and comparative analyses of conditions. (B) Schematic of the scLVM. RNA counts and cell type information from the single cell RNA-sequencing data are jointly transformed by an encoder neural network into the parameters of the approximate posterior of γn, a low-dimensional representation of cell-type-specific cell state. Next, a decoder neural network maps samples from the approximate posterior of γn along with the cell type information cn to the parameters of a count distribution for every gene. The superscript notation fg denotes the g-th entry ρngof the vector ρn. (C) Schematic of the stLVM. RNA counts from the ST data are transformed by an encoder neural network into the parameters of the cell-type-specific embeddings γsc. Free parameters βsc encode the abundance of cell type c in spot s, and may be normalized into CTP πsc (Methods). The decoder from the scLVM model maps cell-type-specific embeddings γsc to estimates of cell-type-specific gene expression. These values are summed across all cell types, weighted by the abundance parameters βsc, to obtain the parameter rsg approximating the gene expression of the spot. After training, the decoder may be used to perform cell-type-specific imputation of gene expression across all spots.
Figure 2:
Figure 2:. Evaluating the performance on DestVI on simulations.
(A) Schematic view of the semi-simulation framework. For each cell type of a scRNA-seq dataset, we learned a continuous model of cell. We sampled spatially-relevant random vectors on a grid to encode the proportion of every cell type in every spot πsc, as well as the cell-type-specific embeddings γsc. Then, we feed those parameters into the learned continuous model to generate ST data (Methods). (B-C) Visualization of the single-cell data, and the cell state labels used for comparison to competing methods (UMAP embeddings of the single-cell data; 32,000 cells). (B) Cells are colored by cell type. (C) Cells are colored by the sub-cell types, obtained via hierarchical clustering (5 clusters). (D-F) Comparison of DestVI to competing algorithms, possibly applied to different clustering resolutions. Performance is not reported for cases that did not terminate by three hours (SPOTLight with 8 sub-clusters; Methods). (D) Spearman correlation of estimated CTP compared to ground truth for all methods. (E) Spearman correlation of estimated cell-type-specific gene expression compared to ground truth, for combinations of spot and cell type for which the proportion is > 0.4 for the parent cluster (not applicable to algorithms run at the coarsest level, as they do not provide cell type proportions at any sub cell type level). (F) Scatter plot of both metrics, that shows the tradeoff reached by all methods. Colors in this panel are in concordance with the ones from panel (E-F). (G-H) Follow-up stress tests for DestVI. (G) Accuracy of imputation, measured via Spearman correlation as a function of the cell-type proportion in a given spot. (H) Head-to-head comparison of estimated cell-type proportion against ground truth across all spots and cell types (8,000 combinations of spot and cell type). (I-J) Ablation studies for the amortization scheme used by DestVI. “None” stands for vanilla MAP inference. “Latent” and “Proportion” refer to only the inference of the latent variables, and only the cell type abundance being amortized with a neural network, respectively. “Both” refers to fully-amortized MAP inference. (I) Spearman correlation of estimated CTP compared to ground truth. (J) Spearman correlation of estimated cell-type-specific gene expression compared to ground truth.
Figure 3:
Figure 3:. Application of DestVI to the murine lymph nodes.
(A) Schematics of the experimental pipeline. We processed murine lymph nodes with ST (10x Visium) and single-cell RNA sequencing (10x Chromium) following 48 hr stimulation by Mycobacterium smegmatis (MS) compared with PBS control (two sections from each condition). (B) ST data (1,092 spots; only three sections passed the quality check) (Supplementary Methods). Sample MS-1 and samples PBS / MS-2 were processed on different capture areas of the same Visium gene expression slide. (C) UMAP projection of the scRNA-seq data (14,989 cells). (D) Spatial autocorrelation of the CTP. (E) Spatial distribution of CTP for B cells, CD8 T cells, Monocytes and NK cells, as inferred by DestVI. (F) Embedding of the monocytes (circles; 128 single-cells) alongside the monocytes-abundant spots (crosses; 79 spots). Single-cells are colored by expression of IFN-II genes identified by Hotspot (Fcgr1, Cxcl9 and Cxcl10; Supplementary Figures 12–14). (G) Imputation of monocyte-specific expression of the IFN-II marker genes for the monocytes-abundant spots of the spatial data (log-scale) (H) Monocyte-specific DE analysis between MS and PBS lymph nodes (2,000 genes; 79 spots; total 10,980 samples from the generative model). Red dots designate genes with statistical significance, according to our DE procedure (two-sided Kolmogorov-Smirnov test, adjusted for multiple testing using the Benjamini-Hochberg procedure; Methods). (I) Immunofluorescence imaging from a MS lymph node, staining for CD11b, CD64 and Ly6C in the interfollicular area (IFA). Scale bar, 50 μm. (J) Embedding of the B cells (circles, 8,359 single-cells) alongside the B-cells-abundant spots (crosses, 579 spots). Single-cells are colored by expression of the IFN-I genes identified by Hotspot (Ifit3, Ifit3b, Stat1, Ifit1, Usp18 and Isg15; Supplementary Figures 17–18). (K) Imputation of B cell-specific expression of the IFN-I gene module on the spatial data (log-scale), reported on B-cells-abundant spots. (L) B cell-specific DE analysis between MS and PBS lymph nodes (2,000 genes; 579 spots; 6,160 samples). Red dots designate genes with statistical significance, according to our DE procedure (two-sided Kolmogorov-Smirnov test, adjusted for multiple testing using the Benjamini-Hochberg procedure; Methods). (M) Immunofluorescence imaging from a MS lymph node, staining for IFIT3, B220 and Ly6C in B cell follicle near the inflammatory IFA. Scale bar, 50 μm.
Figure 4:
Figure 4:. Application of DestVI to a MCA205 tumor sample.
(A) Schematics of the experimental pipeline. We performed ST (10x Visium) and single-cell RNA sequencing (scRNA-seq, single-cell MARS-seq protocol) on MCA205 tumor that contains heterogeneous immune cell populations 14 days after intracutaneous transplantation into the wild-type mouse (two sections). (B) Visualization of the ST data for two MCA205 tumor sections, after quality control (4,027 spots). Scale bar, 1000 μm. The two sections were processed on the different capture areas of the same Visium gene expression slide. (C) UMAP projection of the scRNA-seq data (8,051 cells), embedded by scVI and manually annotated. (D) Spatial autocorrelation of the CTP for every cell type, computed using Hotspot. (E) Spatial distribution of CTP for DCs, monocytes and macrophages (Mon-Mac), CD8 T cells and NK cells. (F) Immunofluorescence imaging from neighboring tumor sections, using antibodies for MHCII+ cells showing for DCs (Section-3, +20 μm from Section-2), F4/80+MHCII cells showing for Mon-Mac (Section-3, +20 μm from Section-2), TCRb+ cells showing for CD8 T cells (Section-5, +60 μm from Section-2) and NK1.1+ cells showing for NK cells (Section-4, +30 μm from Section-2). All scale bars denote 500 μm. Red solid lines indicate the section boundary. Right side is the MCA205 tumor marginal boundary. The staining marker positive cells are segmented and annotated using QuPath and showing yellow color here with changed brightness and contrast (Supplementary Methods).
Figure 5:
Figure 5:. DestVI identifies a hypoxic population of macrophages in the tumor core.
(A) Visualization of the hypoxia gene expression module on the Mon-Mac cells from the scRNA-seq data (4,400 cells), on the embedding from scVI (identified using Hotspot; see Supplementary Figures 28–29). (B) Imputation of gene expression for this module on the spatial dataset (log-scale), reported only on spots with high abundance of Mon-Mac (3,906 spots across the two sections). Imputation for other modules is shown in Supplementary Figure 30. (C) H&E stained histology of Section-1 (left), with overlapping Mreg identified regions from DestVI showing red polygons (as identified in Supplementary Figure 32). Blue arrows show the location of cells from the necrotic core. H&E stained histology showing a magnification of the necrotic core of the yellow frame in Section-1 (right). Scale bar, 55 μm. (D) Mon-Mac cell-specific DE analysis between the Mreg enriched areas and the rest of the tumor section (2,886 genes; 379 spots for the Mreg enriched area and 361 randomly sampled spots from the rest of the tumor; total of 2,220 samples from the generative model). Red dots designate genes with statistical significance, according to our DE procedure (two-sided Kolmogorov-Smirnov test, adjusted for multiple testing using the Benjamini-Hochberg procedure; Methods). (E) Representative image of the multiplexed immunofluorescence staining. (left) Hypoxic areas as identified by the Hypoxyprobe (HYPO) in a whole MCA205 tumor section. Two yellow frames show the hypoxic areas with necrotic cores. Scale bar, 500 μm. (middle) Magnification of a necrotic core with F4/80, Arg1, GPNMB, Hypoxyprobe (HYPO) and DAPI staining. Scale bar, 50 μm. (right) Annotation of different macrophages surrounding the necrotic core. Different colors shown in the legend bar show different staining combinations. Red spindle shows the extent of hypoxia. Blue arrow shows the location of cells from the necrotic core. Scale bar, 50 μm.

References

    1. Wagner A, Regev A, Yosef N. Revealing the vectors of cellular identity with single-cell genomics. Nat Biotechnol. 2016;34: 1145–1160. - PMC - PubMed
    1. Codeluppi S, Borm LE, Zeisel A, La Manno G, van Lunteren JA, Svensson CI, et al. Spatial organization of the somatosensory cortex revealed by osmFISH. Nat Methods. 2018;15. doi:10.1038/s41592-018-0175-z - DOI - PubMed
    1. Asp M, Salmén F, Ståhl PL, Vickovic S, Felldin U, Löfling M, et al. Spatial detection of fetal marker genes expressed at low level in adult human heart tissue. Sci Rep. 2017;7: 12941. - PMC - PubMed
    1. Hunter MV, Moncada R, Weiss JM, Yanai I, White RM. Spatial transcriptomics reveals the architecture of the tumor/microenvironment interface. Cold Spring Harbor Laboratory. 2020. p. 2020.11.05.368753. doi:10.1101/2020.11.05.368753 - DOI
    1. Ji AL, Rubin AJ, Thrane K, Jiang S, Reynolds DL, Meyers RM, et al. Multimodal Analysis of Composition and Spatial Architecture in Human Squamous Cell Carcinoma. Cell. 2020;182: 1661–1662. - PMC - PubMed

Publication types