

Retrospective genomics highlights changes in genetic composition of tiger sharks (Galeocerdo cuvier) and potential loss of a south-eastern Australia population
- PMID: 35449439
- PMCID: PMC9023511
- DOI: 10.1038/s41598-022-10529-w
Retrospective genomics highlights changes in genetic composition of tiger sharks (Galeocerdo cuvier) and potential loss of a south-eastern Australia population
Abstract
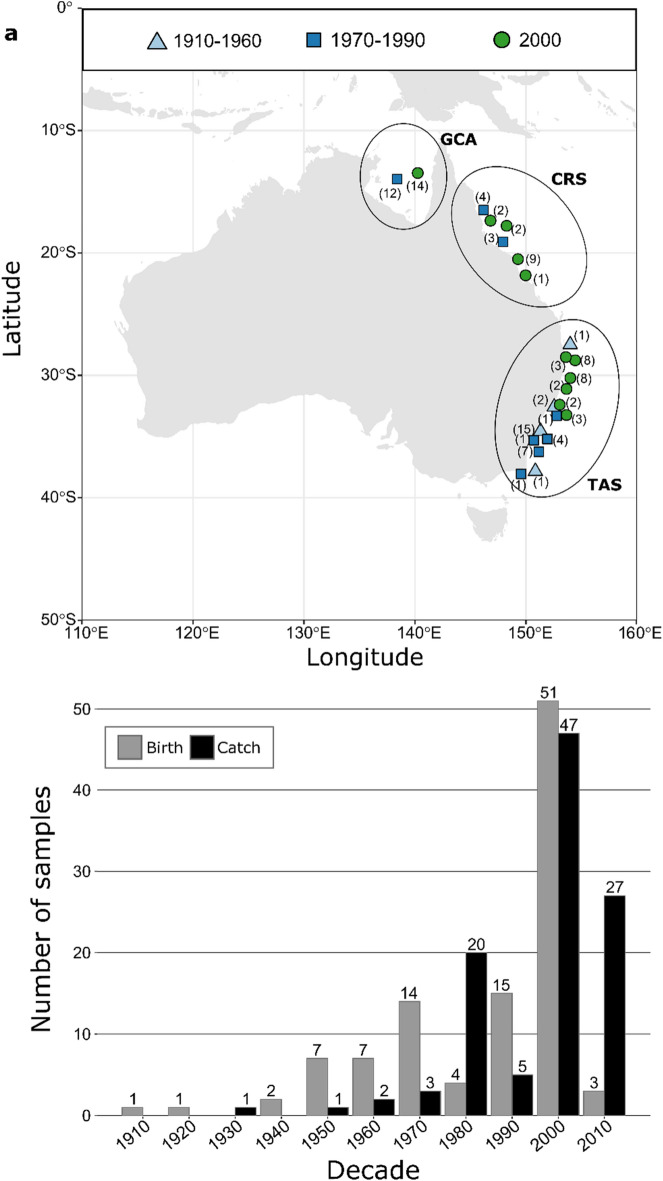
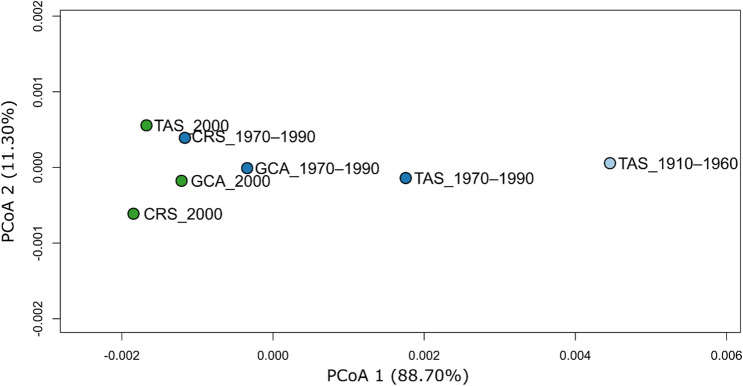
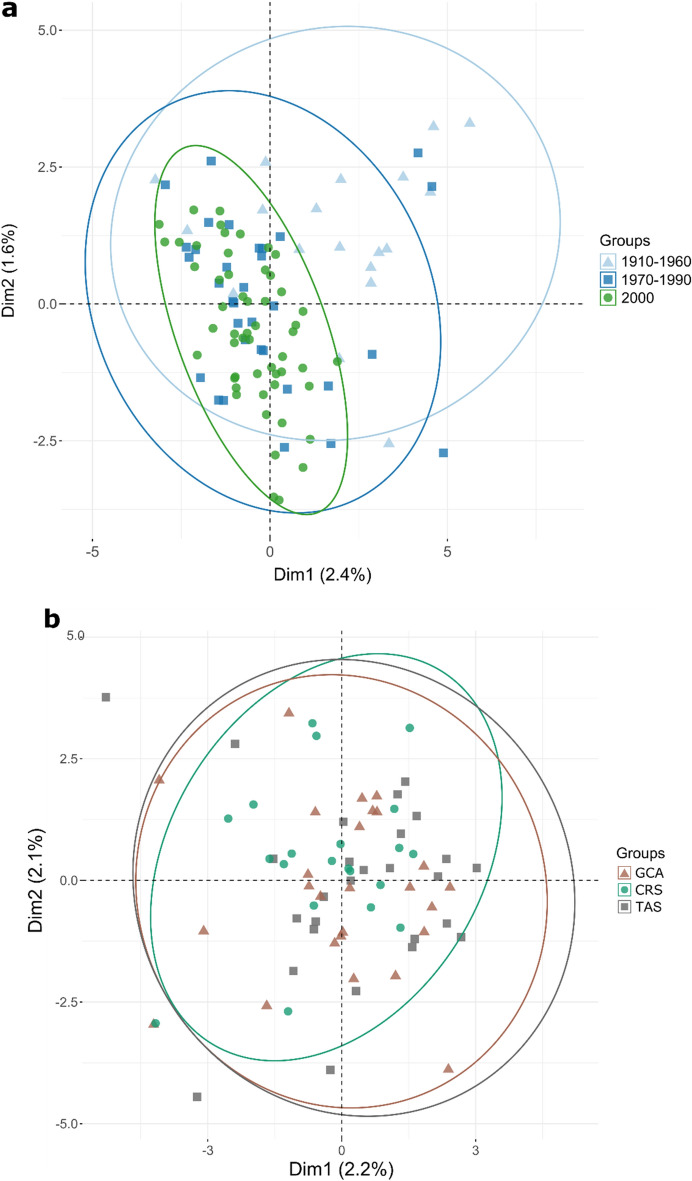
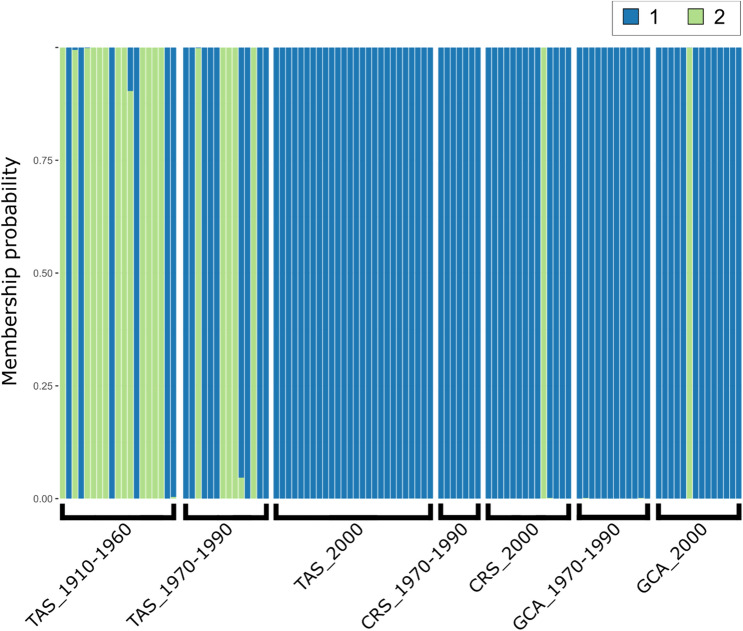
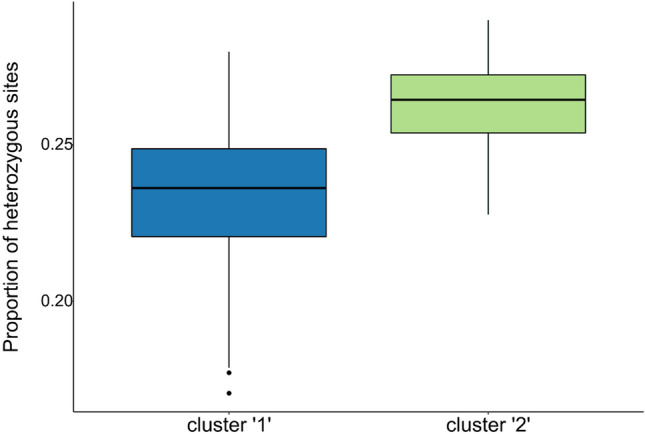
Over the last century, many shark populations have declined, primarily due to overexploitation in commercial, artisanal and recreational fisheries. In addition, in some locations the use of shark control programs also has had an impact on shark numbers. Still, there is a general perception that populations of large ocean predators cover wide areas and therefore their diversity is less susceptible to local anthropogenic disturbance. Here we report on temporal genomic analyses of tiger shark (Galeocerdo cuvier) DNA samples that were collected from eastern Australia over the past century. Using Single Nucleotide Polymorphism (SNP) loci, we documented a significant change in genetic composition of tiger sharks born between ~1939 and 2015. The change was most likely due to a shift over time in the relative contribution of two well-differentiated, but hitherto cryptic populations. Our data strongly indicate a dramatic shift in the relative contribution of these two populations to the overall tiger shark abundance on the east coast of Australia, possibly associated with differences in direct or indirect exploitation rates.
© 2022. The Author(s).
Conflict of interest statement
The authors declare no competing interests.
Figures
Similar articles
-
Genomic Assessment of Global Population Structure in a Highly Migratory and Habitat Versatile Apex Predator, the Tiger Shark (Galeocerdo cuvier).J Hered. 2021 Nov 1;112(6):497-507. doi: 10.1093/jhered/esab046. J Hered. 2021. PMID: 34374783
-
Thirty-five years of tiger shark Galeocerdo cuvier relative abundance near Bimini, The Bahamas, and the Southeastern United States with a comparison across jurisdictional bounds.J Fish Biol. 2022 Jul;101(1):13-25. doi: 10.1111/jfb.15067. Epub 2022 May 24. J Fish Biol. 2022. PMID: 35446438
-
Evidence of Fine-Scale Genetic Structure in Tiger Sharks (Galeocerdo cuvier) Highlights the Importance of Stratified Sampling Regimes.Evol Appl. 2025 Jun 8;18(6):e70117. doi: 10.1111/eva.70117. eCollection 2025 Jun. Evol Appl. 2025. PMID: 40495934 Free PMC article.
-
High microplastic and anthropogenic particle contamination in the gastrointestinal tracts of tiger sharks (Galeocerdo cuvier) caught in the western North Atlantic Ocean.Environ Pollut. 2024 Mar 1;344:123185. doi: 10.1016/j.envpol.2023.123185. Epub 2023 Dec 24. Environ Pollut. 2024. PMID: 38147950 Review.
-
Diet Composition and Trophic Ecology of Northeast Pacific Ocean Sharks.Adv Mar Biol. 2017;77:111-148. doi: 10.1016/bs.amb.2017.06.001. Epub 2017 Aug 18. Adv Mar Biol. 2017. PMID: 28882212 Review.
Cited by
-
Non-invasive methods characterise the world's largest tiger shark aggregation in Fuvahmulah, Maldives.Sci Rep. 2024 Sep 23;14(1):21998. doi: 10.1038/s41598-024-73079-3. Sci Rep. 2024. PMID: 39313535 Free PMC article.
-
Fishing for DNA? Designing baits for population genetics in target enrichment experiments: Guidelines, considerations and the new tool supeRbaits.Mol Ecol Resour. 2022 Jul;22(5):2105-2119. doi: 10.1111/1755-0998.13598. Epub 2022 Mar 3. Mol Ecol Resour. 2022. PMID: 35178874 Free PMC article.
-
Management and conservation implications of cryptic population substructure for two commercially exploited fishes (Merluccius spp.) in southern Africa.Mol Ecol Resour. 2025 Jul;25(5):e13820. doi: 10.1111/1755-0998.13820. Epub 2023 Jun 8. Mol Ecol Resour. 2025. PMID: 37291747 Free PMC article.
References
-
- Schindler DE, Armstrong JB, Reed TE. The portfolio concept in ecology and evolution. Front. Ecol. Environ. 2015;13:257–263. doi: 10.1890/140275. - DOI
Publication types
MeSH terms
LinkOut - more resources
Full Text Sources
Miscellaneous
