. 2022 May;7(5):653-662.
doi: 10.1038/s41564-022-01096-x. Epub 2022 Apr 21.

Longitudinal gut virome analysis identifies specific viral signatures that precede necrotizing enterocolitis onset in preterm infants

Affiliations

Longitudinal gut virome analysis identifies specific viral signatures that precede necrotizing enterocolitis onset in preterm infants

Emily A Kaelin et al. Nat Microbiol. 2022 May.

Abstract

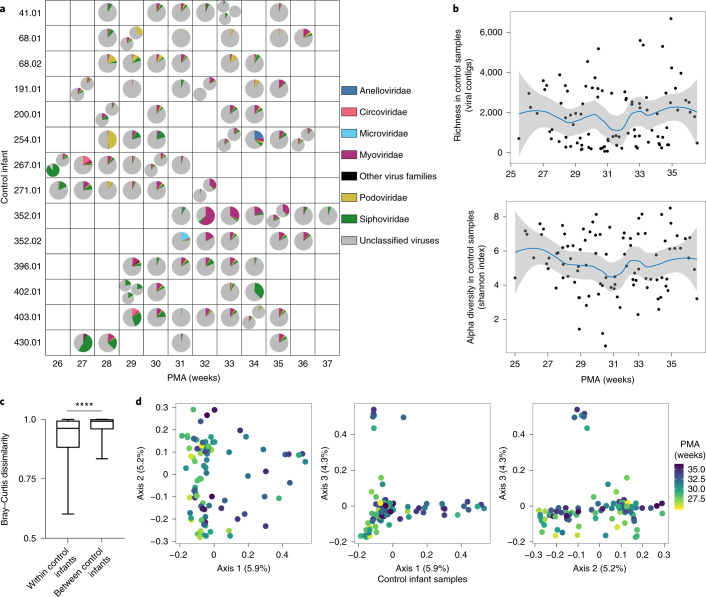
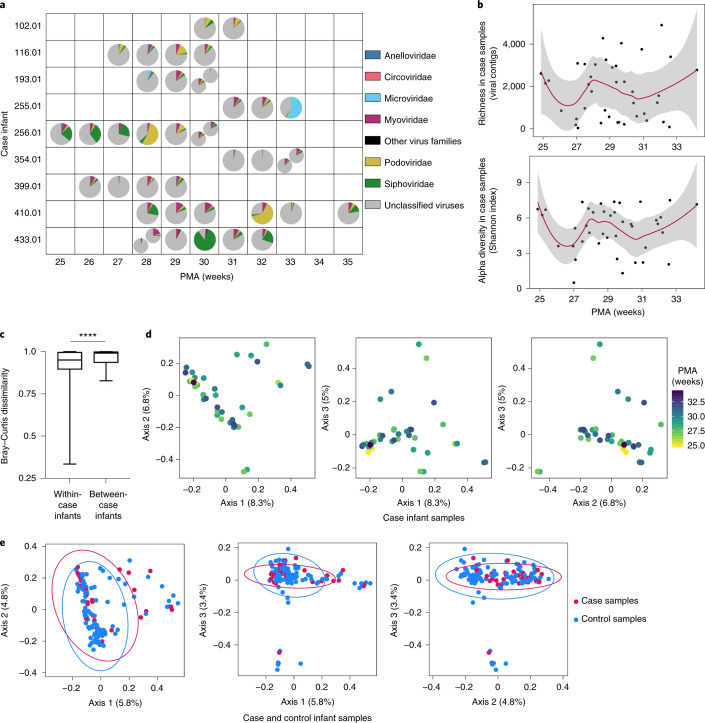
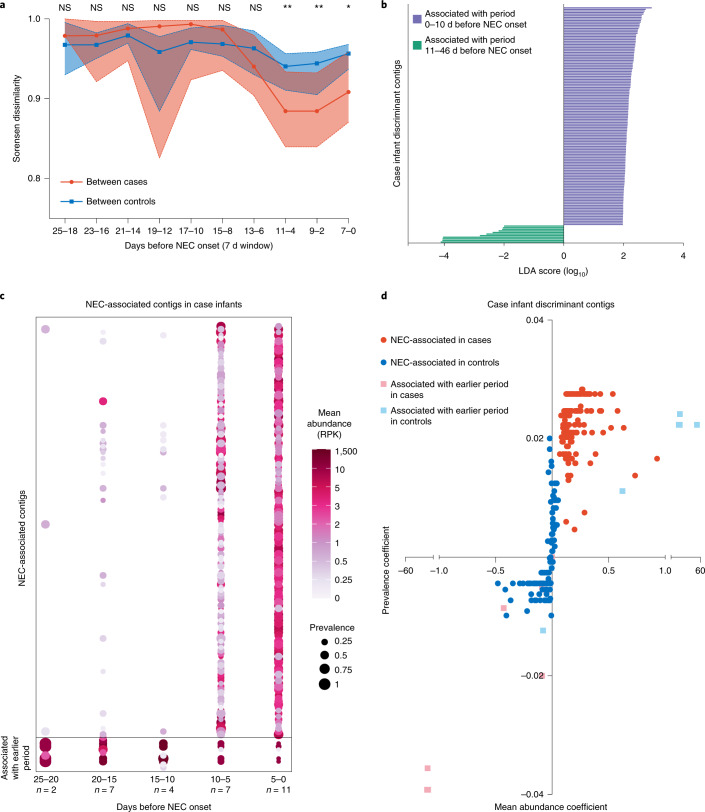
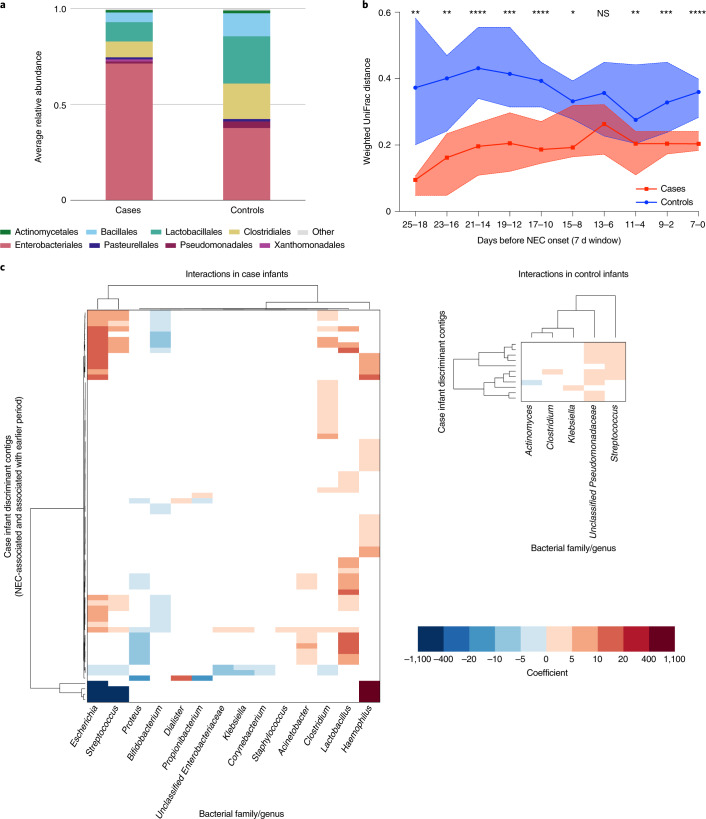
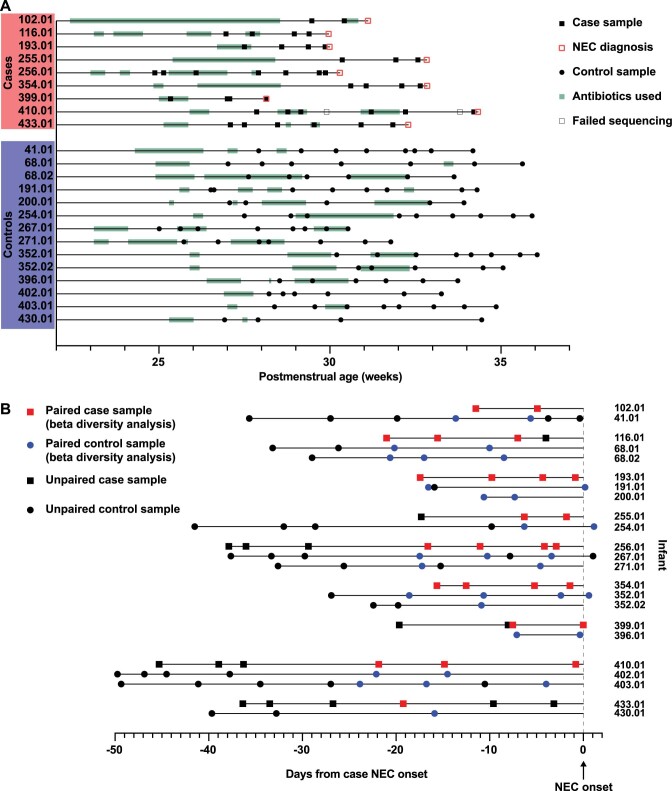
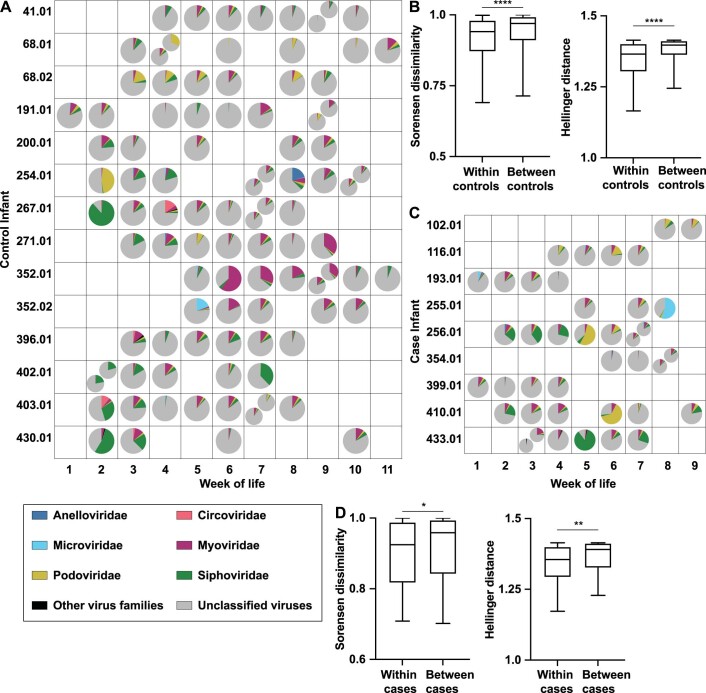
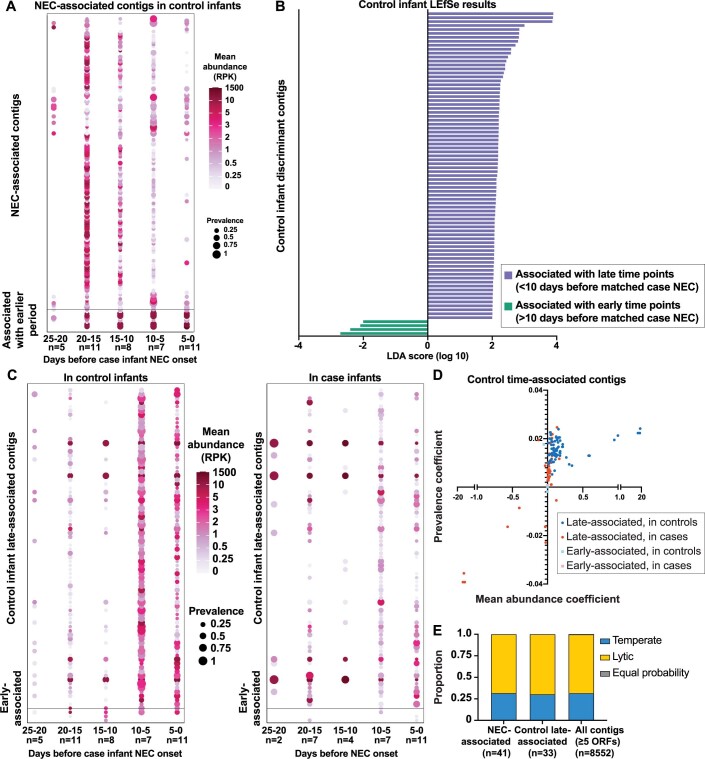
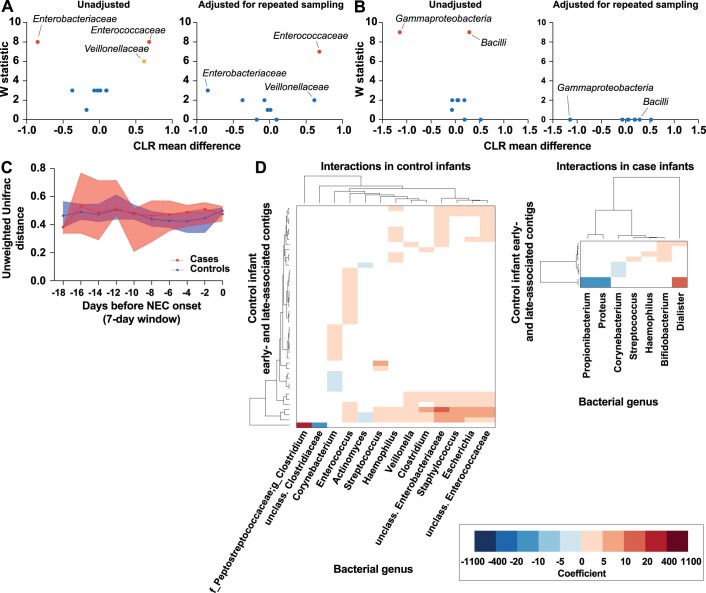
Necrotizing enterocolitis (NEC) is a serious consequence of preterm birth and is often associated with gut bacterial microbiome alterations. However, little is known about the development of the gut virome in preterm infants, or its role in NEC. Here, using metagenomic sequencing, we characterized the DNA gut virome of 9 preterm infants who developed NEC and 14 gestational age-matched preterm infants who did not. Infants were sampled longitudinally before NEC onset over the first 11 weeks of life. We observed substantial interindividual variation in the gut virome between unrelated preterm infants, while intraindividual variation over time was significantly less. We identified viral and bacterial signatures in the gut that preceded NEC onset. Specifically, we observed a convergence towards reduced viral beta diversity over the 10 d before NEC onset, which was driven by specific viral signatures and accompanied by specific viral-bacterial interactions. Our results indicate that bacterial and viral perturbations precede the sudden onset of NEC. These findings suggest that early life virome signatures in preterm infants may be implicated in NEC.


Conflict of interest statement

The authors declare no competing interests.

Figures

Fig. 1
Fig. 1. Gut virome in preterm infants who did not develop NEC (controls).
a, Virus family relative abundance in samples from control infants, grouped by PMA. Multiple pie charts within a square indicate multiple samples from the same infant in one week. b, Viral contig richness and alpha diversity (Shannon index) in control samples over time. Trend lines and 95% confidence bands were generated using LOESS smoothing in R. Smoothing level: span = 0.5. c, Median weighted Bray–Curtis dissimilarity within individual control infants and between individual control infants, n = 14 infants. Box limits, 25th and 75th percentiles; whiskers, 2.5 and 97.5 percentiles. Statistical significance was assessed by two-sided Mann–Whitney U-test, P < 0.0001. d, PCoA of control samples, using weighted Bray–Curtis distance. Statistical significance of PMA (continuous variable) was assessed by PERMANOVA. Samples were colour-coded by PMA.
Fig. 2
Fig. 2. Gut virome over time in infants who developed NEC (cases).
a, Virus family relative abundance in case samples, grouped by PMA. Multiple pie charts within a square indicate multiple samples from the same infant in one week. b, Viral contig richness and Shannon diversity in case samples over time. Trend lines and 95% confidence bands were generated using LOESS smoothing in R, with a span of 0.5. c, Median weighted Bray–Curtis dissimilarity within individual case infants and between individual case infants, n = 9 infants. Box limits, 25th and 75th percentiles; whiskers, 2.5 and 97.5 percentiles. Statistical significance was assessed by two-sided Mann–Whitney U-test, P < 0.0001. d, PCoA of case samples using weighted Bray–Curtis distance. Statistical significance of PMA (continuous variable) assessed by PERMANOVA. Samples were colour-coded by PMA. e, PCoA comparing case and control samples using weighted Bray–Curtis distance. Statistical significance was assessed by PERMANOVA.
Fig. 3
Fig. 3. Virome convergence before NEC onset.
a, Sorensen dissimilarity between cases (red) and between controls (blue) in sliding windows before NEC onset (7 d windows with 2 d steps). Medians with 95% confidence intervals are shown. Statistical significance at each window was assessed by two-sided Mann–Whitney U-test. b, LEfSe of contigs in case samples. Purple indicates features associated with 0–10 d before NEC. Green indicates features associated with 10–46 d before NEC. c, Prevalence and abundance of NEC-associated contigs in cases, in 5 d intervals before NEC. Statistical significance was assessed by Friedman test with Dunn’s multiple comparisons (P values in Supplementary Table 13). d, For each discriminant contig, linear regression was performed on prevalence and average abundance in 5 d intervals before NEC in cases (red) and controls (blue). Regression coefficients for abundance and prevalence are shown on the x and y axes, respectively.
Fig. 4
Fig. 4. Bacterial microbiome stability and virus-bacteria interactions before NEC onset.
a, Average relative abundance of bacterial orders in case and control samples in the 25 d preceding case NEC onset. b, Weighted UniFrac distance between case samples (red) and between matched control samples (blue) in sliding windows before time of case NEC onset (7 d windows with 2 d steps). Medians with 95% confidence intervals are shown. Statistical significance at each window was assessed by two-sided Mann–Whitney U-test. c, Significant correlations between case discriminant contigs (NEC-associated and associated with earlier period) and bacterial genera in case (left) and control (right) infants. Dendrograms were ordered based on row and column means. Coefficient refers to the linear regression coefficient (that is, slope).
Extended Data Fig. 1
Extended Data Fig. 1. Sample timeline.
a: All samples by postmenstrual age at sample collection. b: Samples used for analysis of time relative to NEC onset (Figs. 3 and 4). Matched case and control infants are grouped together. Paired samples used for beta diversity analysis are indicated in red and blue (Figs. 3a and 4b).
Extended Data Fig. 2
Extended Data Fig. 2. Relative abundance by week of life, Sorensen dissimilarity and Hellinger distance within and between infants.
a: Virus family relative abundance in control samples from Fig. 1a, grouped by week of life rather than postmenstrual age. Multiple pie charts in the same square indicate multiple samples for an infant in the same week. b. Sorensen dissimilarity and Hellinger distance within and between control infants, n = 14 infants. Center line = median; box limits = 25th and 75th percentiles; whiskers = 2.5 and 97.5 percentiles. Statistical significance assessed by two-sided Mann-Whitney test, p < 0.0001. c: Virus family relative abundance in case samples from Fig. 2a, grouped by week of life rather than PMA. Multiple pie charts in the same square indicate multiple samples for an infant in the same week. The same colors are used to indicate virus families in A and C. d: Sorensen dissimilarity and Hellinger distance within and between case infants, n = 9 infants. Center line = median; box limits = 25th and 75th percentiles; whiskers = 2.5 and 97.5 percentiles. Statistical significance assessed by two-sided Mann-Whitney test, p = 0.04 and p = 0.002, respectively.
Extended Data Fig. 3
Extended Data Fig. 3. Control infant discriminant contigs and phage lifestyle predictions.
a: Prevalence and abundance of NEC-associated contigs in control infants, in 5-day intervals prior to respective case NEC onset. Statistical significance assessed by Friedman test with Dunn’s multiple comparisons (p-values in Supplementary Table 14). b: Linear discriminant analysis effect size (LEfSe) of contigs in control samples. Purple indicates features associated with 0–10 days prior to case NEC onset. Green indicates features associated with 10–46 days prior to case NEC onset. c: Prevalence and abundance of control early- and late-associated contigs in control infants (left) and case infants (right), in 5-day intervals prior to case NEC onset. Statistical significance assessed by Friedman test with Dunn’s multiple comparisons (p-values in Supplementary Tables 17,18). d: For each control discriminant contig, linear regression was performed on prevalence and average abundance values in 5-day intervals prior to NEC in cases (red) and controls (blue). Regression coefficients for abundance and prevalence were plotted on the x- and y-axes, respectively. E: Lifestyle predictions (temperate or lytic) for case and control late-associated viral contigs.
Extended Data Fig. 4
Extended Data Fig. 4. ANCOM-II, unweighted bacterial beta diversity, and bacterial-viral interactions in controls.
a: ANCOM-II comparing bacterial family abundance in case and control samples, unadjusted (left) and adjusted (right) for repeated sampling. W statistic is the number of significant comparisons between a taxon and the other taxa being tested. CLR mean difference corresponds to effect size. Points in red represent taxa that are differentially abundant when W statistic threshold is set at the 70th percentile. Points in orange represent taxa that are differentially abundant when W statistic threshold is set at the 60th percentile. Points in blue represent taxa that are not differentially abundant. b. ANCOM-II comparing bacterial class abundance in case and control samples, unadjusted (left) and adjusted (right) for repeated sampling. W statistic is the number of significant comparisons between a taxon and the other taxa being tested. CLR mean difference corresponds to effect size. Points in red represent taxa that are differentially abundant when W statistic threshold is set at the 70th percentile. Points in blue represent taxa that are not differentially abundant. c: Unweighted UniFrac distance between case samples (red) and between matched control samples (blue) in sliding windows prior to NEC onset (7-day windows with 2-day steps). Medians with 95% confidence intervals are shown. Statistical significance at each window assessed by two-sided Mann-Whitney U test. d: Significant correlations between control discriminant contigs (late- and early-associated) and bacterial genera in control infants (left) and case infants (right). Dendrograms were ordered based on row and column means.

References

    1. Knell J, Han SM, Jaksic T, Modi BP. Current status of necrotizing enterocolitis. Curr. Probl. Surg. 2019;56:11–38. doi: 10.1067/j.cpsurg.2018.11.005. - DOI - PubMed
    1. Battersby C, Santhalingam T, Costeloe K, Modi N. Incidence of neonatal necrotising enterocolitis in high-income countries: a systematic review. Arch. Dis. Child Fetal Neonatal Ed. 2018;103:F182–F189. doi: 10.1136/archdischild-2017-313880. - DOI - PubMed
    1. Rose AT, Patel RM. A critical analysis of risk factors for necrotizing enterocolitis. Semin. Fetal Neonatal Med. 2018;23:374–379. doi: 10.1016/j.siny.2018.07.005. - DOI - PMC - PubMed
    1. Pammi M, et al. Intestinal dysbiosis in preterm infants preceding necrotizing enterocolitis: a systematic review and meta-analysis. Microbiome. 2017;5:31. doi: 10.1186/s40168-017-0248-8. - DOI - PMC - PubMed
    1. Olm MR, et al. Necrotizing enterocolitis is preceded by increased gut bacterial replication, Klebsiella, and fimbriae-encoding bacteria. Sci. Adv. 2019;5:eaax5727. doi: 10.1126/sciadv.aax5727. - DOI - PMC - PubMed

Publication types