. 2022 Apr 5:12:795781.
doi: 10.3389/fonc.2022.795781. eCollection 2022.

The Prognostic Signature of Head and Neck Squamous Cell Carcinoma Constructed by Immune-Related RNA-Binding Proteins

Affiliations

The Prognostic Signature of Head and Neck Squamous Cell Carcinoma Constructed by Immune-Related RNA-Binding Proteins

Ruijie Ming et al. Front Oncol. .

Abstract

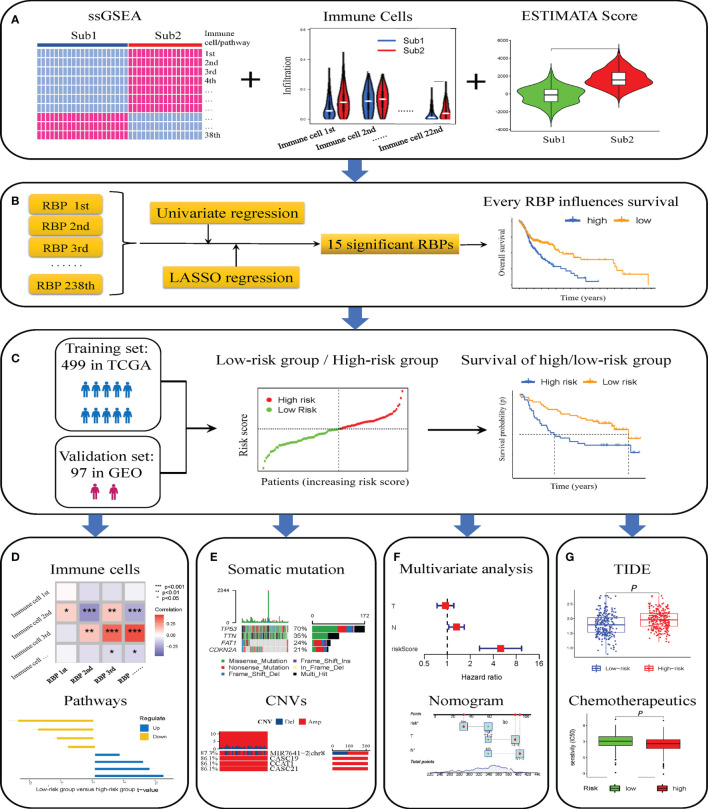
Purpose: This study aimed to construct a prognostic signature consisting of immune-related RNA-binding proteins (RBPs) to predict the prognosis of patients with head and neck squamous cell carcinoma (HNSCC) effectively.

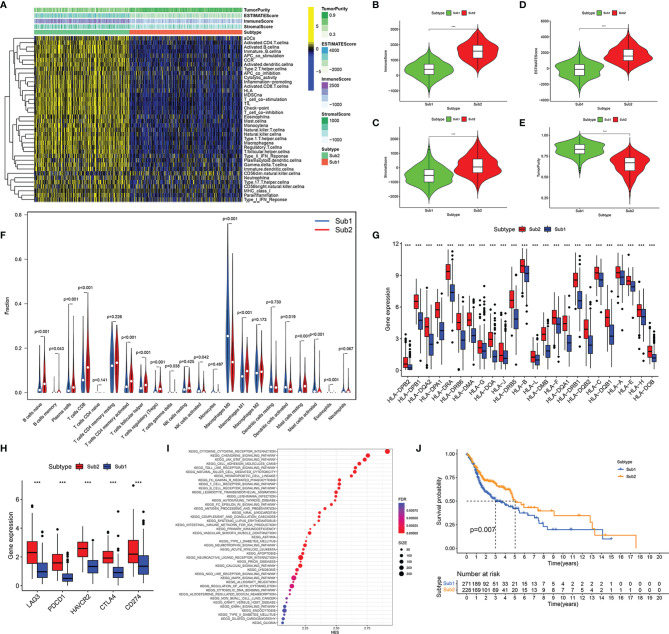
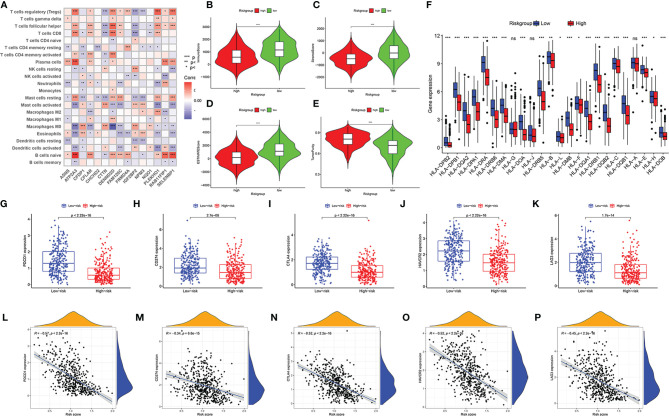
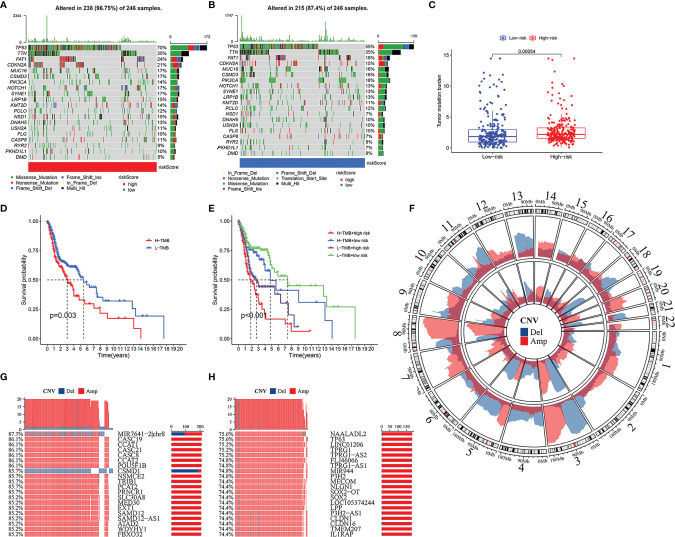
Methods: The transcriptome and clinical data of HNSCC were downloaded from The Cancer Genome Atlas (TCGA) and Gene Expression Omnibus (GEO) databases. First, we ascertained the immunological differences in HNSCC, through single-sample gene set enrichment analysis, stromal and immune cells in malignant tumor tissues using expression data (ESTIMATE), and cell-type identification by estimating relative subsets of RNA transcripts (CIBERSORT) deconvolution algorithm. Then we used univariate proportional hazards (Cox) regression analysis and least absolute shrinkage and selection operator (LASSO) Cox regression analysis to screen immune-related RBPs and acquire the risk score of each sample. Subsequently, we further investigated the difference in prognosis, immune status, and tumor mutation burden in high- and low-risk groups. Finally, the efficacy of immunotherapy was measured by the tumor immune dysfunction and exclusion (TIDE) score.

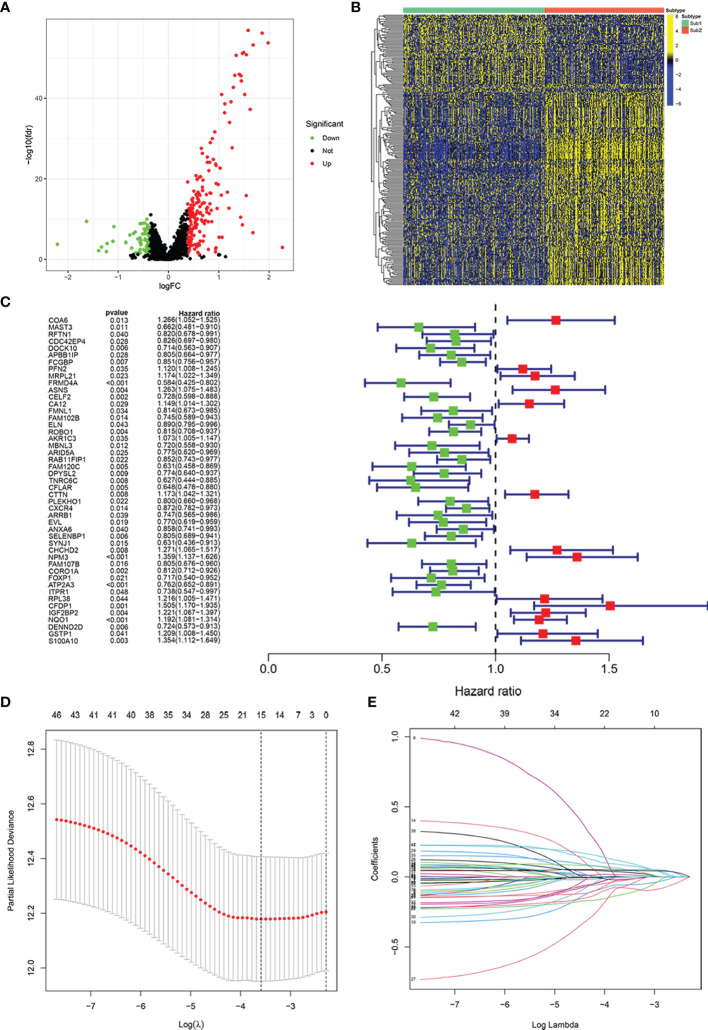
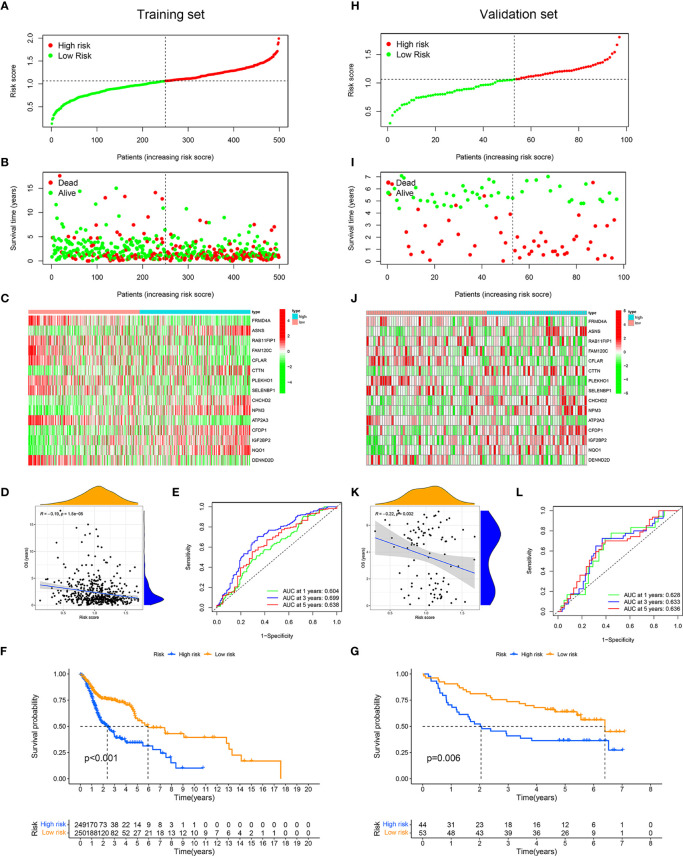
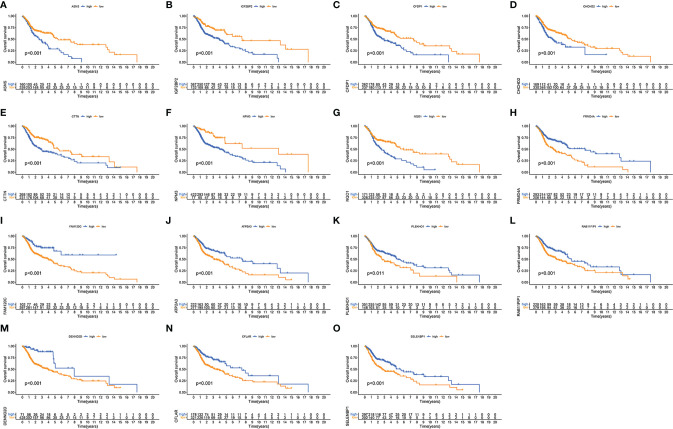
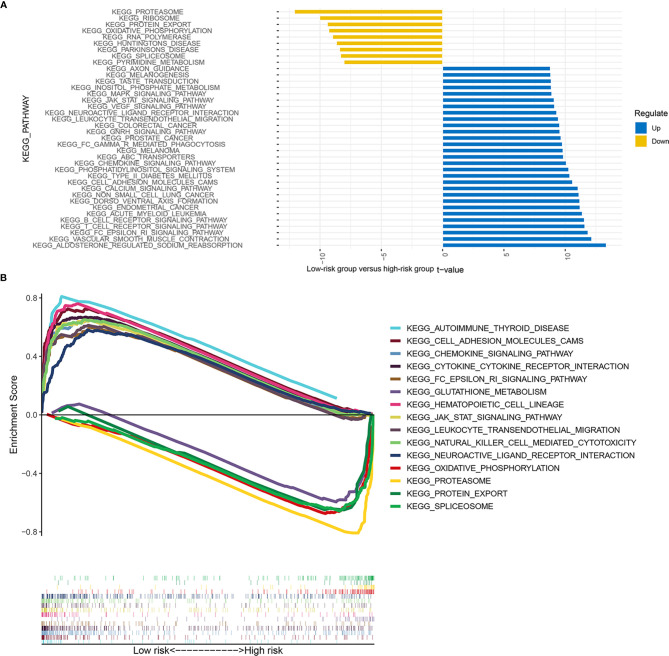
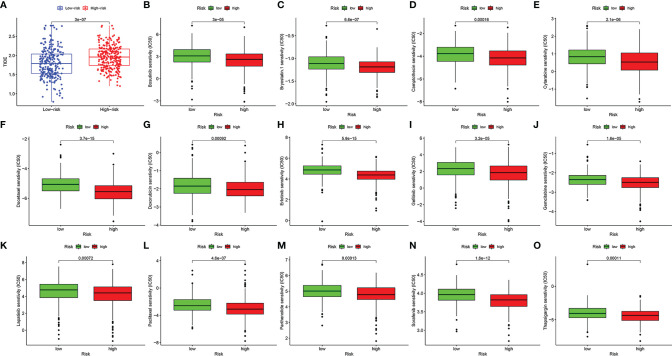
Results: We derived 15 immune-related RBPs, including FRMD4A, ASNS, RAB11FIP1, FAM120C, CFLAR, CTTN, PLEKHO1, SELENBP1, CHCHD2, NPM3, ATP2A3, CFDP1, IGF2BP2, NQO1, and DENND2D. There were significant differences in the prognoses of patients in the high- and low-risk groups in the training set (p < 0.001) and the validation set (p < 0.01). Furthermore, there were statistical differences between the high-risk group and low-risk group in immune cell infiltration and pathway and tumor mutation load (p < 0.001). In the end, we found that patients in the low-risk group were more sensitive to immunotherapy (p < 0.001), and then we screened 14 small-molecule chemotherapeutics with higher sensitivity to the high-risk group (p < 0.001).

Conclusion: The study constructed a prognostic signature of HNSCC, which might guide clinical immunotherapy in the future.

Keywords: RNA binding protein; chemotherapeutic; copy number variations; head and neck squamous cell carcinoma; immune microenvironment; immunotherapy; prognostic; tumor mutation burden.


Conflict of interest statement

The authors declare that the research was conducted in the absence of any commercial or financial relationships that could be construed as a potential conflict of interest.

Figures

Figure 1
Figure 1
Flowchart of this study. Two immune subtypes identified by single-sample gene set enrichment analysis (ssGSEA) and co-clustering analysis, and difference of infiltrating immune cells assessed by CIBERSORT deconvolution algorithm and ESTIMATE algorithm (A). Fifteen immune-related RNA-binding proteins (RBPs) screened out through “limma” package, univariate and least absolute shrinkage and selection operator (LASSO) Cox analysis, and the Kaplan–Meier curves for high- and low-expression immune-related RBP groups (B). Validation of the risk model composed of immune-related RBPs for prognosis in The Cancer Genome Atlas (TCGA) and Gene Expression Omnibus (GEO) database (C). Immune cell infiltration and pathways in high- and low-risk groups (D). Somatic mutation and copy number variations (CNVs) in high- and low-risk groups (E). Construction and calibration of prognosis nomogram (F). The differences of tumor immune dysfunction and exclusion (TIDE) score and sensitivity to chemotherapeutics of patients with head and neck squamous cell carcinoma (HNSCC) in high- and low-risk groups (G). *p < 0.05; **p < 0.01; ***p < 0.001.
Figure 2
Figure 2
Immune subtypes of head and neck squamous cell carcinoma (HNSCC) were identified based on the tumor-infiltrating immune cells. Heatmap of single-sample gene set enrichment analysis (ssGSEA) scores for Sub1 group (n = 271) and Sub2 group (n = 228) (A). Comparison of immune score (B), stromal score (C), ESTIMATE score (D), and tumor purity (E) between Sub1 and Sub2 groups. Difference of immune cell infiltration between Sub1 and Sub2 groups (F). The expressions of HLA family genes in Sub1 and Sub2 groups (G). The discrepancy of immune checkpoint genes between Sub1 and Sub2 groups, including LAG3, PDCD1, HAVCR2, CTLA4, and CD274 (H). The divergence of enrichment pathways between Sub1 and Sub2 groups (I). Kaplan–Meier curves of Sub1 and Sub2 groups (J). ***p < 0.001.
Figure 3
Figure 3
Construction of risk model for prognosis in patients with head and neck squamous cell carcinoma (HNSCC). Volcano plot exhibiting the differentially expressed immune-related RNA-binding proteins (RBPs) between Sub1 group (n = 271) and Sub2 group (n = 228) in HNSCC (A). Heatmap of differentially expressed immune-related RBPs in Sub1 and Sub2 groups (B). The result of univariate Cox analysis (C) and least absolute shrinkage and selection operator (LASSO) Cox analysis (D, E).
Figure 4
Figure 4
Application and validation of the risk model for prognosis. Samples in The Cancer Genome Atlas (TCGA) dataset were designated as training set, and samples in Gene Expression Omnibus (GEO) dataset were designated as validation set. On basis of the mean risk score of samples in training set, patients were divided into high-risk (red dot) and low-risk (green dot) groups. Distribution of the risk scores of the patients in training set (A). Distribution of survival time of patients in training set (B). The heatmap depicting the expression difference of 15 immune-related RNA-binding proteins (RBPs) between the high-risk group and the low-risk group in training set (C). Correlation between overall survival and risk score in training set (D). ROC curves of risk score for predicting 1, 3, and 5 years of overall survival in training set (E). Kaplan–Meier curves of high- and low-risk groups in training set (F). Distribution of the risk scores of the samples in validation set (H). Distribution of survival time of samples in validation set (I). The heatmap showing the expression patterns of 15 immune-related RBPs between the high- and low-risk groups in validation set (J). Correlation between overall survival and risk score in validation set (K). Receiver operating characteristic (ROC) curves of risk score for predicting 1, 3, and 5 years of overall survival in validation set (L). Kaplan–Meier curves of high- and low-risk groups in validation set (G).
Figure 5
Figure 5
Independence of risk score and construction of nomogram consisting of risk score and clinicopathological characteristics. Univariate Cox regression analysis was used to validate whether age, gender, grade, stage, T, N, and risk score had an independent influence on prognosis (A). Multivariate Cox regression analysis was used to validate whether age, gender, grade, stage, T, N, and risk score had independent influence on prognosis (B). Construction of integrated nomogram to predict survival in head and neck squamous cell carcinoma (HNSCC) (C). Calibration curve for predicting 1, 3, and 5 years of overall survival (D). *p < 0.05, **p < 0.01.
Figure 6
Figure 6
Validation of each immune-related RNA-binding protein (RBP) in the risk model. Kaplan–Meier curves showing the differences of overall survival in high- and low-expression immune-related RBPs ASNS (A), IGF2BP2 (B), CFDP1 (C), CHCHD2 (D), CTTN (E), NPM3 (F), NQO1 (G), FRMD4A (H), FAM120C (I), ATP2A3 (J), PLEKHO1 (K), RAB11FIP1 (L), DENND2D (M), CFLAR (N), and SELENBP1 (O) between high-expression (blue) group and low-expression (yellow) group.
Figure 7
Figure 7
Immune landscape of patients with head and neck squamous cell carcinoma (HNSCC) in high- and low-risk groups. Correlation matrix of 15 immune-related RNA-binding proteins (RBPs) and infiltrating immune cells (A). Comparison of immune score (B), stromal score (C), ESTIMATE score (D), and tumor purity (E). The differential expressions of HLA family genes in patients with HNSCC in high- and low-risk groups (F). The expression level of immune checkpoint genes PDCD1 (G), CD274 (H), CTLA4 (I), HAVCR2 (J), and LAG3 (K) in low-risk group and high-risk group. The correlation between risk score and immune checkpoints PDCD1 (L), CD274 (M), CTLA4 (N), HAVCR2 (O), and LAG3 (P). “ns” means p ≥ 0.05, *p < 0.05, **p < 0.01, ***p < 0.001.
Figure 8
Figure 8
Somatic mutation and copy number variations (CNVs) in high- and low-risk groups. Heatmap of somatic mutations in high-risk group (A) and low-risk group (B). The difference of tumor mutation burden between high- and low-risk groups (C). Kaplan–Meier curves showing the differences in high- and low-tumor mutation burden (TMB) groups (D). Kaplan–Meier curves revealing the differences in high-TMB and high-risk group, high-TMB and low-risk group, low-TMB and high-risk group, and low-TMB and low-risk group (E). Amplification and deletion of copy number in the high-risk group (inner) and low-risk group (outer) (F). The 20 genes with maximum CNVs in high-risk group, and the percentage meaning the proportion of patients with head and neck squamous cell carcinoma (HNSCC) who suffered gene deletion (blue) or amplification (red) in high-risk group (G). Top 20 genes with maximum CNVs in low-risk group, and the percentage representing the ratio of patients with HNSCC who suffered gene deletion (blue) or amplification (red) in low-risk group (H).
Figure 9
Figure 9
Enrichment signaling pathways of different risk groups. The pathway enrichment of gene set variation analysis (GSVA) between the low- and high-risk groups (A). The pathway enrichment of gene set enrichment analysis (GSEA) between the low- and high-risk groups (B).
Figure 10
Figure 10
The value of the risk model in predicting the efficacy of immunotherapy and chemotherapy. The score of tumor immune dysfunction and exclusion of patients with head and neck squamous cell carcinoma (HNSCC) in high- and low-risk groups (A). The box plots of the estimated IC50 for bosutinib (B), bryostatin.1 (C), camptothecin (D), cytarabine (E), docetaxel (F), doxorubicin (G), erlotinib (H), gefitinib (I), gemcitabine (J), lapatinib (K), paclitaxel (L), parthenolide (M), sorafenib (N), and thapsigargin (O).

Similar articles

Cited by

References

    1. Bray F, Ferlay J, Soerjomataram I, Siegel RL, Torre LA, Jemal A. Global Cancer Statistics 2018: GLOBOCAN Estimates of Incidence and Mortality Worldwide for 36 Cancers in 185 Countries. CA Cancer J Clin (2018) 68(6):394–424. doi: 10.3322/caac.21492 - DOI - PubMed
    1. Takeuchi T, Kawasaki H, Luce A, Cossu AM, Misso G, Scrima M, et al. . Insight Toward the Microrna Profiling of Laryngeal Cancers: Biological Role and Clinical Impact. Int J Mol Sci (2020) 21(10):3693. doi: 10.3390/ijms21103693 - DOI - PMC - PubMed
    1. Galot R, Le Tourneau C, Guigay J, Licitra L, Tinhofer I, Kong A, et al. . Personalized Biomarker-Based Treatment Strategy for Patients With Squamous Cell Carcinoma of the Head and Neck: EORTC Position and Approach. Ann Oncol (2018) 29(12):2313–27. doi: 10.1093/annonc/mdy452 - DOI - PubMed
    1. Li Q, Xu L, Li Y, Yang R, Qiao Q, Wang Y, et al. . P2RY14 Is a Potential Biomarker of Tumor Microenvironment Immunomodulation and Favorable Prognosis in Patients With Head and Neck Cancer. Front Genet (2021) 12:670746. doi: 10.3389/fgene.2021.670746 - DOI - PMC - PubMed
    1. Quail DF, Joyce JA. Microenvironmental Regulation of Tumor Progression and Metastasis. Nat Med (2013) 19(11):1423–37. doi: 10.1038/nm.3394 - DOI - PMC - PubMed