. 2022 Apr 7;1(1):88-118.
doi: 10.1080/27694127.2022.2042054. eCollection 2022.

The ATG5 interactome links clathrin-mediated vesicular trafficking with the autophagosome assembly machinery

Affiliations

The ATG5 interactome links clathrin-mediated vesicular trafficking with the autophagosome assembly machinery

Kiren Baines et al. Autophagy Rep. .

Abstract

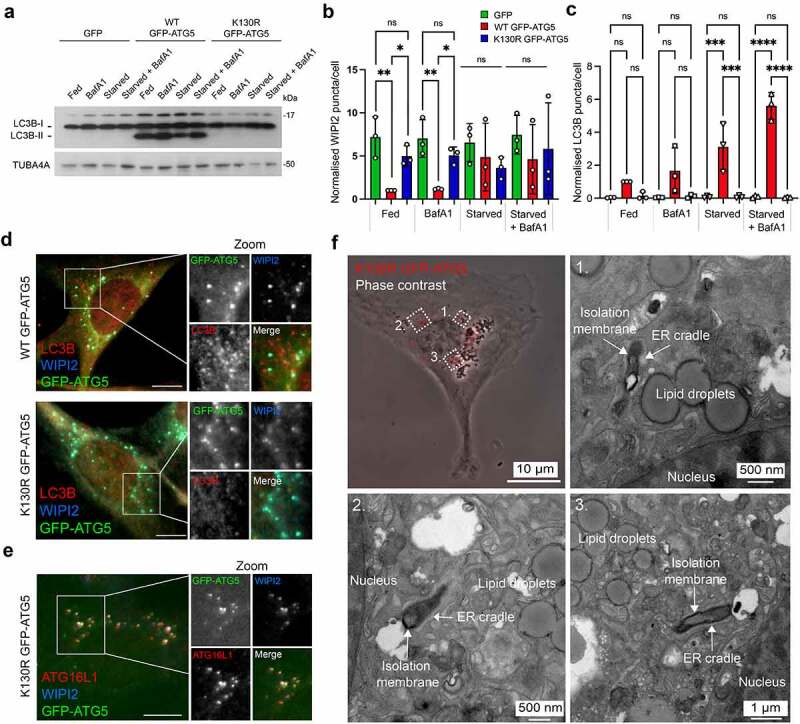
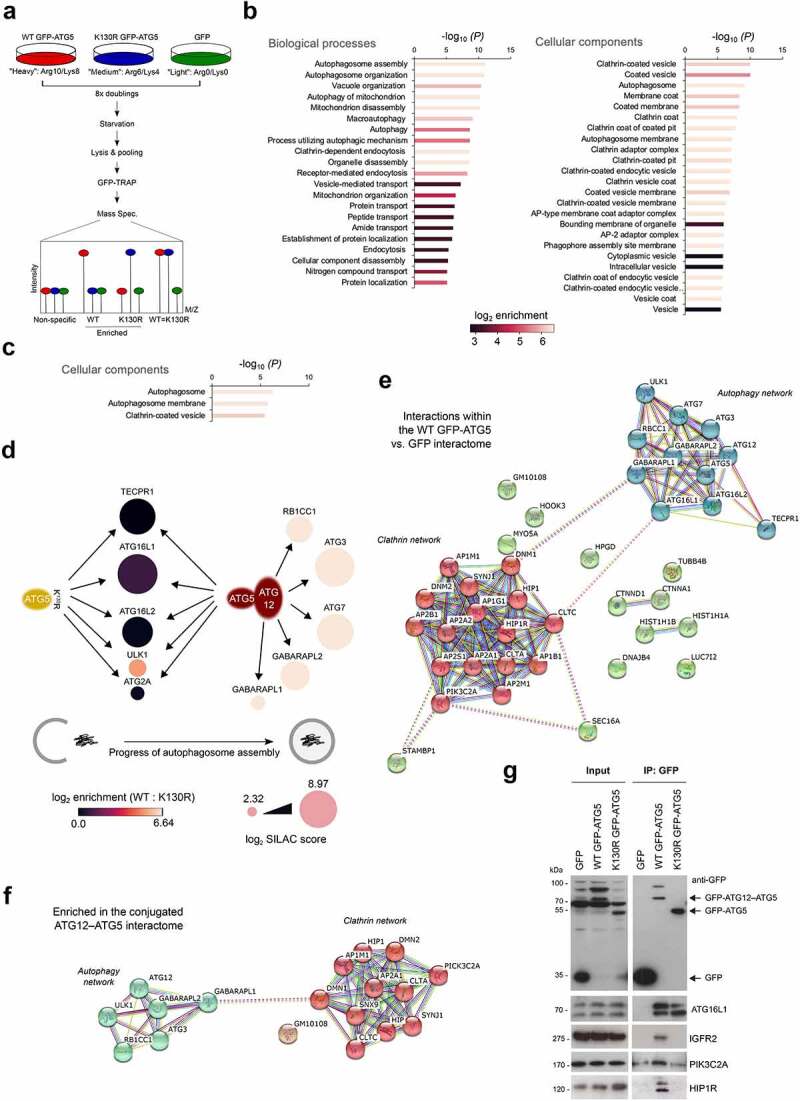
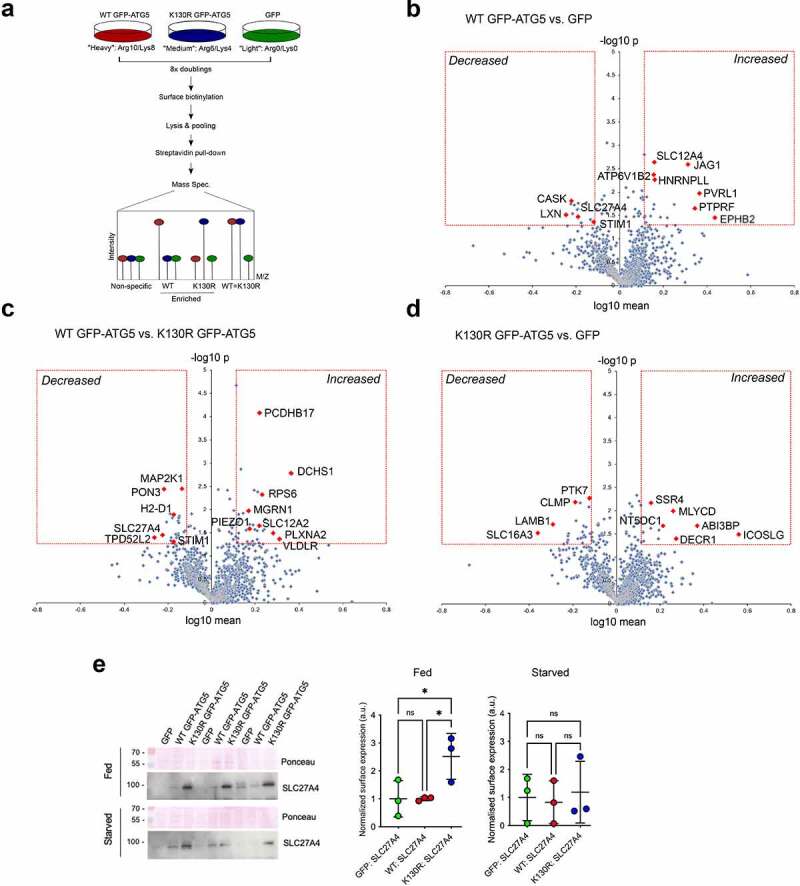
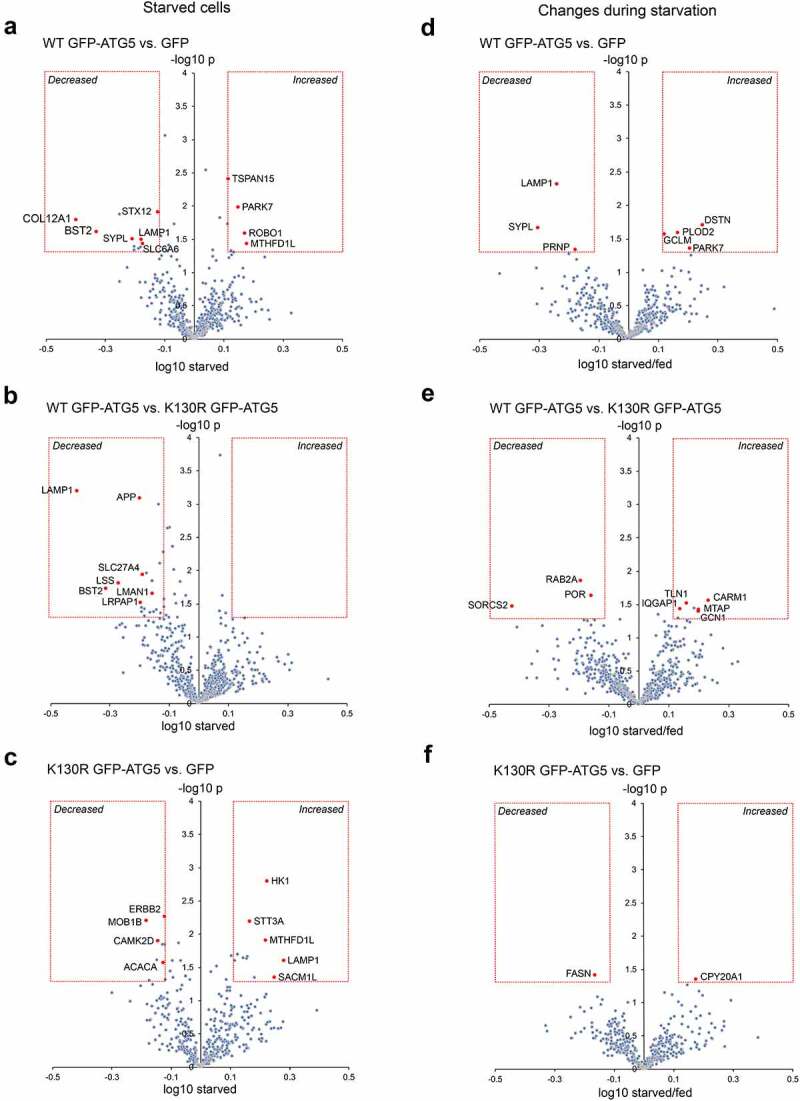
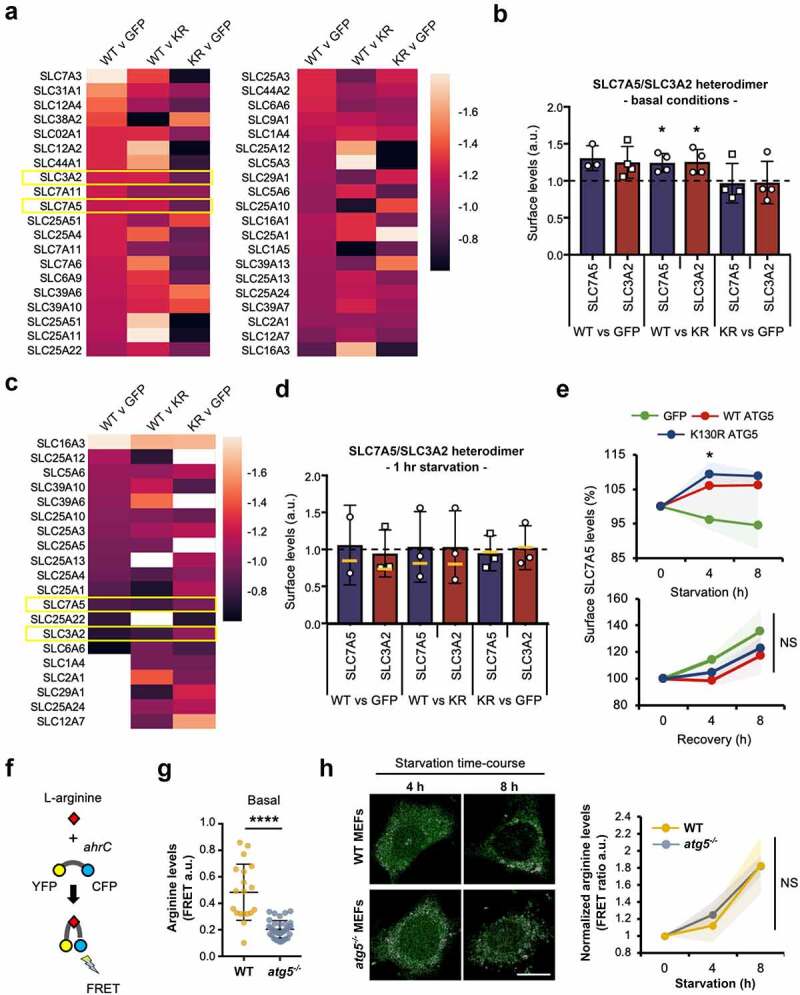
Autophagosome formation involves the sequential actions of conserved ATG proteins to coordinate the lipidation of the ubiquitin-like modifier Atg8-family proteins at the nascent phagophore membrane. Although the molecular steps driving this process are well understood, the source of membranes for the expanding phagophore and their mode of delivery are only now beginning to be revealed. Here, we have used quantitative SILAC-based proteomics to identify proteins that associate with the ATG12-ATG5 conjugate, a crucial player during Atg8-family protein lipidation. Our datasets reveal a strong enrichment of regulators of clathrin-mediated vesicular trafficking, including clathrin heavy and light chains, and several clathrin adaptors. Also identified were PIK3C2A (a phosphoinositide 3-kinase involved in clathrin-mediated endocytosis) and HIP1R (a component of clathrin vesicles), and the absence of either of these proteins alters autophagic flux in cell-based starvation assays. To determine whether the ATG12-ATG5 conjugate reciprocally influences trafficking within the endocytic compartment, we captured the cell surface proteomes of autophagy-competent and autophagy-incompetent mouse embryonic fibroblasts under fed and starved conditions. We report changes in the relative proportions of individual cell surface proteins and show that cell surface levels of the SLC7A5-SLC3A2 amino acid transporter are influenced by autophagy capability. Our data provide evidence for direct regulatory coupling between the ATG12-ATG5 conjugate and the clathrin membrane trafficking system and suggest candidate membrane proteins whose trafficking within the cell may be modulated by the autophagy machinery. Abbreviations: ATG, autophagy related; BafA1, bafilomycin A1; GFP, green fluorescent protein; HIP1R, huntingtin interacting protein 1 related; MEF, mouse embryo fibroblast; PIK3C2A, phosphatidylinositol-4-phosphate 3-kinase catalytic subunit type 2 alpha; SILAC, stable isotope labelling with amino acids in culture; SQSTM1, sequestosome 1; STRING, search tool for the retrieval of interacting genes/proteins.

Keywords: ATG12; ATG5; HIP1R; PIK3C2A; autophagy; clathrin; endocytosis; proteomics.


Conflict of interest statement

The authors report no potential competing interests.

Figures

Figure 1.
Figure 1.
Characterization of the ATG5 cell-lines used for SILAC proteomics analysis of the ATG5 interactome. (A) Immunoblot of atg5−/− MEFs stably rescued with GFP, wild-type (WT) GFP-ATG5 or GFP-ATG5K13°R. Cells were incubated for 1 h in full-nutrient media or in HBSS (starvation), in the absence or presence of BafA1. Lysates were probed for LC3B and TUBA4A. Only the WT GFP-ATG5 rescued cells are capable of lipidating LC3B. (B) WIPI2 and (C) LC3B puncta analysis in fed and starved rescued MEFs, in the absence or presence of BafA1. Charts show mean ± SD; n = 3; 10 fields of cells per condition per experiment, normalized to WT GFP-ATG5 cells in the fed state; statistical significance calculated using ANOVA, followed by Tukey’s multiple comparison test. (***P < 0.001, **P < 0.01, *P < 0.05). (D, E) Markers of the early autophagosome colocalize with GFP-ATG5 in rescued MEFs. Example images of starved atg5−/− MEFs stably expressing WT GFP-ATG5 or GFP-ATG5K13°R, fixed then stained with antibodies against WIPI2 and LC3B (D), or WIPI2 and ATG16L1 (E). Bar: 10 µm. (F) CLEM analysis of starved atg5−/− MEFs stably rescued with GFP-ATG5K13°R. Panel top left shows a phase contrast image of a cell, with GFP-ATG5K13°R puncta superimposed and false colored red. Panels 1-3 show example fields of areas depicted in the phase contrast image, with stalled phagophores.
Figure 2.
Figure 2.
Analysis of the ATG5 interactome. (A) Schematic of the SILAC protocol for enrichment of ATG5 interacting proteins. (B) Gene ontology analysis of the WT GFP-ATG5 interactome (>2-fold enrichment over GFP). Interacting protein families are separated into biological processes (left) and cellular components (right), with bars colored for log2 enrichment. (C) Gene ontology analysis of the conjugated ATG12–ATG5 interactome (>2-fold enrichment over GFP-ATG5K13°R). (D) Schematic of the autophagy protein interactions identified in the WT GFP-ATG5 and GFP-ATG5K13°R interactomes (vs. GFP). Circles representing proteins are sized by log2 SILAC “score” as an indicator of confidence within the dataset, and are shaded according to log2 enrichment of WT GFP-ATG5 vs. GFP-ATG5K13°R. (E) STRING analysis of the high confidence WT GFP-ATG5 vs. GFP interactome showing 2 distinct interaction hubs: autophagosome biogenesis and clathrin-mediated vesicular trafficking. (F) STRING analysis of the high confidence conjugated ATG12–ATG5 interactome. (G) Immunoblots of selected candidate interactors. GFP-TRAP immunoisolates were prepared from GFP, WT GFP-ATG5 and GFP-ATG5K13°R MEFs following1 h starvation.
Figure 3.
Figure 3.
Autophagic flux deficiencies in pik3c2a null cells. (A, B) Immunofluorescence images of pik3c2afl°x/fl°x MEFs under full nutrients or starved, in the absence or presence of BafA1, without (A) and with (B) addition of Cre recombinase. Cells were fixed then stained with antibodies against LC3B (red) and WIPI2 (green). DAPI staining is in blue. Bar: 10 µm. (C) Immunoblot of pik3c2afl°x/fl°x MEFs showing loss of PIK3C2A following incubation with Cre recombinase. WIPI2 (D) and LC3B (E) puncta quantification in fed or starved cells in the absence or presence of BafA1. Mean ± SD; n = 3; 10 fields of cells per condition per experiment, normalized to control/fed conditions; statistical significance calculated using ANOVA, followed by Tukey’s multiple comparison test. (***P < 0.001, **P < 0.01, *P < 0.05). (F-H) Immunoblot analysis of SQSTM1 levels and LC3B lipidation status in pik3c2afl°x/fl°x MEFs under full nutrients or starved, in the absence or presence of BafA1. Example immunoblot (F), and densitometry quantification for LC3B-II:LC3B-I (G) and SQSTM1 (H). Mean ± SD; n = 3-4 immunoblots, normalized to GAPDH (SQSTM1 blots) and fed condition -Cre; statistical significance calculated using one-way ANOVA, followed by Tukey’s Range test. (*P < 0.05).
Figure 4.
Figure 4.
Autophagic flux deficiencies in hip1r null cells. (A-B) Immunofluorescence images of wild-type (A) and hip1r−/− (B) MEFs under full nutrients or starved, in the absence or presence of BafA1. Cells were fixed then stained with antibodies against LC3B (red) and WIPI2 (green). DAPI staining is in blue. Bar: 10 µm. (C) Immunoblot of wild-type and hip1r−/− MEFs. WIPI2 (D) and LC3B (E) puncta quantification in fed or starved cells in the absence or presence of BafA1. Mean ± SEM; n = 3; 10 fields of cells per condition per experiment; statistical significance calculated using ANOVA, followed by Tukey’s Range test. (***P < 0.001, **P < 0.01, *P < 0.05). (F-H) Immunoblot analysis of SQSTM1 levels and LC3B lipidation status in wild-type and hip1r null MEFs grown in full nutrients or starved, in the absence or presence of BafA1. Example immunoblot (F), and densitometry quantification for SQSTM1 (G) and LC3B-II:LC3B-I (H). Mean ± SD; n = 3 immunoblots, normalized to GAPDH (SQSTM1 blots) and wild-type cells in fed condition; statistical significance calculated using one-way ANOVA, followed by Tukey’s multiple comparison test. (*P < 0.05).
Figure 5.
Figure 5.
Surface protein abundances in atg5−/− MEF rescued with GFP, WT GFP-ATG5 or GFP-ATG5K13°R. (A) Schematic of the SILAC protocol for enrichment of biotinylated surface proteins in the rescued atg5−/− MEF cell lines. (B-D) Pairwise comparisons of surface protein abundances analyzed by surface biotinylation-streptavidin affinity isolation and SILAC quantitative proteomics in fed conditions, plotting log10 mean fold-change against -log10 p value (T-test), for the following combinations: (B) WT GFP-ATG5 vs. GFP; (C) WT GFP-ATG5 vs. GFP-ATG5K13°R; (D) GFP-ATG5K13°R vs. GFP. The red boxes indicate those proteins whose levels were either increased or decreased above an arbitrary 1.3-fold cut-off, with statistical significance p<0.05. Proteins that fall into these categories are listed in Tables S7-S9. Red diamonds depict selected proteins of potential interest. (E) Immunoblot analysis of surface SLC27A4 in the rescued atg5−/− MEF cell-lines under fed and starved conditions. Densitometry measurements were normalized to Ponceau intensity, and are depicted relative to the GFP-expressing MEF mean value.
Figure 6.
Figure 6.
Surface protein abundances during starvation in atg5−/− MEF rescued with GFP, WT GFP-ATG5 or GFP-ATG5K13°R. Pairwise comparisons of surface protein abundance analyzed by surface biotinylation/streptavidin pull-down and SILAC quantitative proteomics in starvation conditions (1 h) (A-C), and changing surface protein abundances from fed to starvations conditions (D-F). Pairwise surface protein expression analyses: (A, D) WT GFP-ATG5 vs. GFP; (B, E) WT GFP-ATG5 vs. GFP-ATG5K13°R; (C, F) GFP-ATG5K13°R vs. GFP. (D-F) To indicate changes in surface expression between fed and starved states, x-axes depict log10 ratio of starved/fed values. In all examples, the red boxes indicate 1.3-fold enrichment cut-off, with statistical significance p<0.05 (T-test). Proteins that fall into these categories are listed in Tables S10, S11. Red diamonds depict selected proteins of potential interest.
Figure 7.
Figure 7.
Surface amino acid transporter abundancies and basal cytosolic arginine levels are affected by autophagy capability. (A) Combinatorial heatmap analysis of selected surface transporter abundancies obtained from the SILAC datasets, compared between WT GFP-ATG5, GFP-ATG5K13°R and GFP rescued atg5−/− MEFs (n = 3-4). SLC3A2 and SLC7A5 are highlighted in the boxed regions. (B) Basal surface SLC3A2-SLC7A5 levels are higher in cells expressing WT GFP-ATG5 (T-test; * = p<0.05). (C) Combinatorial heatmap analysis of selected surface transporters (n = 3). SLC3A2 and SLC7A5 are highlighted in the boxed regions. Where no color is shown, transporters were not identified in the relevant pairwise starved datasets. (D) SLC7A5-SLC3A2 surface levels normalise following a short period of starvation (1 h) across the different rescued atg5−/− cell-lines. Bars show values after 1 h starvation; yellow lines indicate starvation-induced changes in relative abundance (starvation/basal). Data for SLC7A5 in the WT GFP-ATG5 vs. GFP pairwise analysis are depicted despite this transporter being identified in only 2 of the 3 SILAC datasets. (E) Extended starvation is associated with increased surface SLC7A5 levels in atg5−/− MEFs expressing either WT GFP-ATG5 or GFP-ATG5K13°R relative to GFP expressing cells. Surface SLC7A5 levels were assessed by flow cytometry during starvation (up to 8 h; top) and following amino acid/growth factor replenishment (up to 8 h recovery; bottom). Graphs show means +/- SD (shaded areas). NS = not significant. (F-H) Arginine FRET suggests that autophagy capability and the presence of ATG5 influence cytosolic arginine levels. (F) Cartoon explaining the arginine FRET reporter, comprising YFP and CFP separated by the ahrC arginine repressor which undergoes a conformational change upon arginine binding to enable FRET. (G) Basal cytosolic arginine levels in wild-type and atg5−/− MEFs (a.u. = arbitrary units; **** = p<0.0001). (H) Changes in cytosolic arginine levels during prolonged starvation in wild-type and atg5−/− MEFs. Means +/- SD (shaded areas). NS = not significant.

Similar articles

Cited by

References

    1. Dikic, I. and Elazar Z., Mechanism and medical implications of mammalian autophagy. Nat Rev Mol Cell Biol, 2018. 19(6): p. 349–364. - PubMed
    1. Nakatogawa, H., Two ubiquitin-like conjugation systems that mediate membrane formation during autophagy. Essays Biochem, 2013. 55: p. 39–50. - PubMed
    1. Lamb, C.A., Yoshimori T., and Tooze S.A., The autophagosome: origins unknown, biogenesis complex. Nat Rev Mol Cell Biol, 2013. 14(12): p. 759–74. - PubMed
    1. Valverde, D.P., et al., ATG2 transports lipids to promote autophagosome biogenesis. J Cell Biol, 2019. - PMC - PubMed
    1. Axe, E.L., et al., Autophagosome formation from membrane compartments enriched in phosphatidylinositol 3-phosphate and dynamically connected to the endoplasmic reticulum. J Cell Biol, 2008. 182(4): p. 685–701. - PMC - PubMed