Review
. 2022 Mar 28:12:749579.
doi: 10.3389/fneur.2021.749579. eCollection 2021.

The Legacy of the TTASAAN Report-Premature Conclusions and Forgotten Promises: A Review of Policy and Practice Part I

Affiliations
Review

The Legacy of the TTASAAN Report-Premature Conclusions and Forgotten Promises: A Review of Policy and Practice Part I

Dan G Pavel et al. Front Neurol. .

Abstract

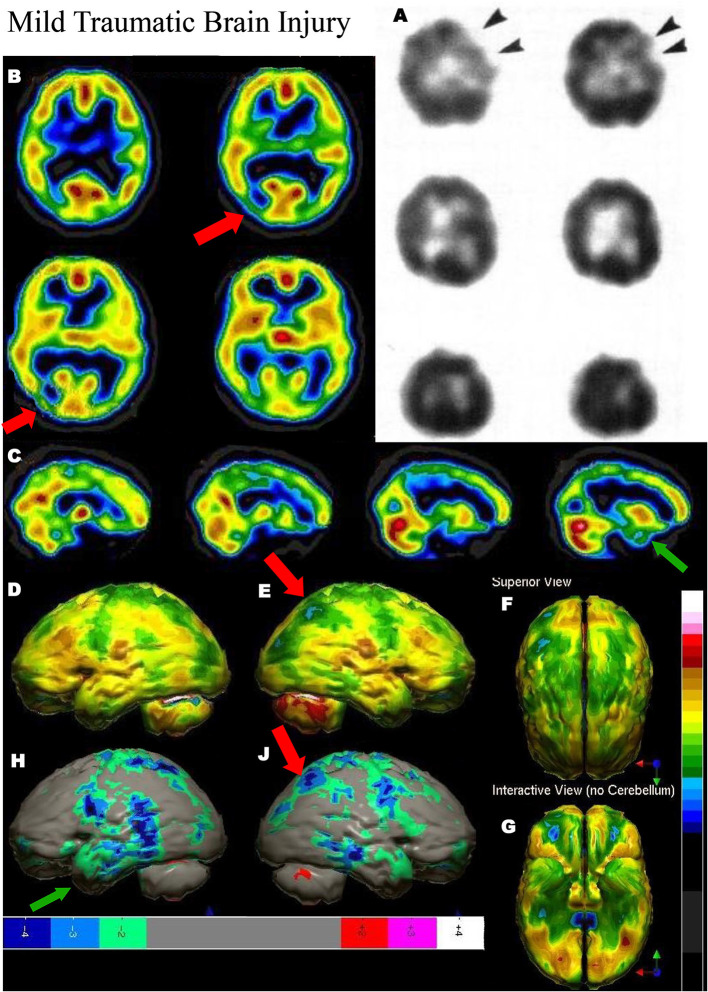
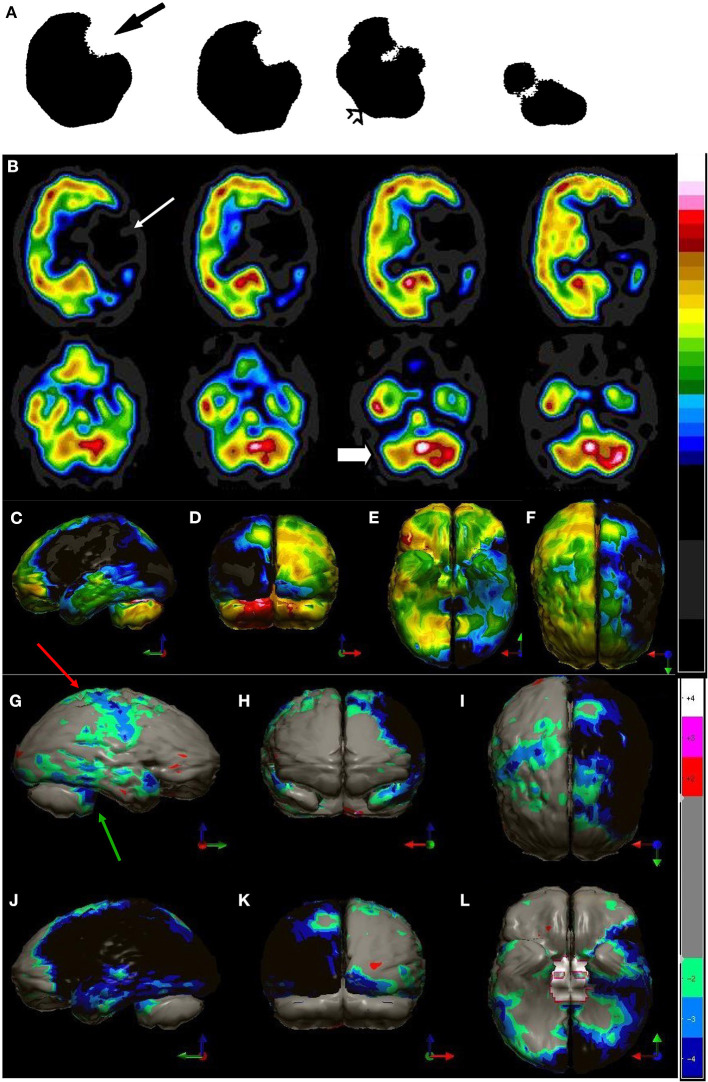
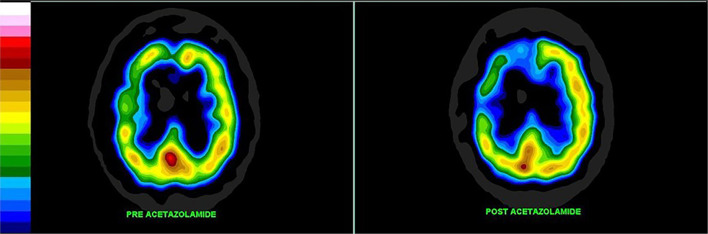
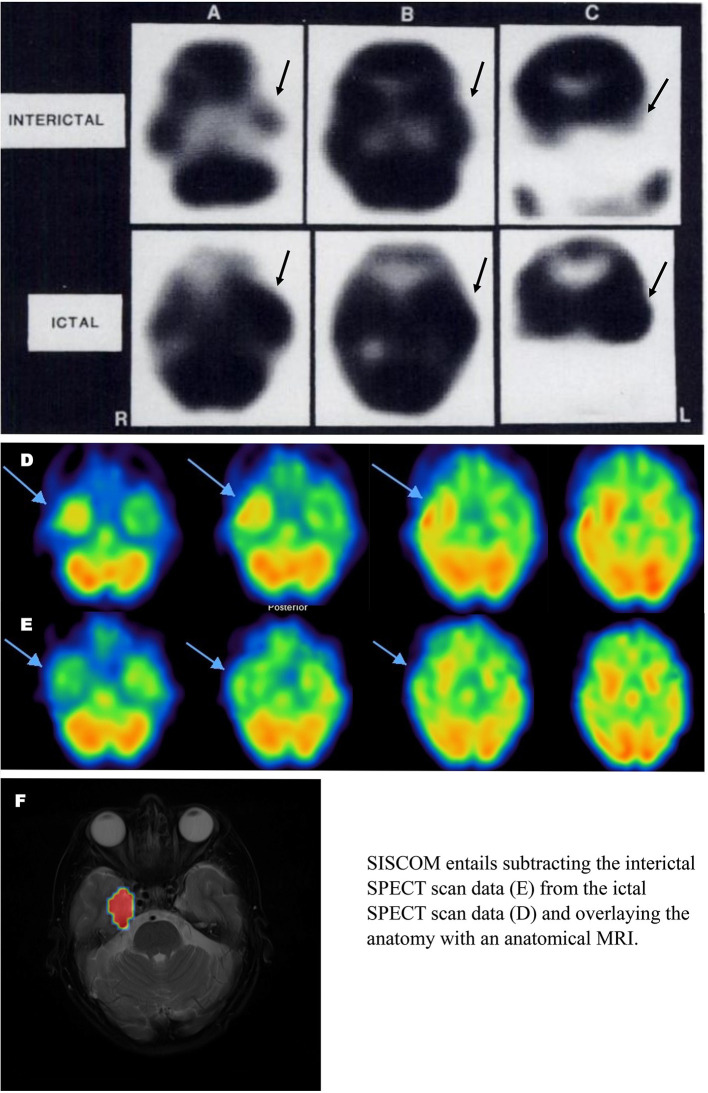
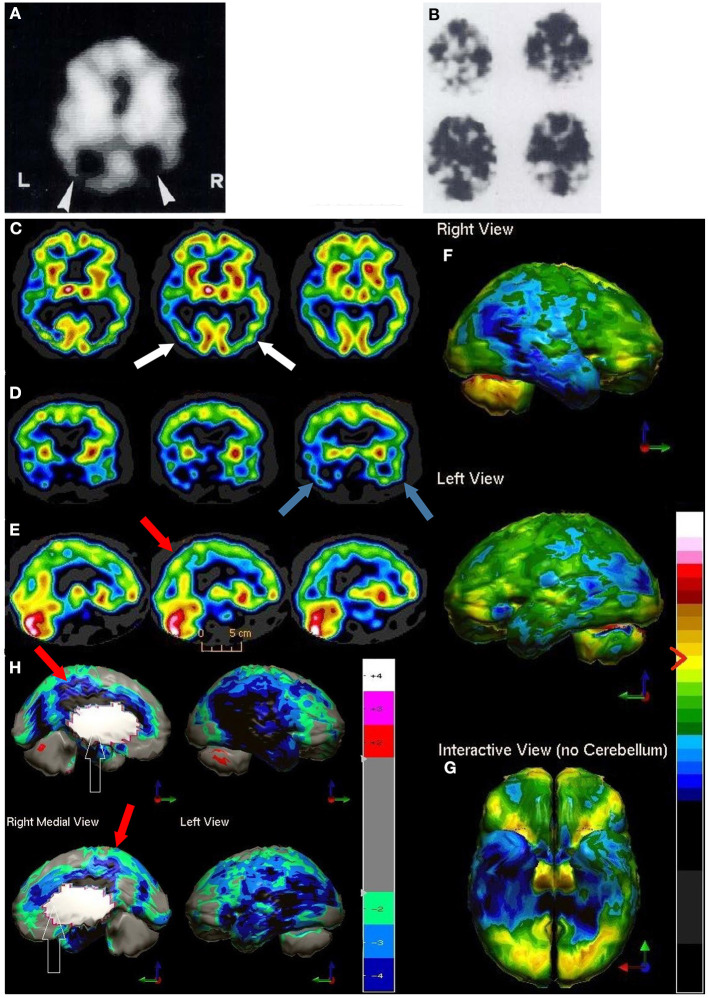
Brain perfusion single photon emission computed tomography (SPECT) scans were initially developed in 1970's. A key radiopharmaceutical, hexamethylpropyleneamine oxime (HMPAO), was originally approved in 1988, but was unstable. As a result, the quality of SPECT images varied greatly based on technique until 1993, when a method of stabilizing HMPAO was developed. In addition, most SPECT perfusion studies pre-1996 were performed on single-head gamma cameras. In 1996, the Therapeutics and Technology Assessment Subcommittee of the American Academy of Neurology (TTASAAN) issued a report regarding the use of SPECT in the evaluation of neurological disorders. Although the TTASAAN report was published in January 1996, it was approved for publication in October 1994. Consequently, the reported brain SPECT studies relied upon to derive the conclusions of the TTASAAN report largely pre-date the introduction of stabilized HMPAO. While only 12% of the studies on traumatic brain injury (TBI) in the TTASAAN report utilized stable tracers and multi-head cameras, 69 subsequent studies with more than 23,000 subjects describe the utility of perfusion SPECT scans in the evaluation of TBI. Similarly, dementia SPECT imaging has improved. Modern SPECT utilizing multi-headed gamma cameras and quantitative analysis has a sensitivity of 86% and a specificity of 89% for the diagnosis of mild to moderate Alzheimer's disease-comparable to fluorodeoxyglucose positron emission tomography. Advances also have occurred in seizure neuroimaging. Lastly, developments in SPECT imaging of neurotoxicity and neuropsychiatric disorders have been striking. At the 25-year anniversary of the publication of the TTASAAN report, it is time to re-examine the utility of perfusion SPECT brain imaging. Herein, we review studies cited by the TTASAAN report vs. current brain SPECT imaging research literature for the major indications addressed in the report, as well as for emerging indications. In Part II, we elaborate technical aspects of SPECT neuroimaging and discuss scan interpretation for the clinician.

Keywords: ADHD; PTSD-posttraumatic stress disorder; bipolar disorder; dementia; depression; neurotoxicity; seizure; traumatic brain injury.


Conflict of interest statement

DP is Director of PathFinder Brain SPECT which is a clinical service corporation providing SPECT functional neuroimaging and had no research funding. He is deceased. TH is the president and principal owner of The Synaptic Space, a neuroimaging consulting firm. He is also CEO and Chairman of the Board of Neuro-Luminance Corporation, a medical service company. He is also president and principal owner of Dr. Theodore Henderson, Inc., a medical service company. He is also Vice-President of the Neuro-Laser Foundation, a non-profit organization. He is a member of and a former officer of the Brain Imaging Council Board of the Society of Nuclear Medicine and Molecular Imaging (SNMMI). Since 2017, he has served in the SNMMI Brain Imaging Outreach Working Group. Currently, he serves as president of the International Society of Applied Neuroimaging. TH has no ownership in, and receives no remuneration from, any neuroimaging company. No more than 5% of his income is derived from neuroimaging. SD is President of Good Lion Imaging LLC involved in the post-processing and display of functional brain scan data. The reviewer DA declared a past co-authorship with one of the authors TH to the handling editor.

Figures

Figure 1
Figure 1
Perfusion SPECT scan of normal control. (A) Four horizontal tomograms from a 99mTc-ECD perfusion SPECT scan performed on a single-headed gamma camera in 1989 [The figure was originally published in JNM. © SNMMI (25)]. (B) Eight horizontal tomograms from a modern 99mTc-HMPAO perfusion SPECT scan obtained from a dual-headed gamma camera. The color scale is scaled relative to the patient's mean cerebral perfusion. Mean blood flow (72%) is in yellow. Color shifts occur at approximately every 0.5 SD (3%) relative to the patient's mean. Details of the brain can be appreciated, including the thalamus, head of the caudate nuclei, lentiform nuclei, anterior cingulate gyri, and distinct cortical regions. (C) The modern SPECT scan displayed in 3-dimensional reconstruction. Increased perfusion in the visual cortex and the slightly lower average perfusion level in the temporal lobes bilaterally can be appreciated. The color scale is the same as (B).
Figure 2
Figure 2
Humans, like all primates, have superior discrimination of color vision. While greyscale allows superior detail discrimination, it does not foster the detection of changes in intensity. Since functional neuroimaging is about changes in the intensity of the signal, it is important that the observer can readily detect small changes. (A) Various commonly used color scales and a greyscale are displayed. The mean cerebral perfusion in the human brain is 70.3% of the maximal flow with a standard deviation (SD) of 8.35%. The mean and ± 1, 2 SD, 3 SD, and 4 SD are indicated. A change of ± 2 SD is unlikely to be appreciated in greyscale but can be readily distinguished in Heated Object, Ubiq40, and DGP40 color scales. An increase of 2 SD can be distinguished in Hot and Cold color scale, but a decrease of 2 SD or less would not be discernable. A 1 SD increase or decrease would be difficult to discern in greyscale, Heated Object and Hot and Cold color scale, but are readily detected in Ubiq40 and DGP40. (B) A representative low quality 99mTc-HMPAO perfusion SPECT scan demonstrates poor technique with the inclusion of extracranial structures. The scan was read in greyscale and interpreted as a normal scan. (C) The same patient was rescanned with proper technique. Decreased perfusion in the posterior frontal and temporal cortices can be appreciated when viewed using the Ubiq40 color scale. (D) The patient's data is compared to a normative database (N = 68). A map of statistically significant differences can be generated using the Oasis software by Segami, Inc. Here, the color scale indicates gray for areas that do not differ significantly from the normative database. In contrast, areas of green, light blue, and dark blue represent areas of more than 2, 3, and 4 SD below the mean perfusion of the normative database, respectively. Statistically significant increases in perfusion are illustrated in the red color scale. Decreased perfusion in the bilateral temporal cortex and bilateral posterior frontal cortex, but with sparing of the anterior cingulate gyri, can be appreciated. The findings are consistent with mild cognitive impairment of the frontal-temporal variant and the patient showed consistent findings on neuropsychological assessment.
Figure 3
Figure 3
(A–C) Examples of SPECT scans cited in TTASAAN report. Anatomical details are lacking. (A) 40-year-old female with major head trauma showed decreased perfusion of the right temporal lobe, whilst CT and MRI scans were normal [The figure was originally published in JNM. © SNMMI (26)], (B) 45-year-old male thrown from a horse showed decreased bilateral occipital perfusion [The figure was originally published in JNM. © SNMMI (27)]; (C) 37-year-old female with major head trauma from a motor vehicle accident (MVA). Perfusion is decreased in the bilateral frontal and temporal lobes [The figure was originally published in JNM. © SNMMI (28)]. (D–F) A 19-year-old woman was involved in a head-on collision MVA as a passenger. She suffered severe trauma to the back of her head. A modern 99mmTc-HMPAO perfusion SPECT scan was performed with a dual-head camera. (D) Horizontal tomograms (non-sequential, break in sequence shown by cross-hatched bar) illustrate intact cortical function but marked hypoperfusion in the cerebellum bilaterally (red arrows). (E) Coronal tomograms (non-sequential). (F) Sagittal tomograms (sequential). (G) 3-D representation of SPECT scan data illustrating a small area of marked hypoperfusion in the left frontal cortex (white arrow) and profound hypoperfusion in the cerebellum (yellow arrows) which is more pronounced in the medial aspects. (H) The patient's data is compared to a normative database using Segami Inc. Oasis software. The color scale is the same as in Figure 2D. The injury to the left frontal cortex and lateral aspects of the frontal cortex can more clearly be visualized. Area of white in the right medial view is an area where there is no statistical comparison data.
Figure 4
Figure 4
Tomographic and multiple 3-D representations of major TBI. A 58-yr-old female was struck on the right parietal region by a heavy object with loss of consciousness of approximately 2 hours. Perfusion SPECT scan was performed seven years after the injury with 99mmTc-HMPAO and a dual-head gamma camera. (A) 4mm horizontal sections illustrate decreased perfusion in the right parietal region (red arrow). The color scale is the same as Figure 1B. (B) SPECT data can be displayed in 3-D representations that facilitate the identification of large, diffuse, or subtle lesions. Here, data is presented as an isocontour display wherein cortical areas which fall below 60% of the maximal cerebral blood flow are displayed as a depression or hole. The large parietal defect is apparent on the right (red arrow), as well as bilateral temporal lobe hypoperfusion (green arrow). (C) Another 3-D representation utilizes the same color scale as (A). The right parietal defect appears as an area of blue and green (red arrow). A contra-coup injury can be visualized in this representation (white arrowhead). Temporal lobe hypoperfusion is again evident bilaterally (green arrow). (D) The patient's data is compared to a normative database using Segami Inc. Oasis software. The color scale is the same as in Figure 2D. The parietal lobe injury (red arrow) and the contra-coup injury are easily visualized, along with more diffuse penumbra injury and bilateral lateral temporal lobe hypoperfusion (green arrows). (E) Anatomical MRI completed at the time of the SPECT scan showed no abnormalities. Section at same level as far right horizontal tomogram in (A).
Figure 5
Figure 5
Mild TBI. (A) Example of SPECT scans cited in TTASAAN report. Anatomical details are lacking. 50-year-old male with minor head trauma after a motor vehicle accident showed decreased perfusion of the left inferior frontal and left anterior temporal lobe, whilst MRI scan was normal [The figure was originally published in JNM. © SNMMI (28)]. (B–G) A 2019 SPECT scan using a dual-headed gamma camera of an 18-year-old male who struck a tree while mountain biking and briefly lost consciousness. A modern 99mmTc-HMPAO perfusion SPECT scan was performed with a dual-head gamma camera. (B) Horizontal tomograms show detail of thalamus, anterior cingulate, caudate, and lentiform nuclei. A focal area of hypoperfusion can be seen in the right parietal cortex (red arrow). Color scale is the same as in Figure 1B. (C) Sagittal tomograms reveal decreased inferior frontal perfusion and decreased medial temporal perfusion bilaterally (green arrow). (D–G) 3-D representation of SPECT scan data showing left lateral (D), right lateral showing the area of hypoperfusion in the right parietal cortex (red arrow) (E), superior (F), and inferior views (G). (H–J) The patient's data is compared to a normative database using Segami Inc. Oasis software. The color scale is the same as in Figure 2D. Areas of relatively decreased perfusion are more evident, such as the area of hypoperfusion in the right parietal cortex (red arrow).
Figure 6
Figure 6
(A) Example of SPECT scan studies cited in TTASAAN report. Anatomical details are lacking. A 99mTc-ECD perfusion SPECT scan from 1989 illustrating a left middle cerebral artery stroke (black arrow) with crossed cerebellar diaschisis (open arrow). This scan was performed on a single-head gamma camera [The figure was originally published in JNM. © SNMMI (25)]. (B) Modern 99mTc-HMPAO SPECT scan using a dual-head gamma camera illustrating a left middle and posterior cerebral artery stroke (white arrow) involving the left posterior frontal, temporal, parietal, and occipital cortices. Color scale is the same as in Figure 1B. Crossed cerebellar diaschisis is apparent (white block arrow), as well as involvement of the left thalamus and left basal ganglia. (C–F) left lateral, posterior, inferior (cerebellum removed) and superior 3-dimensional views, respectively. (G–L) Right lateral, frontal, superior, left lateral, posterior, and inferior (cerebellum removed) views of scan compared to normative database. Color scale is the same as in Figure 2D. Involvement of the contralateral cortex (red arrow) and the crossed cerebellar diaschisis (green arrow) are evident.
Figure 7
Figure 7
Patient with high grade carotid stenosis and multiple co-morbidities. The left hemisphere (on the right of the image) is able to augment its blood flow with acetazolamide, but there is restriction of flow to the right side leading to relative deterioration in right perfusion after acetazolamide administration, compared to the left. Color scale is the same as Figure 1B. Courtesy of J. Cardaci, MBBS, FAANMS, FRACP - Diagnostic Nuclear Imaging, Perth, West Australia; University of Notre Dame, Fremantle, Australia.
Figure 8
Figure 8
Ictal and Interictal SPECT (A–C) Example of SPECT scan studies cited in TTASAAN report. Perfusion tracer is iodinated N,N,N'-trimethyl-N'-(2-hydroxy-3– methyl-5-iodobenzyl)-1,3-propane-diamine (HIPDM). Anatomical details are lacking [The figure was originally published in JNM. © SNMMI (149)]. (D,E) Modern 2021 HMPAO SPECT perfusion scans for seizure localization. (D) Ictal scan. (E) Interictal scan. (F) SISCOM image wherein interictal scan data is subtracted from ictal scan data and the resulting data is overlayed on an anatomical MRI. Images courtesy of– Leonard Numerow MD FRCP(C), Radiology and Nuclear Medicine, Cumming School of Medicine, University of Calgary, Calgary, Alberta, Canada.
Figure 9
Figure 9
(A,B) Examples of SPECT scan studies cited in TTASAAN report. Anatomical details are lacking. (A) An 99mTc-HMPAO perfusion SPECT performed in 1988 using a single head gamma camera illustrated a 75-year-old male with severe dementia and showed decreased perfusion of the bilateral parietal cortices [The figure was originally published in JNM. © SNMMI (202)]. (B) Example of 133Xenon perfusion SPECT scan obtained with a ring-type tomogram circa 1988 [The figure was originally published in JNM. © SNMMI (180)]. C-H) Modern 99mTc-HMPAO SPECT scan performed on a dual-head camera illustrating Alzheimer's disease. (C–E) Horizontal, coronal, and sagittal tomograms, respectively, show decreased perfusion of the bilateral parietal cortices (white arrows), bilateral temporal cortices (blue arrows) and the posterior cingulate gyri (red arrow). Color scale is the same as in Figure 1B. (F,G) 3-D representation of SPECT scan data showing right lateral, left lateral (F), and inferior views (G). In the 3-D representations the asymmetry is much better seen with greater involvement of the right parietal and temporal lobes. (H) The patient's data is compared to a normative database using Segami Inc. Oasis software. The color scale is the same as in Figure 2D. Areas of relatively decreased perfusion are much more evident. The hypoperfusion of the posterior cingulate gyri (red arrows) is much better demonstrated.

Similar articles

Cited by

References

    1. Report of the Therapeutics Technology Assessment Subcommittee of the American Academy of Neurology . Assessment of brain SPECT. Neurology. (1996) 46:278–85. 10.1212/WNL.46.1.278 - DOI - PubMed
    1. Kapucu OL, Nobili F, Varrone A, Booij J, Vander Borght T, Någren K, et al. . EANM procedure guideline for brain perfusion SPECT using 99mTc-labelled radiopharmaceuticals, version 2. Eur J Nucl Med Mol Imaging. (2009) 36:2093–102. 10.1007/s00259-009-1266-y - DOI - PubMed
    1. Canadian Association of Nuclear Medicine . CANM Guidelines for Brain Perfusion Single Photon Emission Computed Tomography (SPECT). (2021). Available online at: https://canm-acmn.ca/guidelines/ (accessed July 14, 2021).
    1. Mazziotta JC, Collins RC., William H., Oldendorf MD. (1925-1992). J Comput Assist Tomogr. (1993) 17:169–71. 10.1097/00004728-199303000-00001 - DOI - PubMed
    1. van Dellen JR, Danziger A. Failure of computerized tomography to differentiate between radiation necrosis and cerebral tumour. S Afr Med J. (1978) 53:171–2. - PubMed