. 2022 Apr 1;36(7-8):433-450.
doi: 10.1101/gad.349438.122. Epub 2022 Apr 21.

HMCES protects immunoglobulin genes specifically from deletions during somatic hypermutation

Affiliations

HMCES protects immunoglobulin genes specifically from deletions during somatic hypermutation

Lizhen Wu et al. Genes Dev. .

Abstract

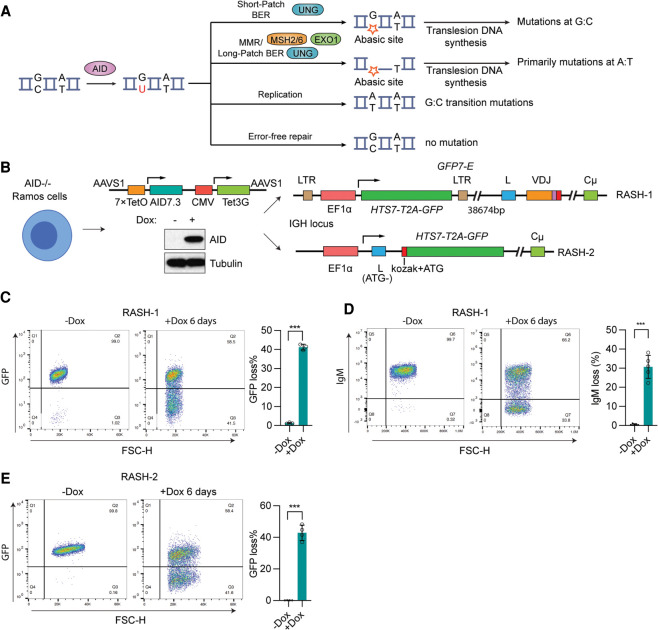
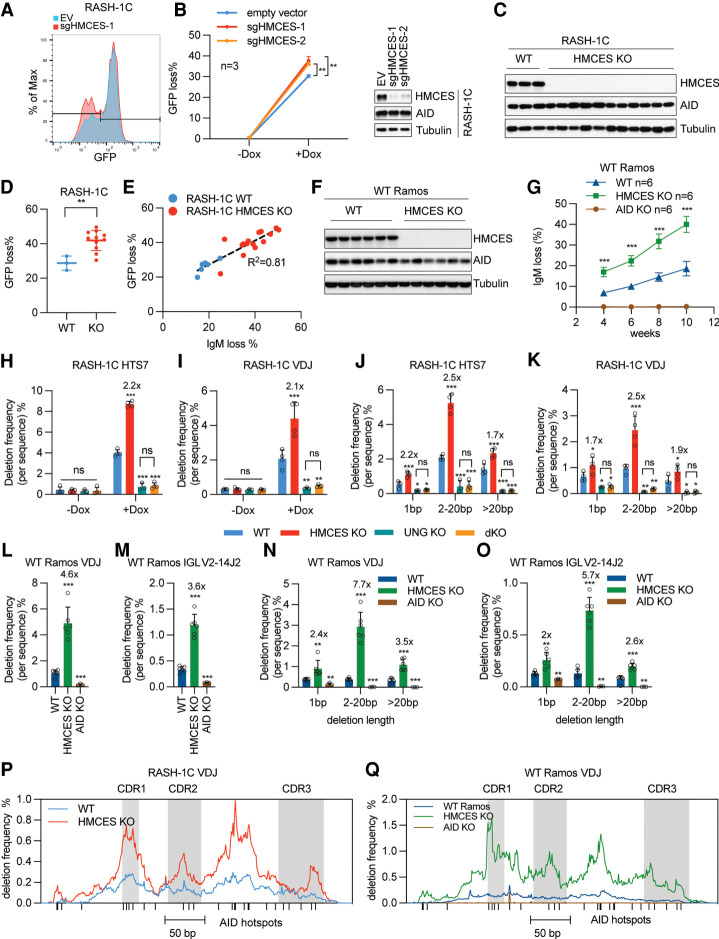
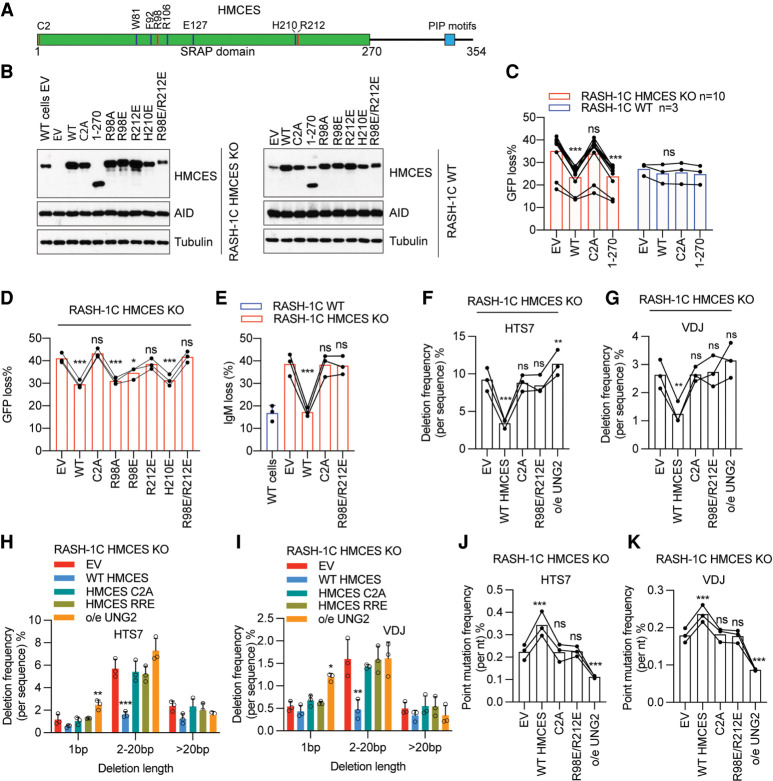
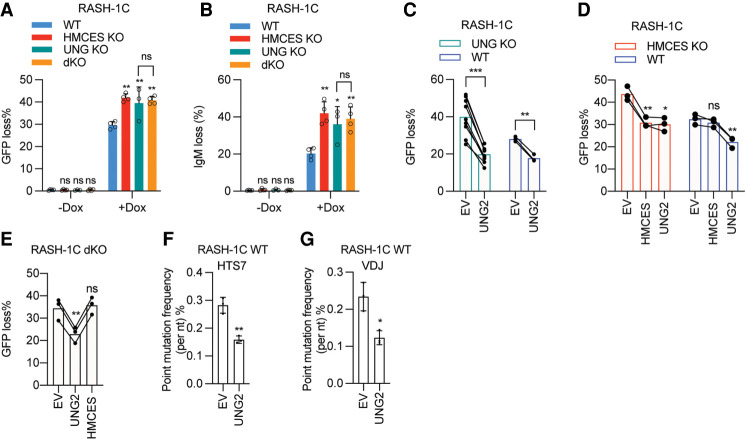
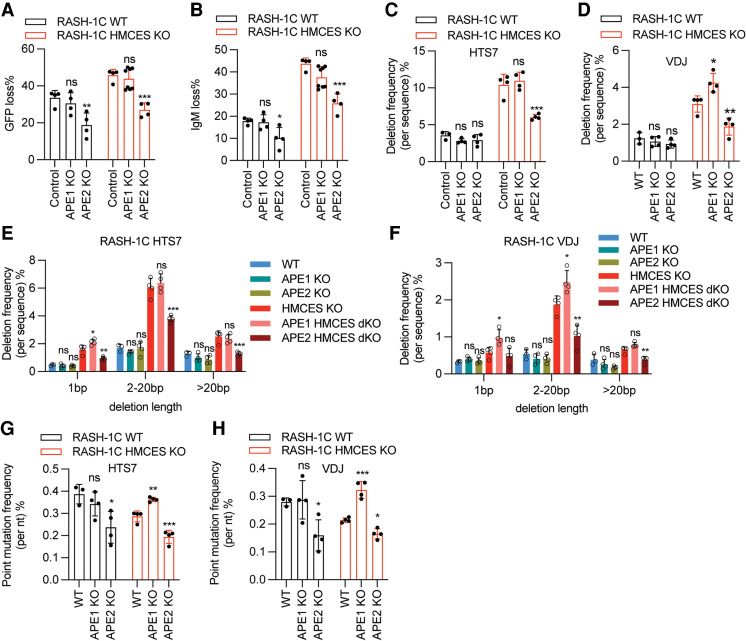
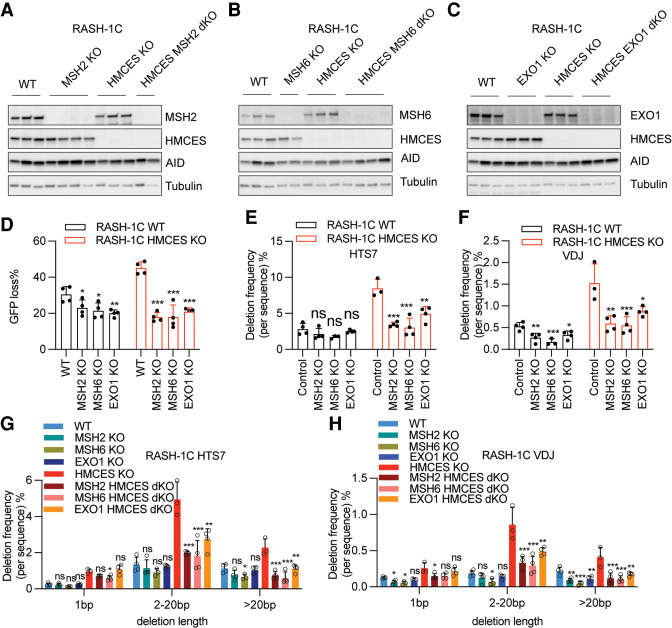
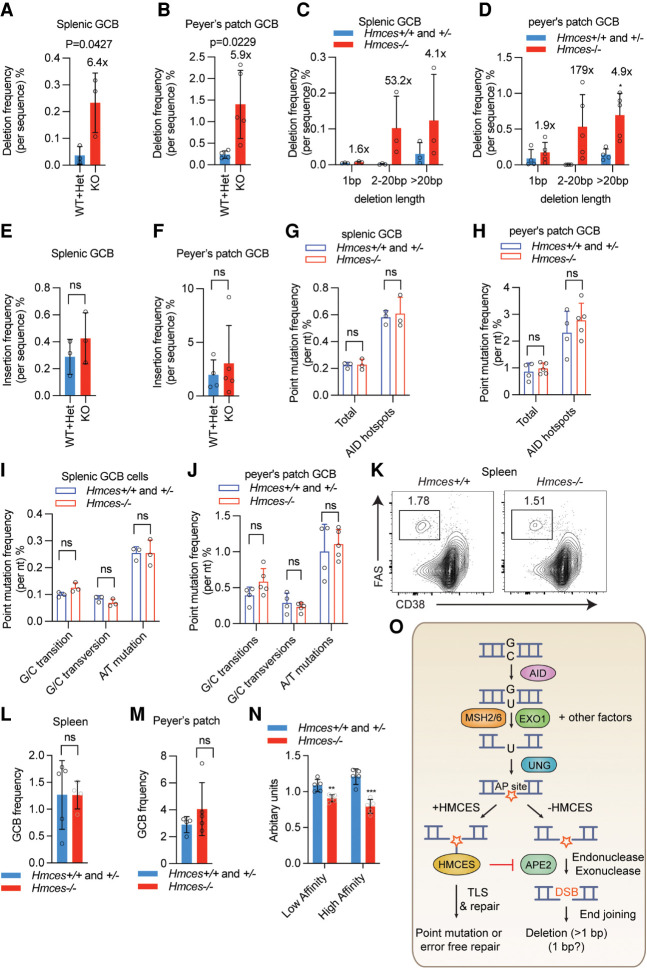
Somatic hypermutation (SHM) produces point mutations in immunoglobulin (Ig) genes in B cells when uracils created by the activation-induced deaminase are processed in a mutagenic manner by enzymes of the base excision repair (BER) and mismatch repair (MMR) pathways. Such uracil processing creates DNA strand breaks and is susceptible to the generation of deleterious deletions. Here, we demonstrate that the DNA repair factor HMCES strongly suppresses deletions without significantly affecting other parameters of SHM in mouse and human B cells, thereby facilitating the production of antigen-specific antibodies. The deletion-prone repair pathway suppressed by HMCES operates downstream from the uracil glycosylase UNG and is mediated by the combined action of BER factor APE2 and MMR factors MSH2, MSH6, and EXO1. HMCES's ability to shield against deletions during SHM requires its capacity to form covalent cross-links with abasic sites, in sharp contrast to its DNA end-joining role in class switch recombination but analogous to its genome-stabilizing role during DNA replication. Our findings lead to a novel model for the protection of Ig gene integrity during SHM in which abasic site cross-linking by HMCES intercedes at a critical juncture during processing of vulnerable gapped DNA intermediates by BER and MMR enzymes.

Keywords: AID; HMCES; antibody affinity maturation; base excision repair; mismatch repair; somatic hypermutation.


Figures

Figure 1.
Figure 1.
Establishing a rapid assay for SHM. (A) Schematic of SHM reaction. During SHM, AID deaminates C to generate uracil, which can act as a template for replication, leading to a C:G-to-T:A transition mutation. Alternatively, noncanonical (error-prone) base excision repair (BER) initiated by UNG can create an abasic site that, if copied by a translesion DNA polymerase, yields mutations at G:C. Finally, U or U:G mismatches can trigger the generation of ssDNA gaps through the action of UNG and mismatch repair (MMR) factors MSH2, MSH6, and EXO1, which primarily yield mutations at A:T upon translesion polymerase synthesis. (B) Scheme for creating RASH-1 and RASH-2. Creation of RASH involved several steps of CRISPR/Cas9 gene targeting in Ramos. AICDA (encoding AID) was disrupted, and a construct was inserted into the AAVS1 safe harbor locus that expresses AID7.3 (AID hyperactive mutant with threefold increased catalytic activity) upon doxycycline (dox)-induced binding of Tet3G to a promoter containing seven copies of its binding site, TetO (7xTetO). Western blot showing AID protein levels in AID7.3in cells without or with 200 ng/mL dox for 24 h. The GFP7-E reporter with EF1α promoter driving transcription of HTS7 (enriched with AID hotspots)-T2A-GFP was integrated into IGH either 38,674 bp upstream of the V leader sequence (RASH-1) or by replacing IGH-VDJ coding sequences so as to retain the leader exon (which now lacks its ATG start codon; RASH-2). Kozak sequence was added to HTS7-T2A-GFP in RASH-2. (C,D) Representative flow cytometry plots of and bar graphs quantifying GFP loss (C) or IgM loss (D) in RASH-1 cells treated with dox for 6 d. (E) Representative flow cytometry plots of and bar graph quantifying GFP loss in RASH-2 treated with dox for 6 d. Throughout the figure, data are presented with the bars representing mean and the error bars as ±SD. Statistical significance was calculated using two-tailed Student's t-test. (***) P value < 0.001.
Figure 2.
Figure 2.
HMCES deficiency leads to increased deletions in SHM target regions. (A) Representative flow cytometry histogram plot of and graph quantitating GFP loss in RASH-1C cells treated with empty vector or a HMCES sgRNA without or with 4-d dox treatment. (B) Western blot showing HMCES protein levels in RASH-1C cells treated with two different HMCES sgRNAs. (C) Western blot showing HMCES protein levels in 11 independent HMCES KO RASH-1C cell clones. (D) Dot plot of GFP loss in cells shown in C treated with dox for 4 d. (E) Scatter plot of GFP loss versus IgM loss from WT and HMCES KO RASH-1C cell clones treated with dox for 4 d. (F) Western blot showing HMCES protein levels in six independent HMCES KO Ramos cell clones. (G) IgM loss from WT, HMCES KO, or AID KO Ramos cell clones at different time points of culture. (H,I) Deletion frequency in the HTS7 (H) and VDJ (I) regions from WT, HMCES KO, UNG KO, and HMCES/UNG dKO RASH-1C cells with dox for 4 d. Deletion frequency was calculated as (number of deletions/number of sequences) × 100; fold changes compared with WT are marked above the bar. (J,K) Distribution of deletion lengths in HTS7 (J) and VDJ (K) regions from WT, HMCES KO, UNG KO, and HMCES/UNG dKO RASH-1C cells treated with dox for 4 d. Deletions were divided into three groups based on length as indicated and the percentage of sequences with indicated deletion length are shown. Fold changes compared with WT are marked above the bar. (L,M) Deletion frequency in the IGH VDJ (L) and IGL VJ (M) regions from WT, HMCES KO, and AID KO Ramos cells. Single cells were seeded and grown for 6 wk and then harvested for analysis. Fold changes compared with WT are marked above the bar. (N,O) Distribution of deletion lengths in the IGH VDJ (N) and IGL VJ (O) regions from WT, HMCES KO, and AID KO Ramos cells. Deletions were divided into three groups based on length as indicated and the percentage of sequences with the indicated deletion length are shown. Fold changes compared with WT are marked above the bar. (P) Deletion profile in the VDJ region from WT and HMCES KO RASH-1C cells treated with dox for 4 d. AID hotspots are indicated with a vertical line at the X-axis. The CDR1, CDR2, and CDR3 regions are shaded. (Q) Deletion profile in the VDJ region from WT, HMCES KO, and AID KO Ramos cells. AID hotspots are indicated with a vertical line at the X-axis. The CDR1, CDR2, and CDR3 regions are shaded. Throughout the figure, data are presented with the bars representing mean and the error bars as ±SD. Statistical significance was calculated using two-tailed Student's t-test for A and D and using one way ANOVA with Dunnett's post-test for GO. (***) P-value < 0.001, (**) P-value < 0.01, (*) P-value < 0.05, (ns) not significant.
Figure 3.
Figure 3.
The function of HMCES in SHM is dependent on abasic site cross-linking and ssDNA binding residues. (A) Schematic of human HMCES protein. (B) Western blot of HMCES and AID in WT or HMCES KO RASH-1C cells reconstituted with WT HMCES or its mutants and induced with dox for 4 d. (C,D) WT HMCES or the indicated HMCES mutants were expressed in RASH-1C cells in which HMCES was knocked out (RASH-1C HMCES KO) or intact (RASH-1C WT). Cells induced with dox for 4 d were assayed for GFP loss. (E) WT HMCES or the indicated HMCES mutants were expressed in HMCES KO RASH-1C cells. Cells induced with dox for 4 d were assayed for IgM loss. (F,G) Deletion frequencies in HTS7 (F) and VDJ (G) from HMCES KO RASH-1C cells reconstituted with WT HMCES or its mutants or overexpressing UNG2, as indicated. (H,I) Distribution of deletion lengths in the HTS7 (H) and VDJ (I) regions from HMCES KO RASH-1C cells reconstituted with WT HMCES or its mutants or overexpressing UNG2. (J,K) Point mutation frequencies in the HTS7 (J) and VDJ (K) regions from HMCES KO RASH-1C cells reconstituted with WT HMCES or its mutants or overexpressing UNG2. Throughout the figure, data are presented with the bars representing mean and the error bars as ±SD. Statistical significance was calculated using one-way ANOVA with Dunnett's post-test. (***) P-value < 0.001, (**) P-value < 0.01, (*) P-value < 0.05, (ns) not significant.
Figure 4.
Figure 4.
The function of HMCES in SHM is dependent on the activity of UNG. (A,B) WT, HMCES KO, UNG KO, and HMCES/UNG dKO (double-KO) RASH-1C cells with dox for 4 d were assayed for GFP loss (A) and IgM loss (B). (C) UNG KO or WT RASH-1C cells overexpressing UNG2 induced with dox for 4 d were assayed for GFP loss. (D) HMCES or UNG2 was overexpressed in WT or HMCES KO RASH-1C cells. Cells induced with dox for 4 d were assayed for GFP loss. (E) HMCES and UNG dKO RASH-1C cells overexpressing UNG2 or HMCES induced with dox for 4 d were assayed for GFP loss. (F,G) Point mutation frequencies in the HTS7 (F) and VDJ (G) regions from WT RASH-1C cells overexpressing UNG2. Throughout the figure, data are presented with the bars representing mean and the error bars as ±SD. Statistical significance was calculated using one-way ANOVA with Dunnett's post-test for A, B, D, and E and using two-tailed Student's t-test for C, F, and G. (***) P-value < 0.001, (**) P-value < 0.01, (*) P-value < 0.05, (ns) not significant.
Figure 5.
Figure 5.
APE2 contributes to deletions that arise in the absence of HMCES. (A,B) APE1 or APE2 were knocked out in WT or HMCES KO RASH-1C cells, and cells were assayed for GFP loss (A) or IgM loss (B) after being induced with dox for 4 d. (C,D) Deletion frequencies in the HTS7 (C) and VDJ (D) regions from WT and HMCES KO RASH-1C cells with either APE1 or APE2 knocked out. (E,F) Distribution of deletion lengths in the HTS7 (E) and VDJ (F) regions from WT and HMCES KO RASH-1C cells with either APE1 or APE2 knocked out. (G,H) Point mutation frequencies in the HTS7 (G) and VDJ (H) regions from WT and HMCES KO RASH-1C cells with either APE1 or APE2 knocked out. Throughout the figure, data are presented with the bars representing mean and the error bars as ±SD. Statistical significance was calculated using one-way ANOVA with Dunnett's post-test. (***) P-value < 0.001, (**) P-value < 0.01, (*) P-value < 0.05, (ns) not significant.
Figure 6.
Figure 6.
Mismatch repair factors contribute to deletions caused by HMCES deficiency. (AC) MSH2, MSH6, or EXO1 was knocked out in WT or HMCES KO RASH-1C cells. Western blots of MSH2 (A), MSH6 (B), and EXO1(C) in WT or HMCES KO RASH-1C cells. (D) MSH2, MSH6, or EXO1 was knocked out in WT or HMCES KO RASH-1C cells, and cells induced with dox for 4 d were assayed for GFP loss. (E,F) Deletion frequencies in the HTS7 (E) and VDJ (F) regions from WT and HMCES KO RASH-1C cells with MSH2, MSH6, or EXO1 knocked out. (G,H) Distribution of deletion lengths in the HTS7 (G) and VDJ (H) regions from WT or HMCES KO RASH-1C cells with MSH2, MSH6, or EXO1 knocked out. Throughout the figure, data are presented with the bars representing mean and the error bars as ±SD. Statistical significance was calculated using one-way ANOVA with Dunnett's post-test. (***) P-value < 0.001, (**) P-value < 0.01, (*) P-value < 0.05, (ns) not significant.
Figure 7.
Figure 7.
HMCES deficiency leads to increased deletions in mouse germinal center B cells. (A,B) Deletion frequencies in the region downstream from the Igh J4 gene segment (JH4 intron) in germinal center B (GCB) cells from either the spleen (A) or Peyer's patch (B) of Hmces−/− and control Hmces+/− and Hmces+/+ mice. (C,D) Distribution of deletion lengths in the JH4 intron in splenic (C) and Peyer's patch GCB (D) cells from Hmces−/− and control Hmces+/+ and Hmces+/− mice. (E,F) Insertion frequencies in the JH4 intron in splenic (E) and Peyer's patch GCB (F) cells from Hmces−/− and control Hmces+/+ and Hmces+/− mice. (G,H) Point mutation frequencies in the JH4 intron in splenic (G) and Peyer's patch GCB (H) cells from Hmces−/− and control Hmces+/+ and Hmces+/− mice. (I,J) Mutation frequencies for G/C transitions, G/C transversions, and A/T mutations in the JH4 intron in splenic (I) or Peyer's patch GCB (J) cells from Hmces−/− and control Hmces+/+ and Hmces+/− mice. (K) Flow cytometry plots of GCB cells gated as the FAS+ CD38 population among total B cells in spleens of Hmces+/+ and Hmces−/− mice 14 d after immunization with NP-CGG. (L,M) Bar graphs showing the frequencies of GCB cells in Hmces+/+ or Hmces+/− and Hmces−/− mice in spleens (L) or Peyer's patches (M). (N) Bar graphs quantifying the levels of low- and high-affinity IgM antibodies measured by ELISA in the sera of Hmces−/− and control Hmces+/+ and Hmces+/− mice. NP-BSA with a conjugation ratio of 27 and 2 was used to detect low-and high-affinity antibodies, respectively. (O) Working model for the mechanism by which HMCES suppresses deletions during SHM. After AID acts, MSH2/6, EXO1, and likely other factors can resect one strand to expose a region of ssDNA containing a U residue, on which UNG can act to create an abasic site (AP site). Cleavage of this vulnerable intermediate by APE2 would result in a DNA double-strand break (DSB), which would be prone to end resection by exonucleases (including APE2 itself) and to generating a deletion. HMCES protects against this outcome by forming a covalent cross-link with the abasic site, thereby blocking cleavage by APE2. The events that occur subsequent to HMCES cross-linking are not known but could involve translesion synthesis (TLS) by an error-prone polymerase. The pathway depicted here is just one of the pathways depicted in Figure 1A (the second from the top). Throughout the figure, data are presented with the bars representing mean and the error bars as ±SD. Statistical significance was calculated using two-tailed Student's t-test. (***) |P-value < 0.001, (**) P-value < 0.01, (ns) not significant.

References

    1. Alt FW, Zhang Y, Meng FL, Guo C, Schwer B. 2013. Mechanisms of programmed DNA lesions and genomic instability in the immune system. Cell 152: 417–429. 10.1016/j.cell.2013.01.007 - DOI - PMC - PubMed
    1. Aravind L, Anand S, Iyer LM. 2013. Novel autoproteolytic and DNA-damage sensing components in the bacterial SOS response and oxidized methylcytosine-induced eukaryotic DNA demethylation systems. Biol Direct 8: 20. 10.1186/1745-6150-8-20 - DOI - PMC - PubMed
    1. Bardwell PD, Woo CJ, Wei K, Li Z, Martin A, Sack SZ, Parris T, Edelmann W, Scharff MD. 2004. Altered somatic hypermutation and reduced class-switch recombination in exonuclease 1-mutant mice. Nat Immunol 5: 224–229. 10.1038/ni1031 - DOI - PubMed
    1. Boboila C, Yan C, Wesemann DR, Jankovic M, Wang JH, Manis J, Nussenzweig A, Nussenzweig M, Alt FW. 2010. Alternative end-joining catalyzes class switch recombination in the absence of both Ku70 and DNA ligase 4. J Exp Med 207: 417–427. 10.1084/jem.20092449 - DOI - PMC - PubMed
    1. Boehm EM, Washington MT. 2016. R.I.P. to the PIP:PCNA-binding motif no longer considered specific: PIP motifs and other related sequences are not distinct entities and can bind multiple proteins involved in genome maintenance. Bioessays 38: 1117–1122. 10.1002/bies.201600116 - DOI - PMC - PubMed

Publication types