

Human UPF3A and UPF3B enable fault-tolerant activation of nonsense-mediated mRNA decay
- PMID: 35451084
- PMCID: PMC9108619
- DOI: 10.15252/embj.2021109191
Human UPF3A and UPF3B enable fault-tolerant activation of nonsense-mediated mRNA decay
Abstract
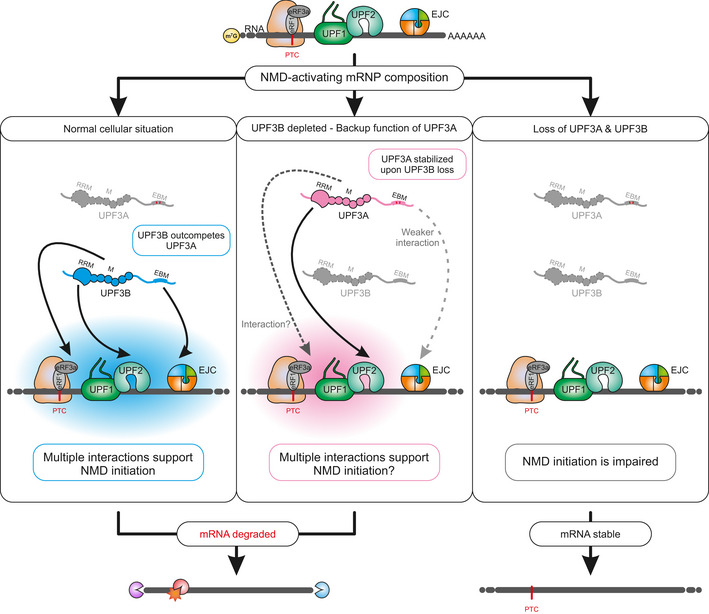
The paralogous human proteins UPF3A and UPF3B are involved in recognizing mRNAs targeted by nonsense-mediated mRNA decay (NMD). UPF3B has been demonstrated to support NMD, presumably by bridging an exon junction complex (EJC) to the NMD factor UPF2. The role of UPF3A has been described either as a weak NMD activator or an NMD inhibitor. Here, we present a comprehensive functional analysis of UPF3A and UPF3B in human cells using combinatory experimental approaches. Overexpression or knockout of UPF3A as well as knockout of UPF3B did not substantially change global NMD activity. In contrast, the co-depletion of UPF3A and UPF3B resulted in a marked NMD inhibition and a transcriptome-wide upregulation of NMD substrates, demonstrating a functional redundancy between both NMD factors. In rescue experiments, UPF2 or EJC binding-deficient UPF3B largely retained NMD activity. However, combinations of different mutants, including deletion of the middle domain, showed additive or synergistic effects and therefore failed to maintain NMD. Collectively, UPF3A and UPF3B emerge as fault-tolerant, functionally redundant NMD activators in human cells.
Keywords: UPF3; gene paralogs; mRNA turnover; nonsense-mediated mRNA decay.
© 2022 The Authors. Published under the terms of the CC BY 4.0 license.
Figures
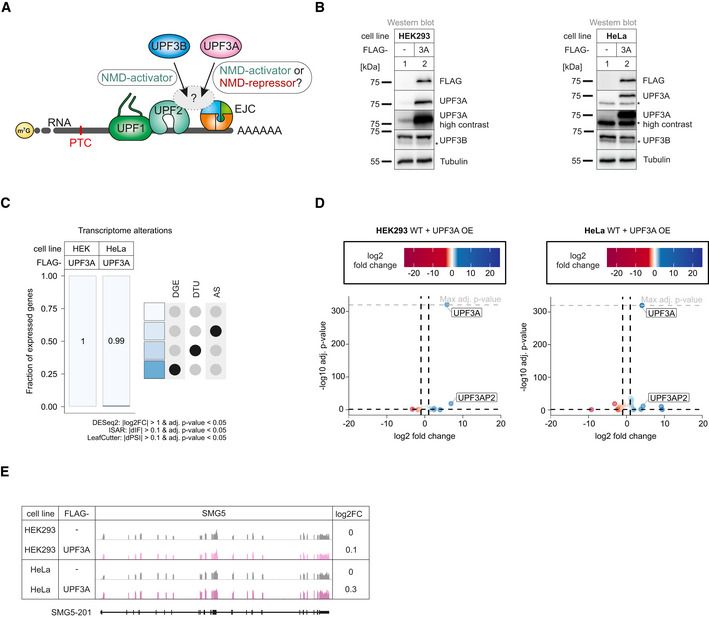
Schematic representation of the bridge between UPF1 and the EJC during NMD. Binding of UPF3A instead of the stronger bound UPF3B is discussed to either activate or repress NMD.
Western blot analyses after induced expression of FLAG‐tagged UPF3A in WT HEK293 and HeLa cells (n = 1). Tubulin serves as control. The asterisk indicates unspecific bands.
Fraction of expressed genes (genes with non‐zero counts in DESeq2) were calculated which exhibit individual or combinations of differential gene expression (DGE), differential transcript usage (DTU), and/or alternative splicing (AS) events in HEK293 and HeLa WT cells overexpressing UPF3A using the respective computational analysis (cutoffs are indicated). AS and DTU events were collapsed on the gene level. For DGE, P‐values were calculated by DESeq2 using a two‐sided Wald test and corrected for multiple testing using the Benjamini–Hochberg method. For DTU, P‐values were calculated by IsoformSwitchAnalyzeR (ISAR) using a DEXSeq‐based test and corrected for multiple testing using the Benjamini–Hochberg method. For AS, P‐values were calculated by LeafCutter using an asymptotic chi‐squared distribution and corrected for multiple testing using the Benjamini–Hochberg method.
Volcano plot showing the differential gene expression analyses from the RNA‐Seq dataset of HEK293 and HeLa WT cells overexpressing UPF3A. The log2 fold change is plotted against the ‐log10 adjusted P‐value (P adj). P‐values were calculated by DESeq2 using a two‐sided Wald test and corrected for multiple testing using the Benjamini–Hochberg method. OE = overexpression.
Read coverage of SMG5 from WT HEK293 and HeLa RNA‐seq data with or without induced UPF3A overexpression shown as Integrative Genomics Viewer (IGV) snapshot. Differential gene expression (from DESeq2) is indicated as log2 fold change (log2FC) on the right. Schematic representation of the protein coding transcript below.
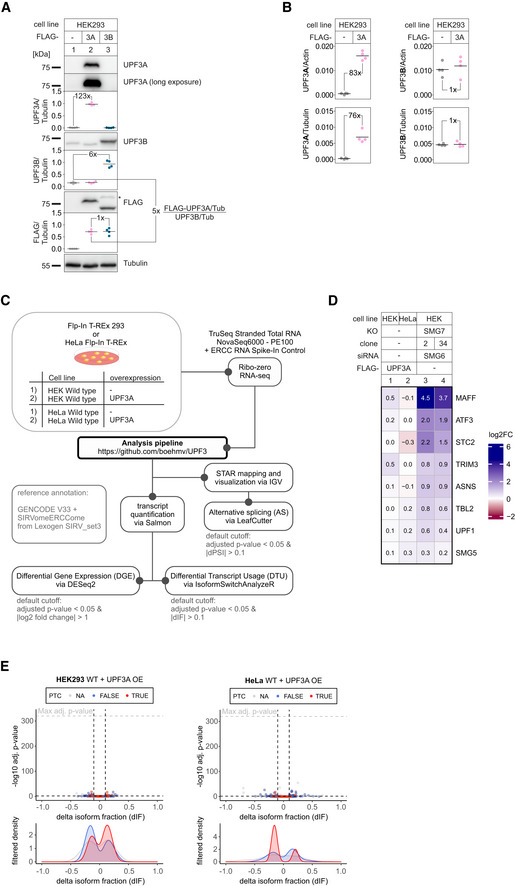
Western blot analysis of unaltered HEK293 WT cells or with induced FLAG‐UPF3A or FLAG‐UPF3B expression. UPF3A, UPF3B, and FLAG levels were detected. Tubulin serves as control. Protein levels were quantified, normalized to tubulin expression, and shown as datapoints and mean (n = 4). Fold‐changes of relevant conditions are shown.
Skyline analysis of WT and UPF3A‐overexpressing cells after whole proteome mass spec analysis. Quantifier intensities of UPF3A (left) and UPF3B (right) were normalized to actin (top) and tubulin (bottom) which were used as “loading controls”. Results are shown as datapoints and mean (n = 4). The means were used to calculate the respective fold‐changes.
Schematic overview of the analysis pipeline.
Heatmap of mean log2 fold changes (log2FC) of previously reported UPF3A‐responsive NMD targets (Fig 3C of Shum et al, 2016) as determined by DESeq2 using the indicated RNA‐Seq data. The data from SMG7 KO with SMG6 KD (Data ref: Boehm et al, 2021) serve as positive control for NMD inhibition.
Volcano plot showing the differential transcript usage (via IsoformSwitchAnalyzeR) in RNA‐Seq data of HEK293 and HeLa WT cells overexpressing UPF3A. Isoforms containing GENCODE (release 33) annotated PTC (red, TRUE), regular stop codons (blue, FALSE) or having no annotated open reading frame (gray, NA) are indicated. The change in isoform fraction (dIF) is plotted against the ‐log10 adjusted P‐value (P adj). Density plots show the distribution of filtered isoforms in respect to the dIF, cutoffs were |dIF| > 0.1 and P adj < 0.05. P‐values were calculated by IsoformSwitchAnalyzeR using a DEXSeq‐based test and corrected for multiple testing using the Benjamini–Hochberg method. OE = overexpression.
- A
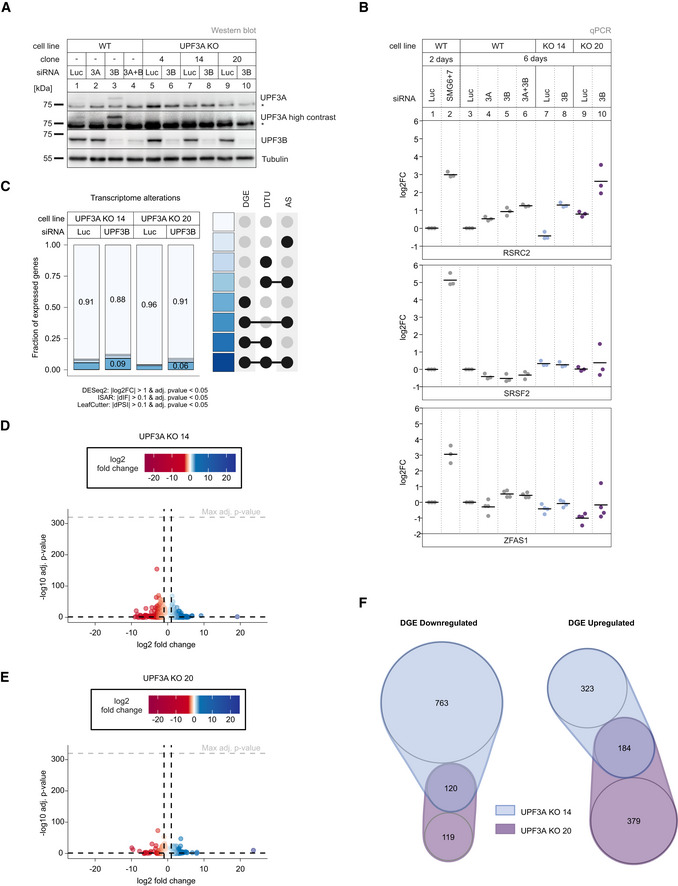
Western blot analysis of WT and UPF3A KO cells (clones 4, 14, and 20) with the indicated siRNA treatments (n = 1). UPF3A and UPF3B protein levels were detected, Tubulin serves as control. The asterisk indicates unspecific bands.
- B
Quantitative RT–PCR of the indicated cell lines treated with the indicated siRNAs for 2 or 6 days. For RSRC2 and SRSF2 the ratio of NMD isoform to canonical isoform was calculated. ZFAS1 expression was normalized to C1orf43 reference. Data points and means are plotted as log2 fold change (log2FC) (n = 3 for RSRC2 and SRSF2, n = 4 for ZFAS1).
- C
Fraction of expressed genes (genes with non‐zero counts in DESeq2) were calculated which exhibit individual or combinations of differential gene expression (DGE), differential transcript usage (DTU) and/or alternative splicing (AS) events in the indicated conditions using the respective computational analysis (cutoffs are indicated). AS and DTU events were collapsed on the gene level. For DGE, P‐values were calculated by DESeq2 using a two‐sided Wald test and corrected for multiple testing using the Benjamini–Hochberg method. For DTU, P‐values were calculated by IsoformSwitchAnalyzeR using a DEXSeq‐based test and corrected for multiple testing using the Benjamini–Hochberg method. For AS, P‐values were calculated by LeafCutter using an asymptotic chi‐squared distribution and corrected for multiple testing using the Benjamini–Hochberg method.
- D, E
Volcano plots showing the differential gene expression analyses from the indicated RNA‐Seq datasets (D UPF3A KO clone 14, E UPF3A KO clone 20). The log2 fold change is plotted against the −log10 adjusted P‐value (P adj). P‐values were calculated by DESeq2 using a two‐sided Wald test and corrected for multiple testing using the Benjamini–Hochberg method.
- F
nVenn Diagram showing the overlap of up‐ or downregulated genes in the UPF3A KO cell lines 14 and 20. Log2 fold change < 1 (downregulated) or > 1 (upregulated) and adjusted P‐value (P adj) < 0.05. DGE = Differential Gene Expression.
- A
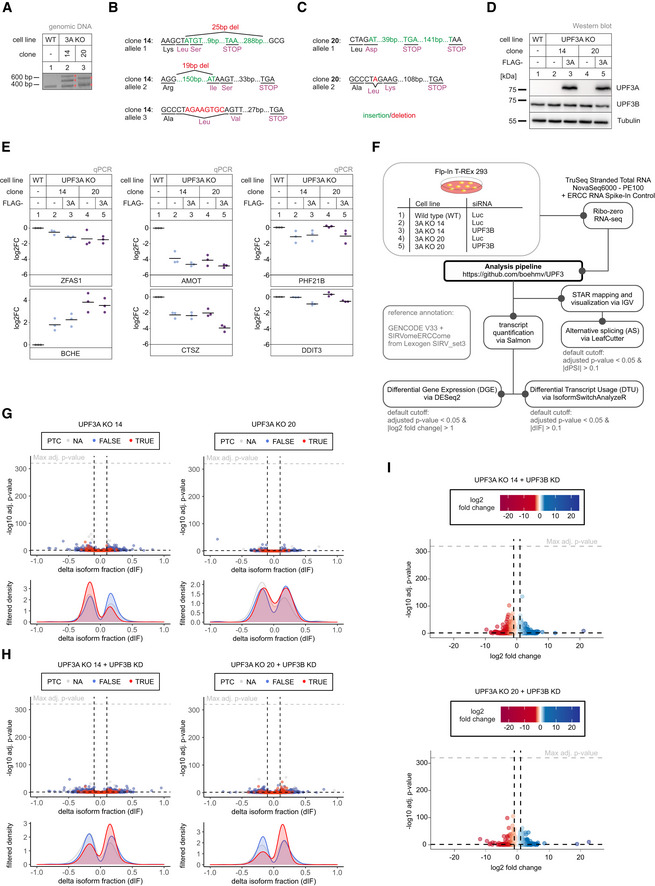
PCR amplification of targeted genomic locus of UPF3A for Sanger sequencing analysis.
- B, C
The targeted exon region and anticipated PTC location following insertions (green) or deletions (red) are indicated for detected alleles of UPF3A in clone 14 (B) and 20 (C).
- D
Western blot analysis of WT and UPF3A KO cells (clones 14 and 20) with or without expression of FLAG‐tagged UPF3A rescue construct. UPF3A and UPF3B protein levels were detected, Tubulin serves as control (n = 1).
- E
Quantitative RT–PCR of the samples from (D). Expression of four targets with significant DGE in both UPF3A KO clones (ZFAS1, BCHE, AMOT, CTSZ) was normalized to C1orf43 reference. For PHF21B and DDIT3, DGE analysis showed significant downregulation in both UPF3A KO clones and upregulation in SMG7 KO + SMG6 KD and UPF3 dKO cells. Expression was normalized to EMC7 reference. Data points and means are plotted as log2 fold change (log2FC) (n = 3).
- F
Schematic overview of the analysis pipeline.
- G, H
Volcano plots showing the differential transcript usage (via IsoformSwitchAnalyzeR) in various RNA‐Seq data. Isoforms containing GENCODE (release 33) annotated PTC (red, TRUE), regular stop codons (blue, FALSE) or having no annotated open reading frame (gray, NA) are indicated. The change in isoform fraction (dIF) is plotted against the ‐log10 adjusted P‐value (P adj). Density plots show the distribution of filtered isoforms in respect to the dIF, cutoffs were |dIF| > 0.1 and P adj < 0.05. P‐values were calculated by IsoformSwitchAnalyzeR using a DEXSeq‐based test and corrected for multiple testing using the Benjamini–Hochberg method.
- I
Volcano plots showing the differential gene expression analyses from the indicated RNA‐Seq datasets. The log2 fold change is plotted against the ‐log10 adjusted P‐value (P adj). P‐values were calculated by DESeq2 using a two‐sided Wald test and corrected for multiple testing using the Benjamini–Hochberg method.
- A
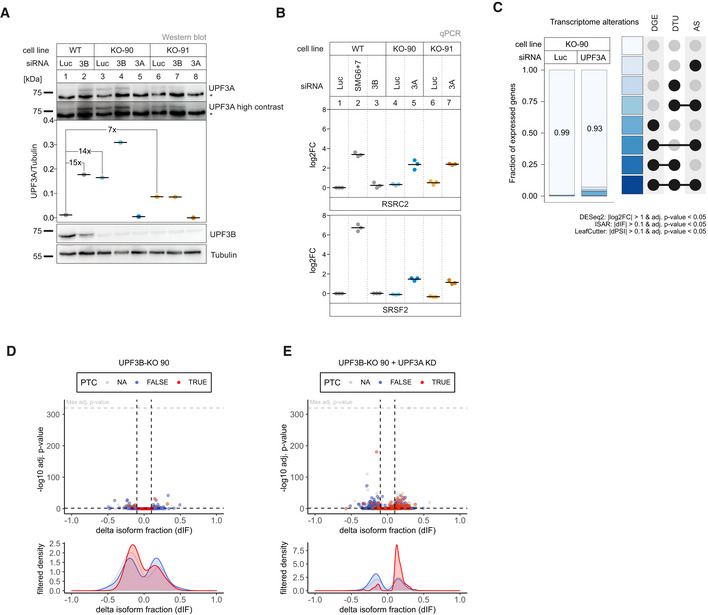
Western blot analysis of WT and UPF3B KO cells (clones 90 and 91) combined with the indicated knockdowns (n = 1). UPF3A and UPF3B (AK‐141) protein levels were detected, Tubulin serves as control. Protein levels of UPF3A were quantified, normalized to tubulin expression, and shown as datapoints and mean. Fold‐changes of relevant conditions are shown. The asterisk indicates unspecific bands.
- B
Quantitative RT–PCR of the indicated cell lines with the indicated knockdowns. For RSRC2 and SRSF2 the ratio of NMD isoform to canonical isoform was calculated. Data points and means are plotted as log2 fold change (log2FC, n = 3).
- C
Fraction of expressed genes (genes with non‐zero counts in DESeq2) were calculated which exhibit individual or combinations of differential gene expression (DGE), differential transcript usage (DTU), and/or alternative splicing (AS) events in the indicated conditions using the respective computational analysis (cutoffs are indicated). AS and DTU events were collapsed on the gene level. For DGE, P‐values were calculated by DESeq2 using a two‐sided Wald test and corrected for multiple testing using the Benjamini–Hochberg method. For DTU, P‐values were calculated by IsoformSwitchAnalyzeR using a DEXSeq‐based test and corrected for multiple testing using the Benjamini–Hochberg method. For AS, P‐values were calculated by LeafCutter using an asymptotic chi‐squared distribution and corrected for multiple testing using the Benjamini–Hochberg method.
- D, E
Volcano plots showing the differential transcript usage (via IsoformSwitchAnalyzeR) in various RNA‐Seq data. Isoforms containing GENCODE (release 33) annotated PTC (red, TRUE), regular stop codons (blue, FALSE) or having no annotated open reading frame (gray, NA) are indicated. The change in isoform fraction (dIF) is plotted against the ‐log10 adjusted P‐value (P adj). Density plots show the distribution of filtered isoforms in respect to the dIF, cutoffs were |dIF| > 0.1 and P adj < 0.05. P‐values were calculated by IsoformSwitchAnalyzeR using a DEXSeq‐based test and corrected for multiple testing using the Benjamini–Hochberg method.
- A, B
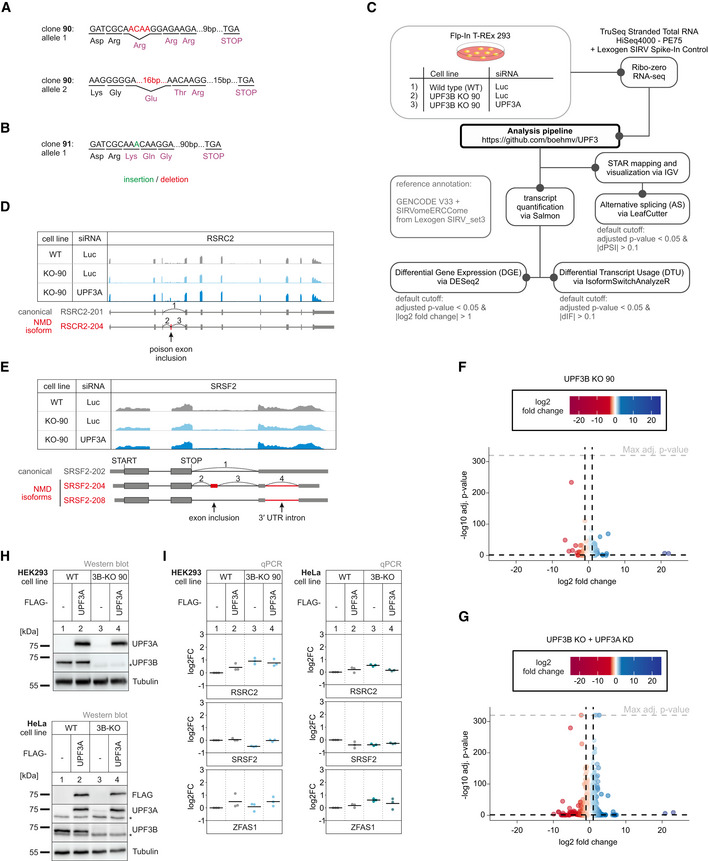
The targeted exon region and anticipated PTC location following insertions (green) or deletions (red) are indicated for detected alleles of UPF3B in KO clone 90 (A) and 91 (B).
- C
Schematic overview of the analysis pipeline.
- D, E
Read coverage of RSRC2 (D) and SRSF2 (E) from the indicated RNA‐seq sample data with or without UPF3A siRNA treatment shown as Integrative Genomics Viewer (IGV) snapshot. The canonical and NMD‐sensitive isoforms are schematically indicated below.
- F, G
Volcano plots showing the differential gene expression analyses from the indicated RNA‐Seq datasets. The log2 fold change is plotted against the ‐log10 adjusted P‐value (P adj). P‐values were calculated by DESeq2 using a two‐sided Wald test and corrected for multiple testing using the Benjamini–Hochberg method.
- H
Western blot analysis of HEK293 and HeLa WT and UPF3B KO cells (clone 90 for HEK293 cells) with or without expression of FLAG‐tagged UPF3A rescue construct (n = 1). UPF3A, UPF3B and FLAG protein levels were detected, Tubulin serves as control. The asterisk indicates unspecific bands.
- I
Quantitative RT–PCR of the HEK293 and HeLa samples from (H). For RSRC2 and SRSF2 the ratio of NMD isoform to canonical isoform was calculated. ZFAS1 expression was normalized to C1orf43 reference. Data points and means are plotted as log2 fold change (log2FC) (n = 3).
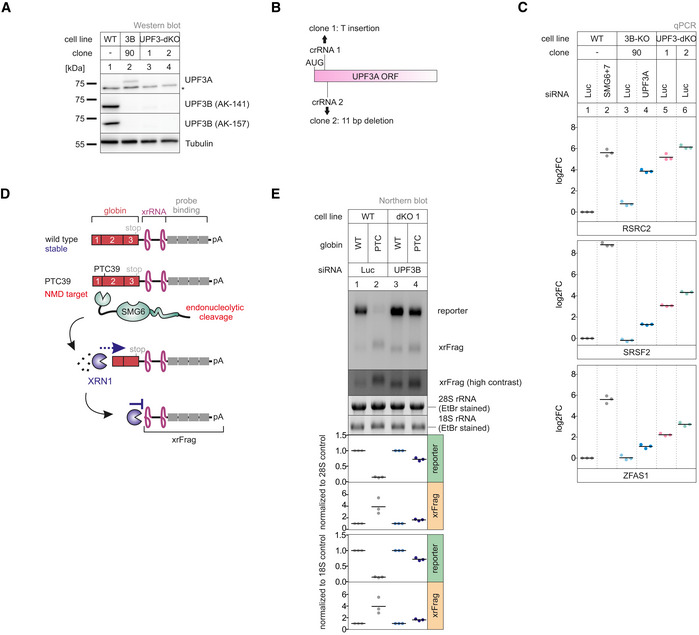
Western blot analysis of WT, UPF3B KO, and UPF3A‐UPF3B double KO cells (clones 1 and 2) (n = 1). UPF3A and UPF3B protein levels were detected, Tubulin serves as control. The asterisk indicates unspecific bands.
Schematic depiction of the insertion/deletion in the UPF3A open reading frame resulting in the additional UPF3A KO in the UPF3B KO clone 90 generating UPF3 dKO clones.
Quantitative RT–PCR of the indicated samples with the indicated KDs. For RSRC2 and SRSF2, the ratio of NMD isoform to canonical isoform was calculated. ZFAS1 expression was normalized to C1orf43 reference. Data points and means are plotted as log2 fold change (log2FC, n = 3).
Schematic overview of the globin reporter constructs and their functional elements.
Northern blot analysis of globin reporter and xrFrag. Ethidium bromide stained 28S and 18S rRNAs are shown as controls. Quantification results are shown as data points and mean (n = 3).
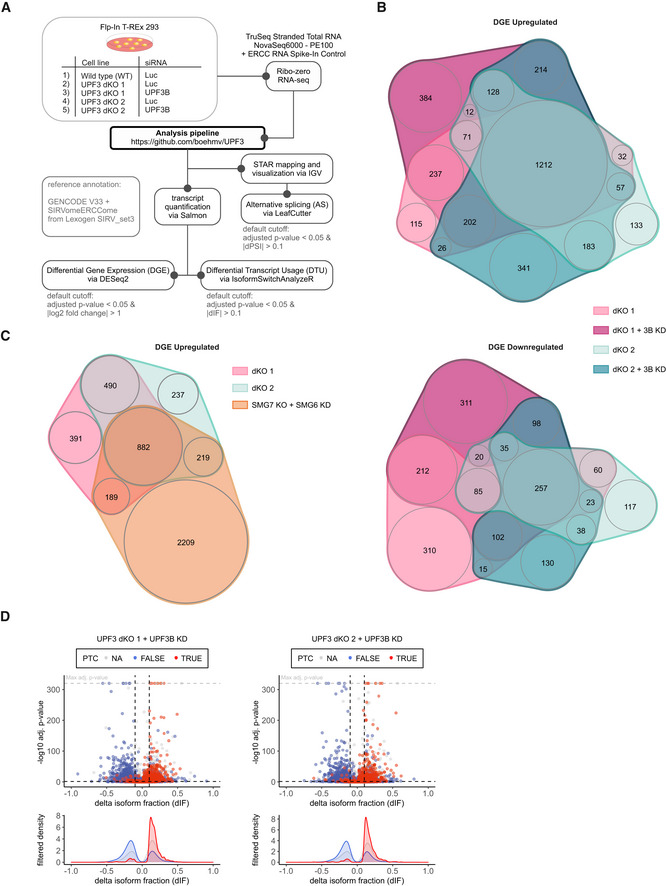
Schematic overview of the analysis pipeline.
nVenn Diagrams showing the overlap of upregulated (upper panel) or downregulated genes (lower panel) in the UPF3 dKO cell lines 1 and 2, both with and without a supportive UPF3B KD. Log2 fold change < −1 (downregulated) or > 1 (upregulated) and adjusted P‐value (P adj) < 0.05. DGE = Differential Gene Expression.
nVenn Diagram showing the overlap of upregulated genes in the two UPF3 dKO clones and previously analyzed SMG7 KO cells with SMG6 KD (Data ref.: Boehm et al, 2021) as control for cells with inhibited NMD. The overlap demonstrates high‐confidence NMD targets. Cut‐offs: log2FoldChange > 1 and adjusted P‐value (P adj) < 0.05. DGE = Differential Gene Expression.
Volcano plots showing the differential transcript usage (via IsoformSwitchAnalyzeR) in various RNA‐Seq data. Isoforms containing GENCODE (release 33) annotated PTC (red, TRUE), regular stop codons (blue, FALSE) or having no annotated open reading frame (gray, NA) are indicated. The change in isoform fraction (dIF) is plotted against the ‐log10 adjusted P‐value (P adj). Density plots show the distribution of filtered isoforms in respect to the dIF, cutoffs were |dIF| > 0.1 and P adj < 0.05. P‐values were calculated by IsoformSwitchAnalyzeR using a DEXSeq‐based test and corrected for multiple testing using the Benjamini–Hochberg method.
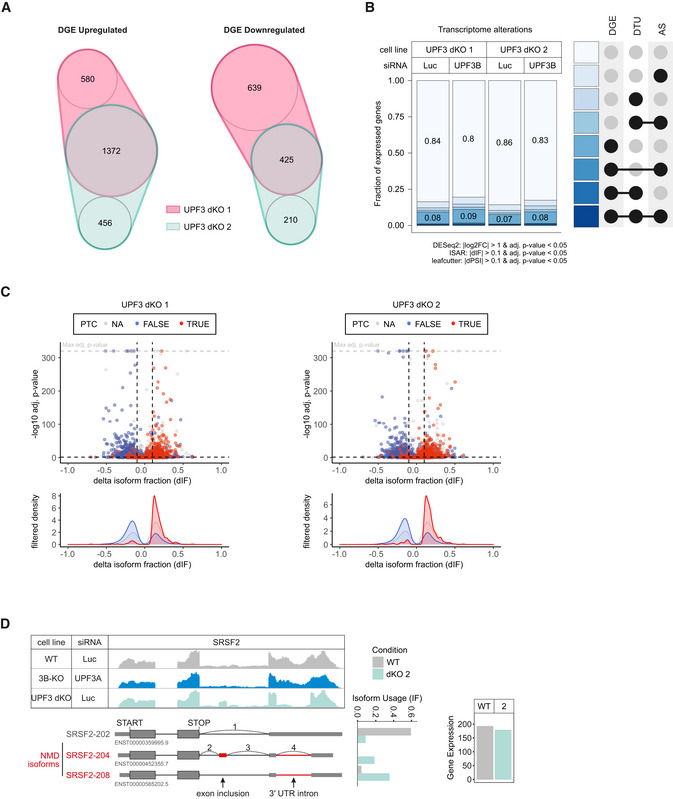
nVenn Diagram showing the overlap of up‐ or downregulated genes in the UPF3 dKO cell lines 1 and 2. Log2 fold change < −1 (downregulated) or > 1 (upregulated) and adjusted P‐value (P adj) < 0.05. DGE = Differential Gene Expression.
Fraction of expressed genes (genes with non‐zero counts in DESeq2) were calculated which exhibit individual or combinations of differential gene expression (DGE), differential transcript usage (DTU), and/or alternative splicing (AS) events in the indicated conditions using the respective computational analysis (cutoffs are indicated). AS and DTU events were collapsed on the gene level. For DGE, P‐values were calculated by DESeq2 using a two‐sided Wald test and corrected for multiple testing using the Benjamini–Hochberg method. For DTU, P‐values were calculated by IsoformSwitchAnalyzeR using a DEXSeq‐based test and corrected for multiple testing using the Benjamini–Hochberg method. For AS, P‐values were calculated by LeafCutter using an asymptotic chi‐squared distribution and corrected for multiple testing using the Benjamini–Hochberg method.
Volcano plots showing the differential transcript usage (via IsoformSwitchAnalyzeR) in various RNA‐Seq data. Isoforms containing GENCODE (release 33) annotated PTC (red, TRUE), regular stop codons (blue, FALSE) or having no annotated open reading frame (gray, NA) are indicated. The change in isoform fraction (dIF) is plotted against the ‐log10 adjusted P‐value (P adj). Density plots show the distribution of filtered isoforms in respect to the dIF, cutoffs were |dIF| > 0.1 and P adj < 0.05. P‐values were calculated by IsoformSwitchAnalyzeR using a DEXSeq‐based test and corrected for multiple testing using the Benjamini–Hochberg method.
Read coverage of SRSF2 from the indicated RNA‐seq sample data with or without UPF3A siRNA treatment shown as Integrative Genomics Viewer (IGV) snapshot. The canonical and NMD‐sensitive isoforms are schematically indicated below. Quantification of gene expression and isoform usage by IsoformSwitchAnalyzeR (right).
- A–C
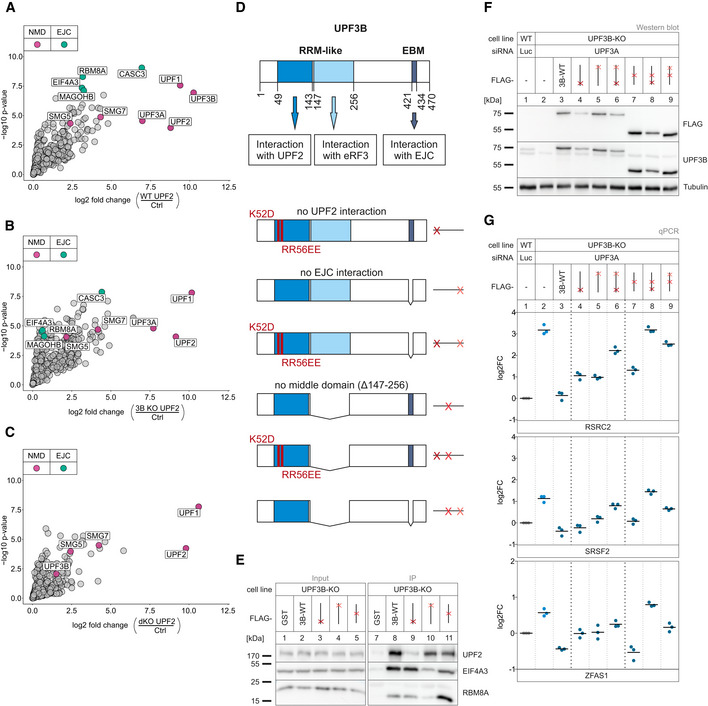
Volcano plots of label free mass spectrometry‐based analysis of the interaction partners of UPF2 in WT cells treated with control siRNAs and the UPF3B KO clone 90 and dKO clone 1 both treated with siRNAs targeting UPF3B (n = 4 biologically independent samples). (A) FLAG‐UPF2 in WT against FLAG‐GST control in WT cells, (B) UPF2 in 3B KO cells against FLAG control in WT cells, (C) UPF2 in dKO cells against FLAG control in WT cells. Points labeled in purple indicate NMD factors; points labeled in turquoise indicate EJC components. Cutoffs: Log2 fold change ≥ 0.
- D
Schematic representation of the UPF3B protein domains and the respective functions. Below are the mutated rescue constructs and their respective abstract placeholders. RRM = RNA recognition motif, EBM = EJC binding motif.
- E
Representative Western blot after FLAG co‐immunoprecipitation (IP) of FLAG‐tagged GST (control) or UPF3B WT and single mutant constructs in UPF3B KO cells (n = 3).
- F
Western blot analysis of WT and UPF3B KO clone 90 with Luciferase and UPF3A KDs respectively. Monitored expression of the FLAG‐tagged UPF3B rescue construct shown in (D). Rescue construct protein levels were detected with anti‐FLAG and anti‐UPF3B (AK‐141) antibodies. Tubulin serves as control (n = 1).
- G
Quantitative RT–PCR of the samples from (F). For RSRC2 and SRSF2, the ratio of NMD isoform to canonical isoform was calculated. ZFAS1 expression was normalized to C1orf43 reference. Data points and means are plotted as log2 fold change (log2FC, n = 3).
- A
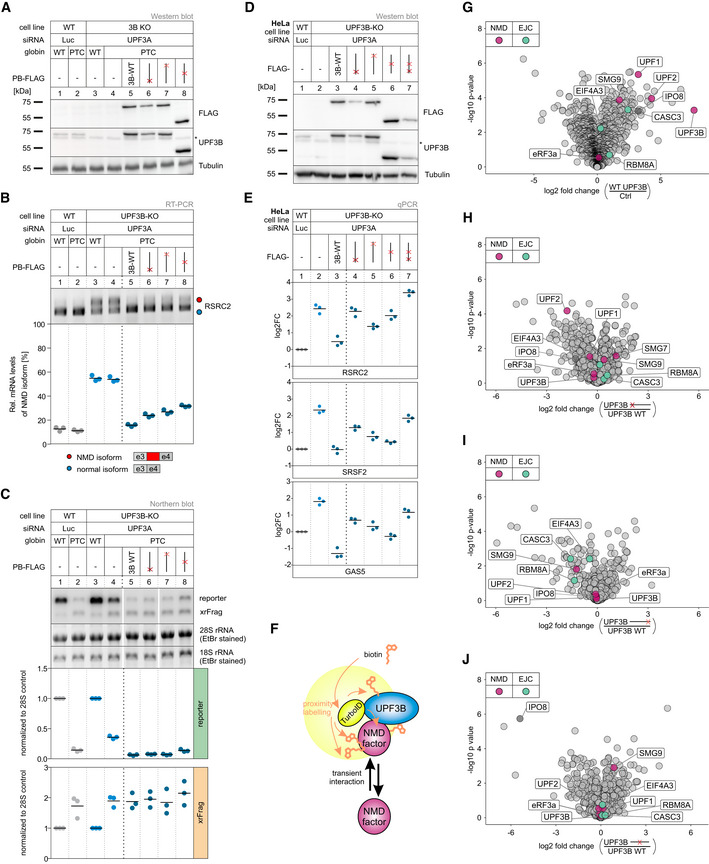
Western blot analysis of WT and UPF3B KO clone 90 cells with Luciferase and UPF3A KD, respectively. Monitored expression of globin WT and PTC39 reporters and the indicated UPF3B rescue constructs. Rescue construct protein levels were detected with anti‐FLAG and anti‐UPF3B (AK‐141) antibodies. Tubulin serves as control (n = 1). The asterisk indicates an unspecific band.
- B
End‐point RT–PCR detection of RSRC2 transcript isoforms in the samples from (A). The detected RSRC2 isoforms are indicated on the bottom, the NMD‐inducing included exon is marked in red (e = exon). Relative mRNA levels of RSRC2 isoforms were quantified from bands of agarose gels (n = 3).
- C
Northern blot analysis of globin reporter and xrFrag. Ethidium bromide stained 28S and 18S rRNAs are shown as controls. Lanes 5 and 6 were mirrored because of a pipetting error. Quantification results are shown as data points and mean (n = 3).
- D
Western blot analysis of HeLa WT and UPF3B KO cells with Luciferase and UPF3A KDs respectively. Monitored expression of the FLAG‐tagged UPF3B rescue construct shown in (Fig 6D). Rescue construct protein levels were detected with anti‐FLAG and anti‐UPF3B (AK‐141) antibodies. Tubulin serves as control (n = 1). The asterisk indicates an unspecific band.
- E
Quantitative RT–PCR of the samples from (D). For RSRC2 and SRSF2, the ratio of NMD isoform to canonical isoform was calculated. GAS5 expression was normalized to EMC7 reference. Data points and means are plotted as log2 fold change (n = 3).
- F
Overview of TurboID‐mediated proximity labeling of UPF3B WT and UPF3B mutant construct binding partners in UPF3B KO clone 90 with additional UPF3A KD. Transient UPF3B interactors are marked with biotin via TurboID catalysis. Biotinylated proteins are subsequently enriched with streptavidin beads.
- G–J
Volcano plots of mass spectrometry‐based analysis of streptavidin‐enriched biotinylated proteins in the respective comparison of conditions. (G) FLAG‐TurboID‐UPF3B against FLAG‐TurboID control, (H) FLAG‐TurboID‐UPF3B ΔUPF2 interaction (K52D/RR56EE) against FLAG‐TurboID‐UPF3B, (I) FLAG‐TurboID‐UPF3B ΔEJC interaction (Δ421–434) against FLAG‐TurboID‐UPF3B, (J) FLAG‐TurboID‐UPF3B Δmiddle domain (Δ147–256) against FLAG‐TurboID‐UPF3B, all in UPF3B KO + UPF3A KD cells. Points labeled in purple indicate NMD factors; points labeled in turquoise indicate EJC components (n = 3 biologically independent samples).
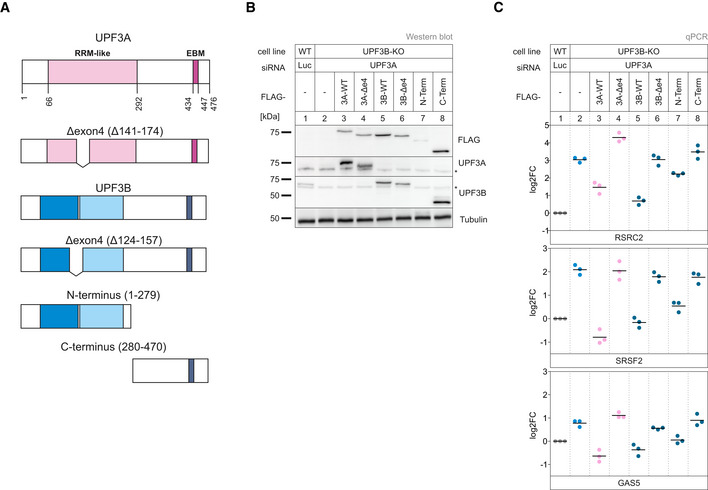
Schematic representation of the UPF3A and UPF3B protein domains. Below are the respective mutated rescue constructs.
Western blot analysis of WT and UPF3B KO clone 90 with Luciferase and UPF3A KDs respectively. Monitored expression of the FLAG‐tagged UPF3A and UPF3B rescue construct shown in (A). Rescue construct protein levels were detected with anti‐FLAG, anti‐UPF3A, and anti‐UPF3B (AK‐141) antibodies. Tubulin serves as control (n = 1). The asterisk indicates unspecific bands.
Quantitative RT–PCR of the samples from (B). For RSRC2 and SRSF2, the ratio of NMD isoform to canonical isoform was calculated. Data points and means are plotted as log2 fold change (log2FC) (n = 3).
References
-
- Amrani N, Ganesan R, Kervestin S, Mangus DA, Ghosh S, Jacobson A (2004) A faux 3'‐UTR promotes aberrant termination and triggers nonsense‐mediated mRNA decay. Nature 432: 112–118 - PubMed
Publication types
MeSH terms
Substances
LinkOut - more resources
Full Text Sources
Molecular Biology Databases
Research Materials
