

TFAM loss induces nuclear actin assembly upon mDia2 malonylation to promote liver cancer metastasis
- PMID: 35451091
- PMCID: PMC9156967
- DOI: 10.15252/embj.2021110324
TFAM loss induces nuclear actin assembly upon mDia2 malonylation to promote liver cancer metastasis
Abstract
The mechanisms underlying cancer metastasis remain poorly understood. Here, we report that TFAM deficiency rapidly and stably induced spontaneous lung metastasis in mice with liver cancer. Interestingly, unexpected polymerization of nuclear actin was observed in TFAM-knockdown HCC cells when cytoskeleton was examined. Polymerization of nuclear actin is causally linked to the high-metastatic ability of HCC cells by modulating chromatin accessibility and coordinating the expression of genes associated with extracellular matrix remodeling, angiogenesis, and cell migration. Mechanistically, TFAM deficiency blocked the TCA cycle and increased the intracellular malonyl-CoA levels. Malonylation of mDia2, which drives actin assembly, promotes its nuclear translocation. Importantly, inhibition of malonyl-CoA production or nuclear actin polymerization significantly impeded the spread of HCC cells in mice. Moreover, TFAM was significantly downregulated in metastatic HCC tissues and was associated with overall survival and time to tumor recurrence of HCC patients. Taken together, our study connects mitochondria to the metastasis of human cancer via uncovered mitochondria-to-nucleus retrograde signaling, indicating that TFAM may serve as an effective target to block HCC metastasis.
Keywords: HCC; metastasis; mitochondrial transcription factor A; nuclear F-actin.
© 2022 The Authors.
Figures

- A
Gross images and H&E staining of lungs from liver‐specific gene knockout mice with hydrodynamic tail vein injection of Akt and β‐catenin. Scheme of the experiment was shown. Scale bars, 1 mm.
- B, C
Gross images and H&E staining of lungs from TFAM+/LKO or TFAMLKO mice injected with Akt/N‐ras or treatment with DEN and CCl4. Scale bars, 1 mm.
- D
Gross images and H&E staining of lung and liver from TFAM+/LKO or TFAMLKO mice injected with Akt/β‐catenin. Different time points were shown. Liver/body weight ratio and percentage of microscopic tumor area was used as the measurements of the tumor burden. Scale bars, 1 mm (lung); 50 μm (liver).

- A
Gross images and H&E staining of liver from MFN1 or MFN2 homozygous and heterozygous knockout mice injected with Akt/β‐catenin plasmids.
- B
Primary tumor burden of MFN1 or MFN2 knockout mice injected with Akt/β‐catenin plasmids.
- C, D
Gross images, H&E staining of lung and liver (C) and primary tumor burden (D) of TFAM homozygous and heterozygous mice injected with Akt/N‐ras plasmids.
- E–H
Gross images and H&E staining of liver (E) and primary tumor burden (G) of DEN and CCl4‐induced mice. Scale bars, 50 μm. Scale bars, 1 mm (lung); 50 μm (liver). (F) Gross images and H&E staining of liver and lung and (H) liver‐to‐body weight ratio of WT mice injected with pT3‐EF1α empty plasmids.

- A, B
qRT–PCR and Western blot assays for the expression level of TFAM in ten HCC cell lines, one normal liver cell line (LO2) and two non‐tumor liver tissues. The protein level was quantified as ratios between TFAM and GAPDH (n = 3 independent experiments).
- C
Western blot and quantitative analysis for the expression of TFAM in HCC cells with TFAM stable knockdown and control cells (n = 3 independent experiments). shCtrl, control shRNA; shTFAM, shRNA against TFAM; EV, empty vector; TFAM, expression vector encoding TFAM.
- D, E
Wound‐healing migration assay (D) and Transwell migration and invasion assays (E) for HCC cells with treatment as indicated (n = 3 independent experiments). Scale bars, 100 μm.
- F
SNU‐368 cells with TFAM knockdown or HLE cells with TFAM overexpression were infected with firefly luciferase‐expressing lentivirus and transplanted into livers of nude mice. Representative bioluminescent imaging for each group (n = 10) is shown.
- G
Representative H&E images of lung metastasis in mice used in (F). Scale bars, 100 μm.
- H, I
Number of metastatic nodules per lung (H) and the incidence of lung metastasis (I) in mice used in (F).
- J
Kaplan–Meier survival curves for mice inoculated with orthotopic HCC cells as indicated. n = 10 per group.
- A, B
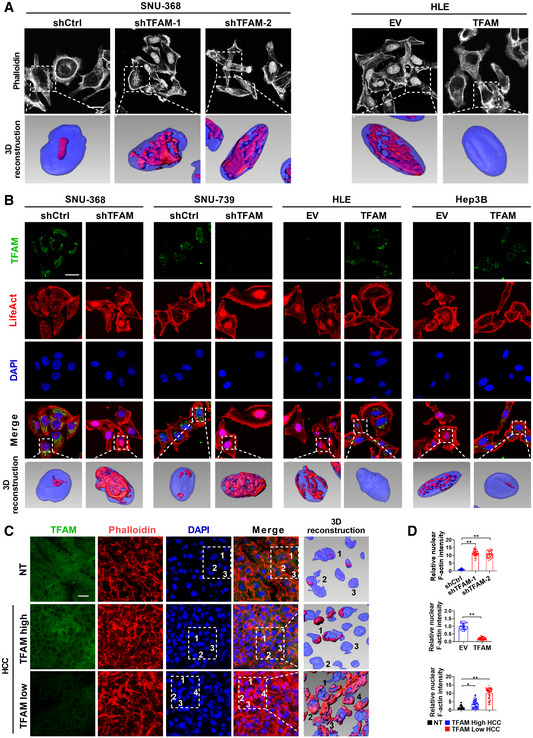
Representative confocal microscopy images of F‐actin and 3D reconstruction of z‐stacks from nuclear region with IMARIS software in Phalloidin‐stained HCC cells (A) and LifeAct‐mCherry Venus expressing cells with treatment as indicated (B) (n = 3 independent experiments). Red: Phalloidin or LifeAct, Blue: DAPI. shCtrl, control shRNA; shTFAM, shRNA against TFAM; EV, empty vector; TFAM, expression vector encoding TFAM. Scale bars, 20 μm for microscopy images, 40 μm for 3D reconstruction.
- C
Immunofluorescence analysis of TFAM and Phalloidin staining in human HCC cells from paired clinical samples (n = 100). The 3D reconstruction of z‐stacks from nuclear region is showed in the right side. Red: LifeAct, Blue: DAPI, Green: TFAM. Scale bars, 20 μm for microscopy images, 40 μm for 3D reconstruction.
- D
Statistical analysis for fluorescent intensity of nuclear F‐actin in (A), (B), and (C). Fluorescence intensity are quantified from at least 30 cells for each group in (A) and (B). One‐way ANOVA. *P < 0.05; **P < 0.01.

- A, B
Representative confocal microscopy images of F‐actin in Phalloidin‐stained HCC cells with treatment as indicated (n = 3 independent experiments). shCtrl, control shRNA; shTFAM, shRNA against TFAM; shMFN2, shRNA against MFN2; EV, empty vector; TFAM, expression vector encoding TFAM. Scale bars, 20 μm.
- C
Statistical analysis for Fig 3B.
- D
The expression of actin constructs was analyzed by qPCR as the product spans the fusion site. WT‐actin‐NLS, expression vector encoding NLS‐tagged wild type actin; R62D‐actin‐NLS, expression vector encoding NLS‐tagged non‐polymerizable actin mutant (R62D).
- E, F
Representative images of wound‐healing migration (E) and transwell analysis (F) for HCC cells with treatment as indicated.

- A
Representative images of F‐actin in Lifeact‐mCherry Venus expressing cells with treatment as indicated (n = 3 independent experiments). WT‐actin‐NLS, expression vector encoding NLS‐tagged wild‐type actin (WT); R62D‐actin‐NLS, expression vector encoding NLS‐tagged non‐polymerizable actin mutant (R62D). Scale bars, 20 μm.
- B, C
Transwell and wound‐healing migration analysis for HCC cells with treatment as indicated (n = 3 independent experiments).
- D
SNU‐368 shTFAM cells with R62D‐actin‐NLS or WT‐actin‐NLS were infected with firefly luciferase‐expressing lentivirus and transplanted into livers of nude mice. Representative bioluminescent imaging for each group (n = 10)
- E
Representative H&E images of lung metastasis in mice used in (D). Scale bars, 100 μm.
- F, G
Number of metastatic nodules per lung in mice used in (F) and the incidence of lung metastasis (G) in mice used in (D).
- H
Kaplan–Meier survival curves for mice inoculated with orthotopic HCC cells as indicated. n = 10 per group.

- A
Expression heatmap of ATAC‐DEGs in TFAM knockdown and control SNU‐368 cells (n = 3 per group). Up‐ and down‐regulated ATAC‐DEGs in TFAM knockdown HCC cells were annotated.
- B, C
Top 20 GO terms and enriched KEGG pathways enriched by ATAC‐DEGs. Rich factor represents the ratio of the number of mapped genes to the number of all the annotated genes located in the pathway.
- D
ATAC‐seq signal tracks around the FN1, IL‐6, TGFB1, and ITGB3 genes in HCC cells with treatment as indicated. Blue box indicates promoter region with increased accessibility.
- E, F
qRT–PCR and Western blot assays for mRNA and protein expression levels of metastasis‐related gene in HCC cells (n = 3 independent experiments) and tumor tissues from mice (n = 4 per group) with treatments as indicated.
- G
ELISA for the levels of IL‐6 and TGFB1 in HCC cells and tumor tissues from mice with treatments as indicated (n = 3 independent experiments).
- H, I
Western blot assays and ELISA for the levels of FN1, IL‐6, TGFB1, and ITGB3 in HCC cells with treatment as indicated (n = 3 independent experiments).

- A, B
Western blotting and quantitative analyses for the expression levels of TFAM and nuclear actin in human HCC cells with treatment as indicated. The expression level was calculated using the band intensity of Protein X relative to GAPDH or to Lamin B1 (n = 3 independent experiments).
- C, D
Quantitative analyses of key regulators in actin polymerization in Fig 6A and B.
- E
Immunofluorescence analysis of TFAM and mDia2 in human HCC cells with treatment as indicated (n = 3 independent experiments). Green: TFAM, Red: mDia2, Blue: DAPI. Scale bars, 20 μm.
- F, G
The distribution of mDia2 in HCC cells in Fig 6C and D was quantified by their nucleus to cytoplasm (N/C) ratios.
- H
Transwell migration and invasion analysis for HCC cells with treatment as indicated (n = 3 independent experiments). Scale bars, 100 μm.
- I
Representative IHC images for TFAM and mDia2 in human HCC tissues. Scale bars, 25 μm.

- A
Western blot analyses for the protein level of key regulators of actin polymerization in the cytoplasm and nucleus of HCC cells with treatment as indicated. Tublin and Lamin B1 were used as loading controls for the cytoplasm and nucleus, respectively (n = 3 independent experiments).
- B
Western blot analyses for the protein level in tissues of mouse liver tumor induced by Akt/β‐catenin (n = 3 independent experiments).
- C
Representative immunofluorescence images of HCC cells co‐transfected with mDia2‐GFP and other constructs as indicated (n = 3 independent experiments). Scale bars, 20 μm.
- D
Representative images of immunofluorescence assay for mDia2 and phalloidin staining for HCC cells with treatment as indicated (n = 3 independent experiments). WT‐mDia2: expression vector encoding wild type mDia2. mDia2‐NLS del.: expression vector encoding truncated mDia2 lacking NLS peptide. Scale bars, 20 μm.
- E–G
Representative IHC images of mDia2 nuclear translocation in human (E) and mouse (G) HCC tissues. NT, non‐tumor liver tissues, n = 100; MT, metastatic tumor tissues, n = 58; NMT, non‐metastatic tumor tissues n = 42. Scale bars, 25 μm. (F) Positive rates of mDia2 in nucleus and cytoplasm was calculated based on the IHC assay in (E). Graphs show mean ± SEM. One‐way ANOVA. **P < 0.01.
- H, I
Spearman correlation analysis between the positive rates of nuclear mDia2 and the TFAM expression level (or positive rates of nuclear F‐actin) based on the IHC assay in (E).

- A
Schemes of glucose metabolism alternation detected by targeted metabolomics. The fold change of metabolites in mitochondria and cytoplasm between TFAM knockdown and WT SNU‐368 cells were shown (n = 6 per group). Increased and decreased metabolites are indicated by red and green circles, respectively.
- B
The fold change of intracellular acetyl‐CoA, malonyl‐CoA, and lactate in SNU‐368 cells with TFAM knockdown was evaluated by ELISA or enzymatic reaction (n = 3 independent experiments).
- C
Extracellular acidification rate (ECAR) was measured in TFAM knockdown and WT SNU‐368 cells with serial addition of glucose, oligomycin and 2‐DG (n = 3 independent experiments). The panel shows the calculated glycolytic parameters, including glycolysis and maximal glycolysis. Glycolysis was calculated as maximum rate measurement before Oligomycin injection minus last rate measurement before glucose injection. While glycolytic capacity was calculated as maximum rate measurement after Oligomycin injection minus last rate measurement before glucose injection.
- D
Western blot analysis of anti‐mDia2 IPs and whole‐cell lysates (WCL) derived from HCC cells and mouse tumor tissues (n = 3 independent experiments). NT, non‐tumor liver tissues; MT, metastatic tumor tissues; NMT, non‐metastatic tumor tissues.
- E
The level of malonylated mDia2. Equal amount of immunoprecipitated mDia2 either from TFAM knockdown or control cells was loaded in Western blot assay.
- F
Western blot analysis for the distribution of mDia2 in SNU‐368 cells incubated with malonyl‐CoA (5 μM) or ND‐630 (10 μM) (n = 3 independent experiments).
- G
Bioluminescent images for lung metastasis in mice inoculated with HCC cells. n = 10. Ten days after orthotopic implantation of SNU‐368 shTFAM cells, ND‐630 (3 mg/kg) was intravenously injected in mice every 2 days until euthanasia was performed.
- H
Representative H&E images of lung metastasis in mice used in (G). Scale bars, 100 μm.
- I
Number of metastatic nodules per lung in mice used in (G).
- J
Kaplan–Meier survival curves for mice inoculated with orthotopic HCC cells as indicated. n = 10 per group.
- K, L
Representative merged images of mDia2‐GFP (Green) and DAPI staining (blue) (K) and Phalloidin (Red) and DAPI staining (blue) (L) in HCC cells transfected with different mutant mDia2‐GFP constructs as indicated (n = 3 independent experiments). Scale bars, 20 μm. K12E and K27E are malonylation‐mimetic mutants at lysine residues 12 and 27. K12Q and K27Q are acetylation‐mimetic mutants at lysine residues 12 and 27.
- M
Statistical analysis of transwell migration and invasion assays for HCC cells with treatment as indicated (n = 3 independent experiments).

- A
The purity of mitochondrial and cytoplasmic fractions was validated by Western blot analysis of “house‐keeper” marker proteins specific for each cellular compartment.
- B, C
The activity of ACC1 (B) and the content of neutral lipids (C) was detected by BODIPY 493/503 staining in HCC cells with treatment as indicated (n = 3 independent experiments). Scale bars, 20 µm.
- D
Coomassie bright blue was used to verify mDia2 band in IP assay.
- E, F
Quantitative analyses for Western blot in Fig 7D and E. The protein level was calculated using the band intensity of Protein X relative to immunoprecipitated mDia2 or GAPDH or Lamin B1, where appropriate.
- G
Western blot analyses for the expression of ACC1 in SNU‐368 shTFAM cells transfected with siRNA against ACC1 (n = 3 independent experiments). siCtrl, control siRNA; siACC1, siRNA against ACC1.
- H
The level of malonyl‐CoA in SNU‐368 cells treated with malonyl‐CoA or ND‐630 for 24 h or siRNA against to ACC1 (n = 3 independent experiments).
- I
The level of malonylated mDia2 was determined by Western blot in SNU‐368 HCC cells with treatment as indicated (n = 3 independent experiments).
- J
The level of malonylated mDia2 was determined by Western blot in SNU‐368 shTFAM cells with treatment as indicated (n = 3 independent experiments).
- K
Quantitative analyses for Western blot in Fig 7F (n = 3 independent experiments).
- L
Western blot and quantitative analysis for the distribution of mDia2 in SNU‐368 cells with ACC1 knockdown (n = 3 independent experiments).
- M, N
Wound‐healing migration (M) and transwell analysis (N) for HCC cells with treatment as indicated (n = 3 independent experiments).

- A
Western blot and quantitative analyses for the expression of SIRT5 in SNU‐368 shTFAM cells with treatment as indicated (n = 3 independent experiments). siCtrl, control siRNA; siSIRT5, siRNA against SIRT5; EV, empty vector; SIRT5, expression vector encoding SIRT5.
- B, C
The level of malonylated mDia2 was determined by Western blot in SNU‐368 shTFAM cells with treatment as indicated. The SIRT5 inhibitor NRD167 was used at 10 μM (n = 3 independent experiments).
- D, E
The location of mDia2 was determined by Western blot in SNU‐368 shTFAM cells with treatment as indicated (n = 3 independent experiments).
- F, G
Wound‐healing migration (F) and transwell analysis (G) for HCC cells with treatment as indicated (n = 3 independent experiments).

- A
IHC scores of TFAM in 429 paired tissues from HCC patients. The relative expression ratio of tumor to non‐tumor was log2‐transformed. T, tumor tissues; NT, non‐tumor liver tissues.
- B
mRNA level of TFAM in 50 HCC patients’ paired tissues from TCGA database. The relative expression ratio of tumor to non‐tumor was log2‐transformed.
- C
Representative images of IHC staining of TFAM (top panel) and scores (bottom panel) in HCC tumor tissues. One‐way ANOVA. *P < 0.05; **P < 0.01. MT, metastatic tumor tissues; NMT, non‐metastatic tumor tissues. Scale bars, 25 μm. Boxes: first quartile to third quartile; Whiskers: minimum value to maximum value; Central band: median.
- D, E
Kaplan–Meier curves for overall survival and the recurrence of HCC patients stratified by TFAM expression.
- F, G
Kaplan–Meier curves for overall survival and the recurrence of HCC patients stratified by nuclear F‐actin positive rates.
- H
Representative images of IHC staining of TFAM, FN1, and ITGB3 from two HCC patients. Scale bars, 25 μm.
- I
Spearman correlation analysis between the levels of TFAM and FN1, IL‐6, TGFB1, or ITGB3.
References
-
- Baarlink C, Plessner M, Sherrard A, Morita K, Misu S, Virant D, Kleinschnitz E‐M, Harniman R, Alibhai D, Baumeister S et al (2017) A transient pool of nuclear F‐actin at mitotic exit controls chromatin organization. Nat Cell Biol 19: 1389–1399 - PubMed
-
- Baarlink C, Wang H, Grosse R (2013) Nuclear actin network assembly by formins regulates the SRF coactivator MAL. Science 340: 864–867 - PubMed
Publication types
MeSH terms
Substances
LinkOut - more resources
Full Text Sources
Medical
Molecular Biology Databases
Research Materials
