. 2022 Aug 1;95(1136):20210790.
doi: 10.1259/bjr.20210790. Epub 2022 Jul 12.

CT review of ovarian fibrothecoma

Affiliations

CT review of ovarian fibrothecoma

Jackson Junior Pat et al. Br J Radiol. .

Abstract

Objective: The aim of this study was to investigate the CT imaging characteristics of ovarian fibrothecoma which may aid in the differentiation from early stage epithelial tumours.

Methods: Comparison of 36 patients (41 lesions) with pathologically proven ovarian fibrothecoma tumours and 36 (52 lesions) serous papillary carcinomas (SPCs) lesions. We noted their laterality, size, density, calcifications, Hounsfield units (HUs) and introduced a novel HU comparison technique with the psoas muscle or the uterus. Patients' clinical findings such as ascites, pleural effusion, carbohydrate antigen-125 levels, and lymphadenopathy findings were also included.

Results: Average age was 67.8 and 66 across the fibrothecoma and SPC cohort respectively. Fibrothecoma tumours had diameters ranging from 24 to 207 mm (Median: 94 mm). 80.6% of the fibrothecoma cohort had ascites which was comparable to the 72.2% in the SPC cohort. 70.7% of fibrothecoma tumour favour a purely to predominantly solid structural configuration (p < 0.001). The average HU value for the fibrothecoma solid component was 44 ± 11.7 contrasting the SPC HU value of 66.8 ± 15. The psoas:tumour mass ratio demonstrated a median of 0.7, whereas SPCs shows a median of 1.1 (p < 0.001).

Conclusion: Suspicion of ovarian fibrothecoma should be considered through interrogation of their structural density configuration, low psoas to mass HU ratio and a presence of ascites.

Advances in knowledge: CT imaging can be a useful tool in diagnosing fibrothecoma tumours and subsequently reducing oncogynaecological tertiary centre referrals, financial burden and patient operative morbidity and mortality.


Figures

Figure 1.
Figure 1.
(A): High power (x200) histological slice. (Yellow bottom Circle) Fibromatous area comprising spindle cells with individual cells surrounded by pink collagen. (Green upper Circle) Cluster of thecomatous cells with pale cytoplasm and arranged in clusters. Clarity due to theca cell associated fat oestrogen-based products. (B): Macro section of the ovarian fibrothecoma mass.
Figure 2.
Figure 2.
Boxplot illustrating the range of HU density between the psoas muscle, uterus and the solid component of each corresponding ovarian mass. EM, endometrioid carcinoma; FBT, fibrothecoma; SPC, serous papillary carcinoma.
Figure 3.
Figure 3.
Boxplot of Mass to Psoas (blue) and Mass to Uterus (Red) density ratios of the three ovarian masses.
Figure 4.
Figure 4.
Structural configuration of fibrothecoma with its corresponding imaging. (Red line – Tumour demarcation | Dotted Blue line – Solid-cystic demarcation) Demonstrating the tumour’s tendency to favour solid configuration.
Figure 6.
Figure 6.
Scatter graph demonstrating a positive correlation between fibrothecoma tumour sizes and the degree of ascites. 0 – No ascites, 1 – Mild ascites (fluid in the subhepatic spaces), 2 – Moderate ascites (fluid in the subphrenic space, perisplenic and pelvis), 3 – Significant ascites (distended abdomen with intra-abdominal fluid surrounding the mesentery) Spearman’s correlation coefficient (r) = 0.49, p = 0.0012.
Figure 5.
Figure 5.
Scatter graph demonstrating positive correlation between the size of the fibrothecoma tumour and its tendency to adopt a more cystic structural configuration. Spearman’s correlation coefficient (r) = 0.66, p < 0.001.
Figure 7.
Figure 7.
Structural configuration of ovarian serous papillary carcinomas with its corresponding imaging. (Red line – Tumour demarcation | Blue dotted line – solid-cystic demarcation). Bar chart demonstrates the increasing trend of tumour tendency towards predominantly cystic configuration. SPC, serous papillary carcinoma.
Figure 8.
Figure 8.
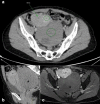
Matching CT and MRI Comparison of fibrothecoma and a large leiomyoma (A) CT axial study demonstrating prominent enhancement of the leiomyoma in comparison to the Uterus (Denoted by the Top ROI. Bottom ROI denotes HU of fibrothecoma mass). (B) CT sagittal slice of the large fibrothecoma (Denoted by the asterisk, *) and the leiomyoma­ (Denoted by the plus symbol, +) (C) MRI T1 post contrast axial slice of the heterogenous, hyperintense uterus in comparison to the large fibrothecoma mass.
Figure 9.
Figure 9.
Split proportion of FBT and SPC patients in relation to their corresponding clinical signs. Presence of ascites is common in both cohorts, however, there is a higher probability that other clinical signs would be present in patients with SPC. FBT, fibrothecoma; SPC, serous papillary carcinoma.
Figure 10.
Figure 10.
Fibrothecoma (solid component) vs Psoas HU ratio comparison. (A) Axial section of fibrothecoma mass. (B) Coronal section of fibrothecoma mass and psoas muscle. (C) Axial section of the psoas muscle. Mean HU of psoas – 63. Mean HU of fibrothecoma mass – 38. HU, Hounsfield unit. In cases of fibrothcoma, the ratio value is likely to be less than 1.
Figure 11.
Figure 11.
SPC (solid component) vs Psoas HU ratio comparison. (A) Axial image demonstrating bilateral ovarian SPC tumour. (B) Denoting the HU value of the tumour and psoas muscle in coronal view. In cases of SPCs, when equation 1 is applied, the ratio value is likely to be greater than 1. HU, Hounsfield unit; SPC, serous papillary carcinoma.

Similar articles

Cited by

References

    1. Troiano RN, Lazzarini KM, Scoutt LM, Lange RC, Flynn SD, McCarthy S. Fibroma and fibrothecoma of the ovary: MR imaging findings. Radiology 1997; 204: 795–98. doi: 10.1148/radiology.204.3.9280262 - DOI - PubMed
    1. Zhang Z, Wu Y, Gao J. CT diagnosis in the thecoma-fibroma group of the ovarian stromal tumors. Cell Biochem Biophys 2015; 71: 937–43. doi: 10.1007/s12013-014-0288-7 - DOI - PubMed
    1. Shinagare AB, Meylaerts LJ, Laury AR, Mortele KJ. MRI features of ovarian fibroma and fibrothecoma with histopathologic correlation. AJR Am J Roentgenol 2012; 198: W296-303. doi: 10.2214/AJR.11.7221 - DOI - PubMed
    1. Chen VW, Ruiz B, Killeen JL, Coté TR, Wu XC, Correa CN. Pathology and classification of ovarian tumors. Cancer 2003; 97: 2631–42. doi: 10.1002/cncr.11345 - DOI - PubMed
    1. Kurman RJ RJ, Carcangiu ML ML, Herrington C. Classification of tumours of the ovary. 4th ed. WHO Classification of Tumours; 2014, pp.44–56.

Supplementary concepts