. 2022 Apr 22;7(8):e155761.
doi: 10.1172/jci.insight.155761.

Oxidative stress promotes fibrosis in systemic sclerosis through stabilization of a kinase-phosphatase complex

Affiliations

Oxidative stress promotes fibrosis in systemic sclerosis through stabilization of a kinase-phosphatase complex

Ruiyuan Zhang et al. JCI Insight. .

Abstract

Systemic sclerosis (SSc) is a fibrotic autoimmune disease characterized by pathogenic activation of fibroblasts enhanced by local oxidative stress. The tyrosine phosphatase PTP4A1 was identified as a critical promoter of TGF-β signaling in SSc. Oxidative stress is known to functionally inactivate tyrosine phosphatases. Here, we assessed whether oxidation of PTP4A1 modulates its profibrotic action and found that PTP4A1 forms a complex with the kinase SRC in scleroderma fibroblasts, but surprisingly, oxidative stress enhanced rather than reduced PTP4A1's association with SRC and its profibrotic action. Through structural assessment of the oxo-PTP4A1-SRC complex, we unraveled an unexpected mechanism whereby oxidation of a tyrosine phosphatase promotes its function through modification of its protein complex. Considering the importance of oxidative stress in the pathogenesis of SSc and fibrosis, our findings suggest routes for leveraging PTP4A1 oxidation as a potential strategy for developing antifibrotic agents.

Keywords: Autoimmune diseases; Fibrosis; Inflammation; Rheumatology.


Figures

Figure 1
Figure 1. PTP4A1 and SRC form a complex in dermal fibroblasts.
(A) Representative PTP4A1-SRC PLA signal in NHDFs versus SScDFs (left) with quantification (right). n = 3 cell lines each. Dots of the same color are from the same NHDF or SScDF cell line. (B) Representative PTP4A1-SRC PLA signal in skin specimens from healthy donors (n = 6) versus fibrotic patients with SSc (n = 7) (left) with quantification (right). Each point represents an individual donor. (C) Representative PLA signal in skin of mice treated with bleomycin (n = 4) or control mice (n = 3) (left) with quantification (right). (A and B) Blue = DAPI, magenta = PLA. (C) Blue = DAPI, red = PLA, magenta = overlap. (A) Images were captured with 60× original magnification. (B and C) Images were captured with 20× original magnification. (AC) Data shown are mean ± SEM of data normalized to the control averages. Two-tailed Welch’s t test. *P < 0.05, **P < 0.01, ****P < 0.0001.
Figure 2
Figure 2. Oxidative stress promotes PTP4A1 and SRC association.
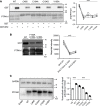
(A) Representative PTP4A1-SRC PLA signal in TGF-β–stimulated SScDFs treated with or without NAC (left) with quantification (right). n = 8 experiments across 7 cell lines. (B) Representative Western blotting image of co-IP between PTP4A1 and SRC from HEK293T cells untreated or incubated with H2O2 (top) with quantification (bottom). n = 5, reducing buffer. Rabbit IgG was used for control IP. (C) Binding of SRC to Ni-NTA agarose-bound His6-tagged oxidized/reduced PTP4A1. Ni-NTA agarose beads were used as control. Non-reducing buffer. (A) Blue = DAPI, magenta = PLA. (A) Images were captured with 40× original magnification. Data shown are mean ± SEM of data normalized to the control averages. Two-tailed paired t test from the non-normalized data in A, 2-tailed Welch’s t test in B, 1-way ANOVA in C. **P < 0.01, ***P < 0.001.
Figure 3
Figure 3. PTP4A1 binds SRC on the SH3SH2 domains.
(A and B) Representative Western blotting (left) with quantification (right) of (A) binding of purified full-length SRC to Ni-NTA agarose-bound His6-tagged PTP4A1 with Ni-NTA beads as control (n = 5) and (B) binding of GST-tagged SRC SH3SH2 to Ni-NTA agarose-bound His6-tagged PTP4A1 (n = 5). (C) SPR sensorgram (red) of oxidized PTP4A1 binding to immobilized His6-tagged SRC SH3SH2 with fit to a 1:1 kinetic model (black) and residuals plot (Δ). Two-tailed paired t test in A and B. ***P < 0.001.
Figure 4
Figure 4. Oxidation-induced conformational changes in PTP4A1 P- and WPD-loops promote interaction with SRC.
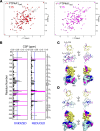
(A) Two-dimensional [1H,15N] TROSY spectra of oxidized and reduced PTP4A1 in the absence (black) or presence (red, magenta) of excess SRC SH3SH2. Blue dotted lines indicate 1σ levels, and residues that are line broadened beyond detection are indicated by magenta bars. (B) Diagram of CSPs of oxidized (top) and reduced (bottom) PTP4A1 upon binding of SRC SH3SH2. (C and D) Secondary structure elements are shown for reference. Residues showing chemical shift changes (blue; greater than 1σ) and intensity changes (magenta) for (C) oxidized and (D) reduced PTP4A1 were mapped onto the structures of oxidized (PDB ID 1RXD) and reduced (PDB ID 1XM2) PTP4A1 in ribbon and solvent-accessible surface representation. The key interacting regions of PTP4A1 are labeled.
Figure 5
Figure 5. SRC binds PTP4A1 through its SH3 and SH2 domains.
(A) Two-dimensional [1H,15N] TROSY spectra of SRC SH3SH2 in the absence (black) or presence of excess oxidized (red) and reduced (magenta) PTP4A1. (B) Diagram of CSP of SRC SH3SH2 upon binding of oxidized (left) and reduced (right) PTP4A1 as in Figure 4A and mapping of residues showing chemical shift changes (blue) and reduced intensity (magenta; I/I0 < 0.7) onto the structure of SRC SH3SH2 (PDB ID 2SRC) for (C) oxidized and (D) reduced PTP4A1. The key interacting regions of SRC SH2SH3 are labeled.
Figure 6
Figure 6. oxo-PTP4A1 selectively interacts with open SRC.
(A and B) Structural superposition of (A) open (PDB ID 1Y57) and (B) closed (PDB ID 2SRC) structures of SRC (pink) with the NMR-based docking model of oxidized PTP4A1 (blue) with SRC SH3SH2 (SH3: yellow, SH2: cyan). (C and D) Representative Western blotting (top) with quantification (bottom) (n = 5) of (C) binding of purified autophosphorylated or unphosphorylated SRCY527F to covalently immobilized PTP4A1 and (D) binding of purified CSK-phosphorylated or unphosphorylated SRCK295A to covalently immobilized PTP4A1. Two-tailed paired t test in C and D. ***P < 0.001.
Figure 7
Figure 7. Mutational analysis of PTP4A1-SRC interaction and its effect on TGF-β signaling.
(A and B) Representative Western blotting (top) with quantification (bottom) (n = 5) of (A) GST coprecipitation assay of binding between PTP4A1 mutants C49S, C104A, C104D, and V105A with GST-tagged SRC SH2 normalized to PTP4A1 mutant loaded on the beads, and (B) binding between F153A/K155A and S180A mutants of GST-tagged SRC SH2 to PTP4A1. (C) Representative Western blotting of lysates from TGF-β–stimulated HEK293T cells transfected with WT or mutant PTP4A1 (left) with quantification of luciferase luminescence from SMAD reporter assay (right). The signal from the cells treated with H2O2 was normalized to untreated ones. Data shown are mean ± SEM. n = 9. One-way ANOVA in A and B, 1-way ANOVA with multiple-comparison test in C. ***P < 0.001.
Figure 8
Figure 8. Global inducible deletion of PTP4A1 prevents and reduces progression of fibrosis.
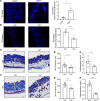
(A) Representative PTP4A1-SRC PLA signal in skin specimens from TBRICA-expressing or control mice (left) with quantification (right), n ≥ 4. (B) Representative PLA signal in skin from Col1a1-Cre mice treated with tamoxifen before induction of fibrosis (left) with quantification (right), n = 5. (C and F) Representative Masson’s trichrome staining of skin from Ubc-Cre mice treated with tamoxifen before (C) or after (F) induction of fibrosis. Yellow lines show representative quantification of dermis thickness. Twenty or more measurements were taken across each section. (D and G) Quantification of skin thickness in specimens from C and F, respectively. (D) Dotted line shows average normal dermal thickness. (E and H) Quantification of hydroxyproline on specimens from C and F, respectively. (CE) n ≥ 5, (FH) n ≥ 7. (A and B) Blue = DAPI, magenta = PLA. Images were captured with 20× original magnification. All data are mean ± SEM. Data in A and B are shown normalized to the control averages. Two-tailed Mann-Whitney test in A, B, D, and H; 2-tailed Welch’s t test in E and G. *P < 0.05, **P < 0.01, ***P < 0.001.

References

    1. Denton CP, Khanna D. Systemic sclerosis. Lancet. 2017;390(10103):1685–1699. doi: 10.1016/S0140-6736(17)30933-9. - DOI - PubMed
    1. Skhirtladze C, et al. Src kinases in systemic sclerosis: central roles in fibroblast activation and in skin fibrosis. Arthritis Rheum. 2008;58(5):1475–1484. doi: 10.1002/art.23436. - DOI - PubMed
    1. Stanford SM, Bottini N. Targeting tyrosine phosphatases: time to end the stigma. Trends Pharmacol Sci. 2017;38(6):524–540. doi: 10.1016/j.tips.2017.03.004. - DOI - PMC - PubMed
    1. Gabrielli A, et al. New insights into the role of oxidative stress in scleroderma fibrosis. Open Rheumatol J. 2012;6:87–95. doi: 10.2174/1874312901206010087. - DOI - PMC - PubMed
    1. Piera-Velazquez S, et al. Increased expression of NAPDH oxidase 4 in systemic sclerosis dermal fibroblasts: regulation by transforming growth factor β. Arthritis Rheumatol. 2015;67(10):2749–2758. doi: 10.1002/art.39242. - DOI - PMC - PubMed

Publication types