. 2022 Aug 17;14(4):mjac021.
doi: 10.1093/jmcb/mjac021.

SARS-CoV-2 productively infects primary human immune system cells in vitro and in COVID-19 patients

Affiliations

SARS-CoV-2 productively infects primary human immune system cells in vitro and in COVID-19 patients

Marjorie C Pontelli et al. J Mol Cell Biol. .

Abstract

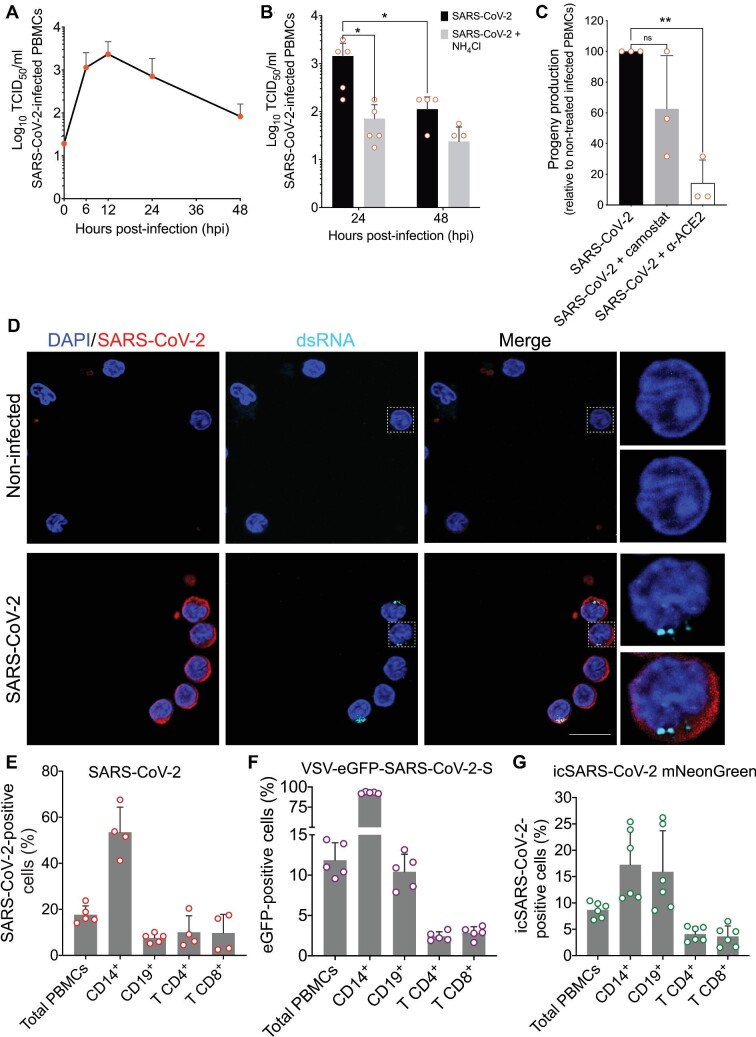
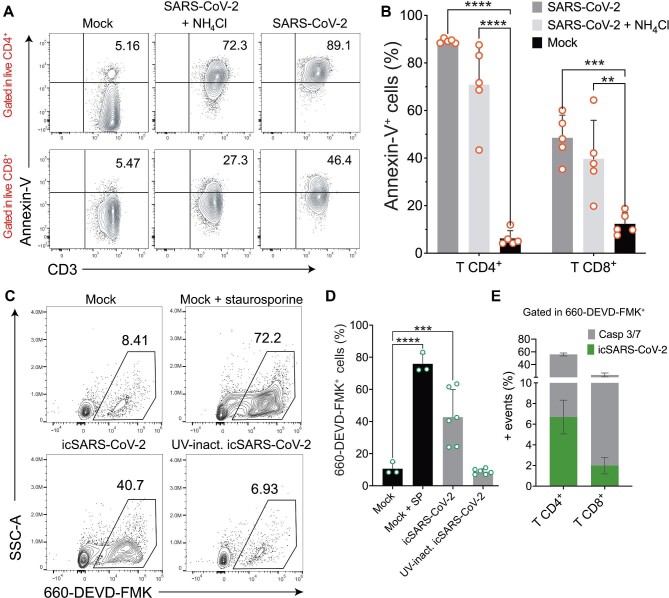
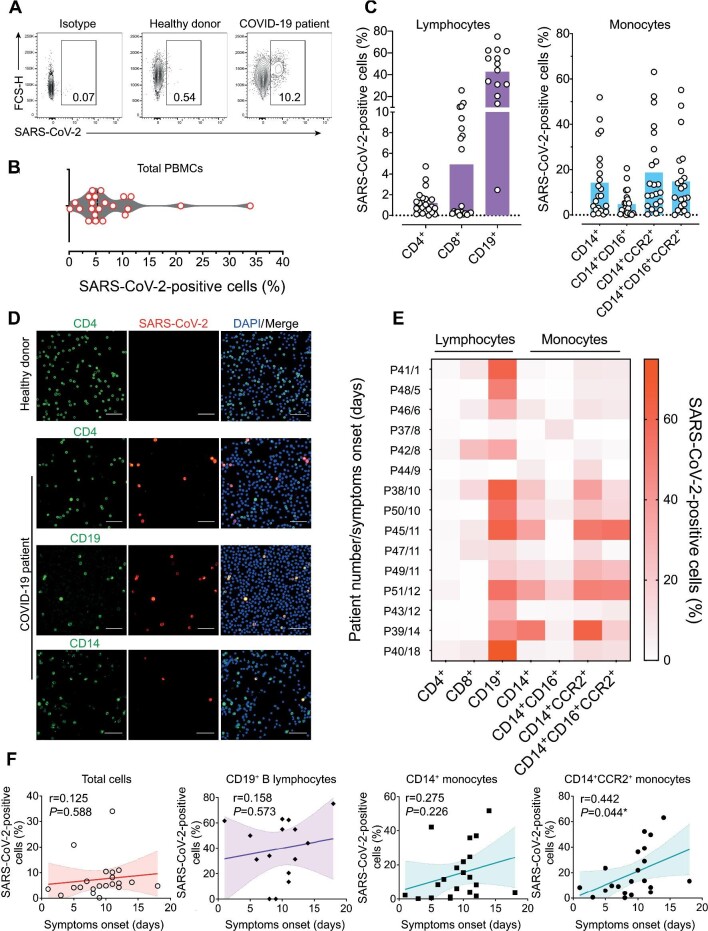
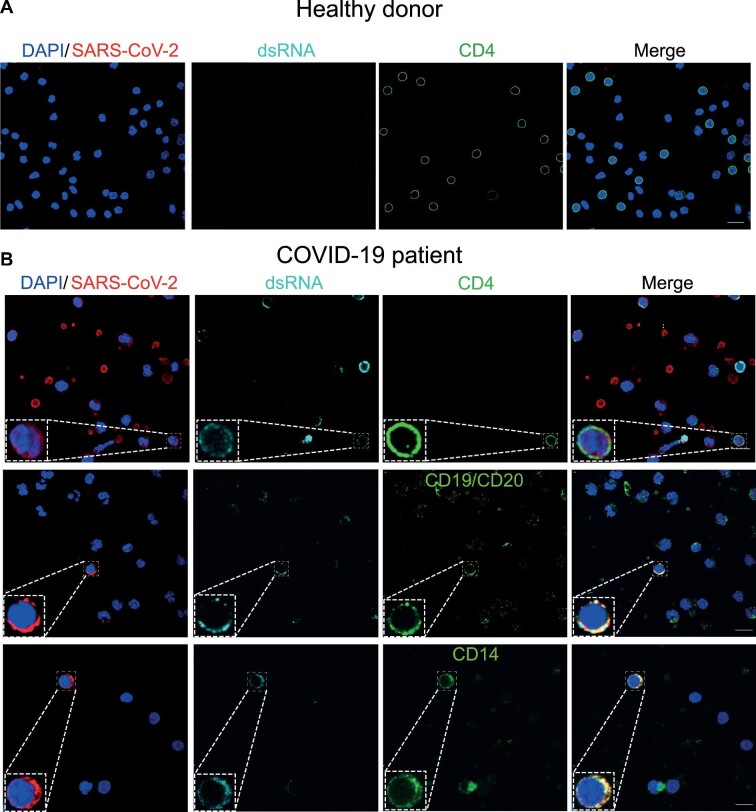
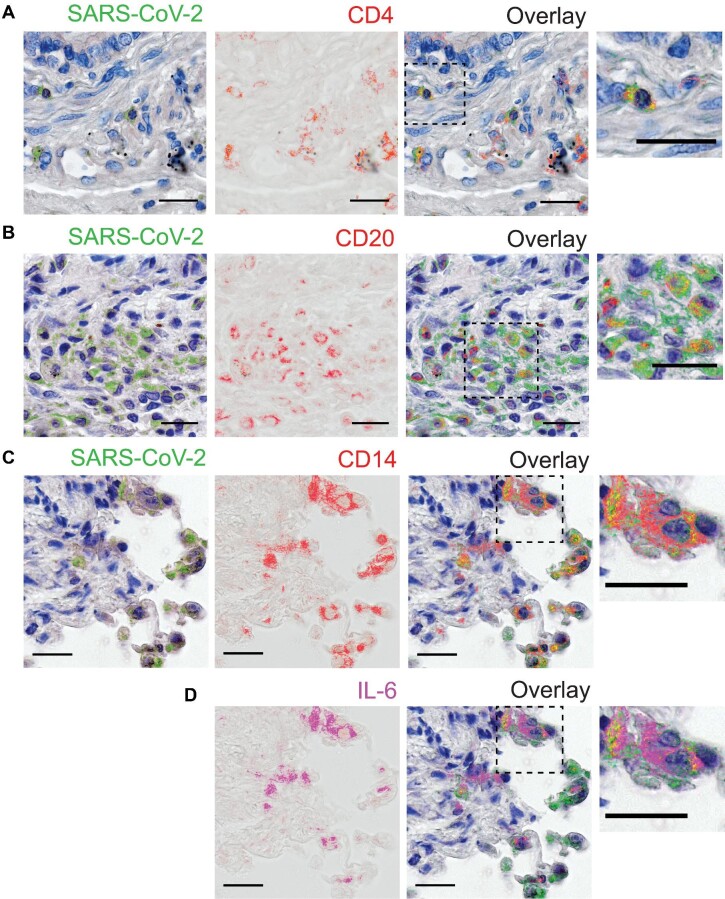
The severe acute respiratory syndrome coronavirus 2 (SARS-CoV-2) infection is associated with a hyperinflammatory state and lymphocytopenia, a hallmark that appears as both signature and prognosis of disease severity outcome. Although cytokine storm and a sustained inflammatory state are commonly associated with immune cell depletion, it is still unclear whether direct SARS-CoV-2 infection of immune cells could also play a role in this scenario by harboring viral replication. We found that monocytes, as well as both B and T lymphocytes, were susceptible to SARS-CoV-2 infection in vitro, accumulating double-stranded RNA consistent with viral RNA replication and ultimately leading to expressive T cell apoptosis. In addition, flow cytometry and immunofluorescence analysis revealed that SARS-CoV-2 was frequently detected in monocytes and B lymphocytes from coronavirus disease 2019 (COVID-19) patients. The rates of SARS-CoV-2-infected monocytes in peripheral blood mononuclear cells from COVID-19 patients increased over time from symptom onset, with SARS-CoV-2-positive monocytes, B cells, and CD4+ T lymphocytes also detected in postmortem lung tissue. These results indicated that SARS-CoV-2 infection of blood-circulating leukocytes in COVID-19 patients might have important implications for disease pathogenesis and progression, immune dysfunction, and virus spread within the host.

Keywords: COVID-19; SARS-CoV-2; apoptosis; lymphocytes; lymphocytopenia; monocytes; peripheral blood mononuclear cell (PBMC).


Figures

Figure 1
Figure 1
SARS-CoV-2 differentially infects subsets of human PBMCs in vitro. PBMCs from healthy donors were infected in vitro with SARS-CoV-2 Brazil/SPBR-02/2020 (MOI = 1) and cultured at 37°C. (A) Replication curve of SARS-CoV-2 with mean (and standard deviations, SDs) of virus titers (in TCID50/ml) in supernatants from cultures of PBMCs. (B) SARS-CoV-2 progeny titers in supernatants from infected PBMCs in culture for 24 and 48 hpi, with and without treatment with NH4Cl. (C) Effects on SARS-CoV-2 progeny production by blocking infection in PBMCs with antibody anti-ACE2 or camostat mesylate, an inhibitor of TMPRSS2. Titers were determined in supernatants at 24 hpi. Progeny titers after treatments were normalized to the progeny titer from untreated PBMCs. (D) Immunofluorescence for SARS-CoV-2 and dsRNA in PBMCs at 6 hpi with SARS-CoV-2. Cells were immunostained for SARS-CoV-2 (red) and dsRNA (cyan), and then analyzed by confocal microscopy. Magnification, 630× . Scale bar, 10 μm. (E) The total frequency and subpopulation's frequency of SARS-CoV-2-positive cells at 24 hpi with authentic SARS-CoV-2. PBMCs from healthy donors were infected, then at 24 hpi stained with mouse polyclonal anti-SARS-CoV-2, and analyzed by flow cytometry. (F) The total frequency and subpopulation's frequency of eGFP-positive cells at 8 hpi with the chimera VSV-eGFP-SARS-CoV-2-S virus. (G) The total frequency and subpopulation's frequency of neon green positive cells at 24 hpi with the infectious clone icSARS-CoV-2 mNeonGreen reporter virus. Individual values are plotted with circle signs; histograms depict mean ± SD. The percentage of each cell subtype was normalized against the total PBMC value. Statistical analysis was done by one-way or two-way analysis of variance (ANOVA). Tukey's or Holm–Sidak post-tests were applied when suitable. P-values < 0.05 were considered significant.
Figure 2
Figure 2
SARS-CoV-2 activates caspase 3/7 and increases the expression of cell death markers. (A) Representative flow cytometry plots of live CD4+ and CD8+ T cells positive for annexin-V staining in PBMCs at 24 hpi with SARS-CoV-2 (MOI = 1), in the presence or absence of NH4Cl. (B) Percentages of live lymphocytes positive for annexin-V and expressing PS at the cell surface after SARS-CoV-2 infection. (C) Representative plots of PBMCs presenting active caspase 3/7. Cells from healthy donors were infected with mock (in the absence or presence of the apoptosis inducer staurosporine), icSARS-CoV-2 (MOI=1), or UV-inactivated icSARS-CoV-2. At 24 hpi, cells were labelled with the fluorochrome-labelled inhibitors of caspases (FLICA) substrate 660-DEVD-FMK and analyzed by flow cytometry. (D) Frequencies of active caspase 3/7 in total PBMCs. SP, staurosporine. (E) Frequencies of T lymphocytes positive for caspase 3/7 (gray) and icSARS-CoV-2 (green) from the total PBMCs. Mean ± SD is indicated for all bar graphs. Significance was determined by two-way ANOVA and Bonferroni's post-test.
Figure 3
Figure 3
Detection of SARS-CoV-2 in PBMCs from hospitalized COVID-19 patients. Twenty-two ICU-hospitalized COVID-19 patients presenting a moderate to severe condition and 12 age- and gender-matched healthy donors PCR negative for SARS-CoV-2 were enrolled. (A) Representative flow cytometry plots indicating SARS-CoV-2 positivity of PBMCs from COVID-19 patients in comparison with isotype control and healthy donors. (B) Violin plot showing the frequencies of SARS-CoV-2-infected cells from COVID-19 patients. (C) Percentages of SARS-CoV-2-infected cells considering different immunophenotypes in COVID-19 patients. (D) Immunofluorescence of PBMCs from COVID-19 patients labelling for SARS-CoV-2 (red), nuclei (blue), and immunophenotypes as CD4, CD19, or CD14 (green). Scale bar, 50 µm. (E) Heat map indicating SARS-CoV-2-positive cell frequencies for each immunophenotype, stratified by time from symptom onset (patient number/days after symptom onset). Data were plotted individually for each COVID-19 patient analyzed. (F) Correlation and linear regression analysis between time after symptom onset and frequencies of SARS-CoV-2-positive cells. Both P and r values are indicated in the graphs. The best-fitting line is displayed in colors, while the light-colored area represents the confidence interval. P-values <0.05 were considered significant.
Figure 4
Figure 4
PBMCs from COVID-19 patients present dsRNA, a coronavirus hallmark of replication. PBMCs from healthy donors (A) or COVID-19 patients (B) were isolated and cultivated on coverslips pre-treated with poly-D-lysine. Cells were fixed and stained for SARS-CoV-2 (red), immune phenotypes as CD4, CD19, or CD14 (green), dsRNA (cyan), and nuclei (blue). Immunofluorescence was examined using confocal microscopy. In the bottom left corner of each channel, an inset of the labelling phenotype is shown. Representative images for each immunophenotype are shown, where at least two patients were analyzed. Magnification, 630×. Scale bar, 10 µm.
Figure 5
Figure 5
SARS-CoV-2 is detected in diverse immune cell types in COVID-19 lung autopsies. (AC) SARS-CoV-2 antigen detection (pseudocolored in green) with sequential staining for CD4 (A), CD20 (B), and CD14 (C) surface markers, pseudocolored in red. (D) Staining for IL-6, pseudocolored in magenta. The overlaid layers from the previous sequential rounds of staining are displayed with superimposed staining indicated in yellow. Dashed line-boxed areas are zoomed in and shown in right panels. Magnification, 400×. Scale bar, 50 µm.

Update of

  • Infection of human lymphomononuclear cells by SARS-CoV-2.
    Pontelli MC, Castro IA, Martins RB, Veras FP, Serra L, Nascimento DC, Cardoso RS, Rosales R, Lima TM, Souza JP, Caetité DB, de Lima MHF, Kawahisa JT, Giannini MC, Bonjorno LP, Lopes MIF, Batah SS, Siyuan L, Assad RL, Almeida SCL, Oliveira FR, Benatti MN, Pontes LLF, Santana RC, Vilar FC, Martins MA, Cunha TM, Calado RT, Alves-Filho JC, Zamboni DS, Fabro A, Louzada-Junior P, Oliveira RDR, Cunha FQ, Arruda E. Pontelli MC, et al. bioRxiv [Preprint]. 2020 Aug 7:2020.07.28.225912. doi: 10.1101/2020.07.28.225912. bioRxiv. 2020. Update in: J Mol Cell Biol. 2022 Aug 17;14(4):mjac021. doi: 10.1093/jmcb/mjac021. PMID: 34013264 Free PMC article. Updated. Preprint.

References

    1. Alves-Filho J.C., Freitas A., Souto F.O.et al. (2009). Regulation of chemokine receptor by Toll-like receptor 2 is critical to neutrophil migration and resistance to polymicrobial sepsis. Proc. Natl Acad. Sci. USA 106, 4018–4023. - PMC - PubMed
    1. Bailey A.L., Dmytrenko O., Greenberg L.et al. (2021). SARS-CoV-2 infects human engineered heart tissues and models COVID-19 myocarditis. JACC Basic Transl. Sci. 6, 331–345. - PMC - PubMed
    1. Banerjee A., Nasir J.A., Budylowski P.et al. (2020). Isolation, sequence, infectivity, and replication kinetics of severe acute respiratory syndrome Coronavirus 2. Emerg. Infect. Dis. 26, 2054–2063. - PMC - PubMed
    1. Barnes B.J., Adrover J.M., Baxter-Stoltzfus A.et al. (2020). Targeting potential drivers of COVID-19: neutrophil extracellular traps. J. Exp. Med. 217, e20200652. - PMC - PubMed
    1. Blanco-Melo D., Nilsson-Payant B.E., Liu W.C.et al. (2020). Imbalanced host response to SARS-CoV-2 drives development of COVID-19. Cell 181, 1036–1045.e9. - PMC - PubMed

Publication types