Review
. 2022 Jun 1;95(1134):20220034.
doi: 10.1259/bjr.20220034. Epub 2022 May 12.

Multidelay ASL of the pediatric brain

Affiliations
Review

Multidelay ASL of the pediatric brain

Xavier Golay et al. Br J Radiol. .

Abstract

Arterial spin labeling (ASL) is a powerful noncontrast MRI technique for evaluation of cerebral blood flow (CBF). A key parameter in single-delay ASL is the choice of postlabel delay (PLD), which refers to the timing between the labeling of arterial free water and measurement of flow into the brain. Multidelay ASL (MDASL) utilizes several PLDs to improve the accuracy of CBF calculations using arterial transit time (ATT) correction. This approach is particularly helpful in situations where ATT is unknown, including young subjects and slow-flow conditions. In this article, we discuss the technical considerations for MDASL, including labeling techniques, quantitative metrics, and technical artefacts. We then provide a practical summary of key clinical applications with real-life imaging examples in the pediatric brain, including stroke, vasculopathy, hypoxic-ischemic injury, epilepsy, migraine, tumor, infection, and metabolic disease.


Figures
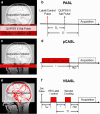
Figure 1.
Figure 1.
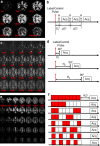
Geometrical representation (a,c,e) and pulse sequence diagrams (b,d,f) for various ASL labeling schemes. Labeling components of pulse sequences are shown in red. For PASL (a), labeling is volume selective and occurs in a single instant (b). The labeling duration is set by the additional saturation pulse applied so as to cut off the tail of the labeled blood bolus. The time TI is selected to allow the labeled spins to enter into the acquisition volume. For pCASL, the labeling volume is restricted to a thick plane (c), applied over a long labeling duration t (d). A corresponding postlabel delay (PLD) is included to allow the labeled spins to clear the intravascular space. For velocity-selective ASL (VSASL), the pulse sequence includes a saturation pulse, and two labeling modules (also applied over a very short amount of time), which are non-spatially selective, but will select all the flowing spins (red in (e)). These can then be detected after a post-labelling delay (PLD) (f), in a way similar to pCASL (d).
Figure 2.
Figure 2.
Multidelay ASL images acquired using the Look-Locker technique (a), Multi-TI technique (c), and Hadamard encoding (e). The pulse sequence timings are represented on the right hand side. For the Look-Locker technique (b), a single acquisition is needed to acquire all images, using a small flip angle α. For the Multi-TI technique, the same sequence is basically repeated multiple times after various inversion times TIn . Finally in the case of Hadamard encoding (here as an example using Walsh-ordered encoding steps), for each acquisition, a different series of label (red) and control (white) steps is applied, and a numerical algorithm allows to reconstruct individual perfusion-weighted images at different ΔTIs. Figure 2c, courtesy of M. Guenther. Figure 2e adapted from with permission.
Figure 3.
Figure 3.
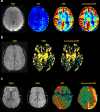
Arterial stroke. (a) Acute right MCA infarct with abrupt arterial cutoff and restricted diffusion (arrows). MDASL shows prolonged ATT with arterial transit artefact (arrows), indicating slow flow with attempted leptomeningeal collateralization. Transit time-corrected CBF is decreased (arrows) beyond the area of core infarct. This DWI-ASL mismatch indicates tissue at risk (ischemic penumbra), which can theoretically be rescued by early recanalization. In the absence of intervention, this region is likely to progress to completed infarct. (b) Subacute left MCA infarct, with edema evolving to encephalomalacia (arrows). MDASL shows minimal attempted collateralization with arterial transit artefact on ATT map and matched decrease in CBF (arrows). Transit time correction improves estimation of normal CBF and homogeneity across the field-of-view.
Figure 4.
Figure 4.
Venous stroke. (a) Acute venous infarct in patient with genetic malformations and coagulopathy. Bifrontal hematomas with layering fluid-blood levels, cortical and medullary venous thrombosis (arrows). MDASL with transit time correction shows elevated bifrontal ACBV and CBF, reflecting combined venous congestion and inflammation. (b) Chronic right anterior temporal hemorrhagic venous infarct (black asterisks) with thrombus in the right vein of Labbe and transverse sinus (arrows). MDASL shows decreased flow to the right anterior temporal lobe (white asterisks) with high venous signal in the transverse sinus (arrows). Transit time correction better quantifies flow to parenchyma.
Figure 5.
Figure 5.
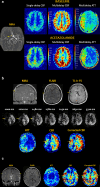
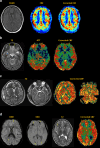
Moyamoya disease. (a) Right moyamoya disease with high-grade stenosis of the right carotid terminus and branches (yellow arrow), with incomplete reconstitution of distal branches via leptomeningeal collaterals. In this slow-flow condition, single-delay ASL markedly underestimates CBF. MDASL more accurately calculates CBF by accounting for slow flow through collateral vessels at long PLDs. At rest, there is increased ATT and decreased CBF in the right MCA distribution (arrows). Following intravenous acetazolamide challenge, maximal vasodilation induces diffusely elevated perfusion with reduction of ATT and CBF defects. This indicates intact residual cerebrovascular reserve, meaning that the patient is not at immediate risk of ischemia, and surgery can be delayed. (a) Down syndrome with right moyamoya post pial synangiosis (arrows). Chronic white matter ischemia and lacunar infarcts are present in the right hemisphere, with overlying enhancing leptomeningeal collaterals. seven consecutive PLDs demonstrate slow retrograde flow through the synangiosis (arrows) into the right MCA territory. There is progressive regional improvement in right hemispheric perfusion defects, with residual borderzone hypoperfusion. MDASL shows persistently increased ATT and decreased CBF to the right external vascular borderzones, better quantified after transit time correction. (b) Bilateral moyamoya disease with high-grade ICA occlusions, post bilateral synangiosis (arrows) communicating with leptomeningeal vessels. Multifocal lacunar infarcts are present, with numerous lenticulostriate and thalamoperforator moyamoya collaterals. MDASL shows patent synangioses with decreased ATT and increased CBF (arrows). Slow flow through synangiosis and collateral vessels is reflected in transit time-corrected CBF. There is residual hypoperfusion to the external vascular borderzones with elevated ATT and decreased CBF.
Figure 6.
Figure 6.
Other vasculopathies. (a) Sickle cell anaemia with scattered lacunar infarcts and radiating linear white matter FLAIR hyperintensities (yellow arrows). MDASL with transit time correction shows increased ATT and decreased CBF to the bilateral vascular watershed zones, between major arterial territories and within deep white matter (white arrows). (b) Posterior reversible encephalopathy with edema in the deep gray nuclei, parieto-occipital cortex and white matter (yellow arrows). MDASL shows increased ATT and decreased CBF to the bilateral posterior watershed zones with arterial transit artefact (white arrows). Transit time correction increases sensitivity for seizure-induced cortical hyperperfusion, with the watershed hypoperfusion areas less apparent.
Figure 7.
Figure 7.
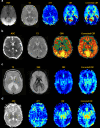
Hypoxic-ischemic injury.(a) Watershed infarcts in patient with coagulopathy and septic shock. DWI shows bilateral external watershed infarcts (yellow arrows). MDASL shows mildly elevated ATT and decreased CBF in the external vascular borderzones (white arrows). (b) Acute anoxic injury post-cardiac arrest with diffuse cerebral edema and diffusion restriction noted throughout gray and white matter. MDASL with transit time correction shows prominent rebound hyperperfusion with diffusely elevated CBF and ACBV. (c) Preterm birth injury with Grade 3 intraventricular hemorrhage involving the bilateral caudothalamic grooves (arrows), choroid plexi, and ventricular ependyma with hydrocephalus. There is immature sulcation and patchy white matter injury with faint periventricular T2 hyperintense signal. MDASL shows decreased periventricular white matter perfusion, with more accurate estimation following transit time correction. (a) Term birth injury. ADC map shows mild diffusion restriction in the posterior limbs of internal capsules and ventrolateral thalami (yellow arrows), as well as T2 hyperintense white matter signal in the external vascular borderzones. MDASL shows elevated ATT to the external vascular borderzones (white arrows). CBF shows mild rebound hyperperfusion to the bilateral basal ganglia and corticospinal tracts (black arrows), representing areas of perinatal selective vulnerability. Transit time correction improves estimation of brain perfusion. (b) Neonatal abstinence syndrome in an infant born to an opioid-dependent mother. MDASL is useful in accurately quantifying neonatal brain perfusion, which is typically low at birth. Increased CBF at birth has been observed both globally and regionally in NAS babies relative to normal controls. Opioids alter CBF depending on baseline cerebrovascular tone, such that acute drug withdrawal likely impacts both cerebral autoregulation and autonomic activity.
Figure 8.
Figure 8.
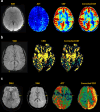
Epilepsy. (a) Cortical dysplasia of the right parieto-occipital region, showing disorganized sulcation with irregular gray-white junction (dotted circle). MDASL performed in interictal phase demonstrates corresponding focally decreased flow to the area of dysplasia (arrows). Because seizures are a high-flow phenomenon, transit time correction does not significantly alter the CBF results in normal brain. The area of hypoperfusion is present, though less apparent due to weighting towards longer PLDs. (b) Sturge-Weber of the left posterior quadrant with enhancing dysplastic veins in the subarachnoid space, parenchymal atrophy and gyriform calcifications (arrows). MDASL shows increased ATT and decreased CBF in the affected region (arrows). Transit time correction leads to better and more homogeneous flow quantification in normal brain. (c) Infantile spasms in West syndrome. Anatomic imaging is normal. MDASL shows diffusely elevated perfusion to cerebral cortex and basal ganglia. Findings are similar after transit time correction in this high-flow condition. (d) Chronic epilepsy in patient with Down syndrome. There is mild global volume loss and white matter signal abnormality. MDASL shows prolonged ATT and decreased CBF throughout the brain, more so along the external vascular borderzones. Transit time correction improves estimation of brain perfusion.
Figure 9.
Figure 9.
Migraine. (a) Migraine aura. Transient right facial droop and receptive (Wernicke) aphasia. MDASL shows elevated ATT and decreased CBF to the left motor strip and posterior quadrant in a non-arterial distribution, with corresponding cortical venous engorgement (arrows). Transit time correction improves estimation of overall brain perfusion, though the hypoperfused areas are less apparent. (b) Migraine cephalalgia. Several days of right headache with left homonymous hemianopsia. MDASL with transit time correction shows rebound hyperperfusion with elevated CBF and ACBV to the right posterior quadrant, including visual cortex (arrows). There is also decreased deoxyhemoglobin content within cortical veins on SWI. (c) Therapy-resistant right hemiplegic migraine. Subtle fullness and restricted diffusion of the left cerebral cortex, with decreased cortical venous susceptibility (arrows). MDASL shows rebound hyperperfusion with decreased ATT And increased CBF throughout the left cerebral hemisphere (arrows).
Figure 10.
Figure 10.
Trauma. (a) Concussion in high school athlete with persistent language difficulties. Anatomic MRI is normal. MDASL shows heterogeneous perfusion to gray and white matter, better quantified after transit time correction. (b) Low-impact trauma from fall with bifrontal hemorrhagic cerebral contusions (arrows). MDASL shows increased ATT and decreased corrected CBF (arrows). (c) Diffuse axonal injury from motor vehicle accident with comminuted fractures, subgaleal and extraaxial hemorrhage, pontine hematoma (arrows), and diffuse cerebral edema. MDASL shows heterogeneously elevated cerebral perfusion adjacent to hemorrhage, and hypoperfusion in areas of edema. (d) Diffuse axonal injury from motor vehicle accident. Microstructural shear injury involves the gray-white junction and deep white matter (arrows). MDASL shows heterogeneously reactive cortical flow and hypoperfusion to areas of injury.
Figure 11.
Figure 11.
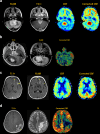
Tumor. (a) Ependymoma of fourth ventricle and left foramen of Luschka, with heterogeneous internal enhancement. MDASL shows elevated CBF within tumor, more accurately quantified following transit time correction. (b) Right cerebellar pilocytic astrocytoma with solid & cystic components. MDASL shows mildly elevated CBF within solid tumor, and decreased CBF within cystic components. (c) Recurrent disseminated medulloblastoma with left frontal lobe parenchymal and leptomeningeal metastases, demonstrating enhancement and surrounding vasogenic edema (yellow arrows). MDASL shows elevated perfusion within the metastases, on a background of posttreatment encephalomalacia. Tumoral flow is better detected after transit time correction (white arrows).(d) Metastatic rhabdomyosarcoma with infiltrative cortical enhancement and vasogenic edema of left parietal lobe. MDASL shows elevated perfusion within the metastasis, and decreased perfusion in the areas of edema.
Figure 12.
Figure 12.
Infection. (a) Streptococcus pneumonia meningitis with leptomeningeal enhancement and right frontal subdural empyema (arrows). MDASL shows diffusely elevated cortical perfusion accompanying the meningeal inflammation, better estimated after transit time correction. (b) Group B streptococcus meningitis. Mild leptomeningeal enhancement with left subdural empyemas (yellow arrows). MDASL shows heterogeneously elevated flow (CBF and ACBV) along the left dura mater and cerebral cortex (white arrows).
Figure 13.
Figure 13.
Metabolic disease. (a) Batten disease with patchy white matter signal abnormality, global cerebral and cerebellar volume loss. MDASL shows prolonged ATT in the external vascular borderzones, with heterogeneous decrease in white matter CBF. (b) Nonketotic hyperglycinemia with diffuse white matter edema and restricted diffusion in bilateral corticospinal tracts (yellow arrows). MDASL with transit time correction shows elevated ACBV and CBF in the basal ganglia and corticospinal tracts (white arrows), suggesting primary energy failure. There is low perfusion to the edematous white matter.

Similar articles

Cited by

References

    1. Detre JA, Leigh JS, Williams DS, Koretsky AP . Perfusion imaging . Magn Reson Med 1992. ; 23: 37 – 45 . doi: 10.1002/mrm.1910230106 - DOI - PubMed
    1. Williams DS, Detre JA, Leigh JS, Koretsky AP . Magnetic resonance imaging of perfusion using spin inversion of arterial water . [ Internet ]. Proc Natl Acad Sci U S A 1992. ; 89: 212 – 16 . doi: 10.1073/pnas.89.1.212 - DOI - PMC - PubMed
    1. Alsop DC, Detre JA, Golay X, Günther M, Hendrikse J, Hernandez-Garcia L, et al. . Recommended implementation of arterial spin-labeled perfusion MRI for clinical applications: A consensus of the ISMRM perfusion study group and the european consortium for ASL in dementia . Magn Reson Med 2015. ; 73: 102 – 16 . doi: 10.1002/mrm.25197 - DOI - PMC - PubMed
    1. Kim SG . Quantification of relative cerebral blood flow change by flow-sensitive alternating inversion recovery (FAIR) technique: application to functional mapping . Magn Reson Med 1995. ; 34: 293 – 301 . doi: 10.1002/mrm.1910340303 - DOI - PubMed
    1. Edelman RR, Chen Q . EPISTAR MRI: multislice mapping of cerebral blood flow . Magn Reson Med 1998. ; 40: 800 – 805 . doi: 10.1002/mrm.1910400603 - DOI - PubMed